





1 Developer. 5 Months. A Revenue Generating App With 100K Users With Firebase

7860
Of your peers have already read this article.
5:30 Minutes
The most insightful time you'll spend today!
This is a guest post authored by Firebase customer, Anton Ivanov, Founder & CEO of DealCheck
Real estate investing is a fantastic way to build a stream of passive income and grow your wealth. Numerous studies have pointed out that real estate investing has created more millionaires throughout history than any other form of investing (like this one and this one). So why don’t more people do it?
I asked myself this very question a few years ago after talking to a group of friends about the success I’ve had with real estate, and listening to their reasons why they think it’s out of their reach.
A common theme among them was that they viewed it as something too difficult to learn and master. There were too many steps, the learning curve was steep and there was a lot of room for mistakes for somebody just starting out, especially when analyzing the financial performance of potential investment properties.
Traditionally, most investors used spreadsheets to do the math – which works only if you know what and how you’re calculating something. But if you don’t know that, it’s very easy to make mistakes and overlook things. And no one wants to make mathematical errors before a huge purchase like an investment property.
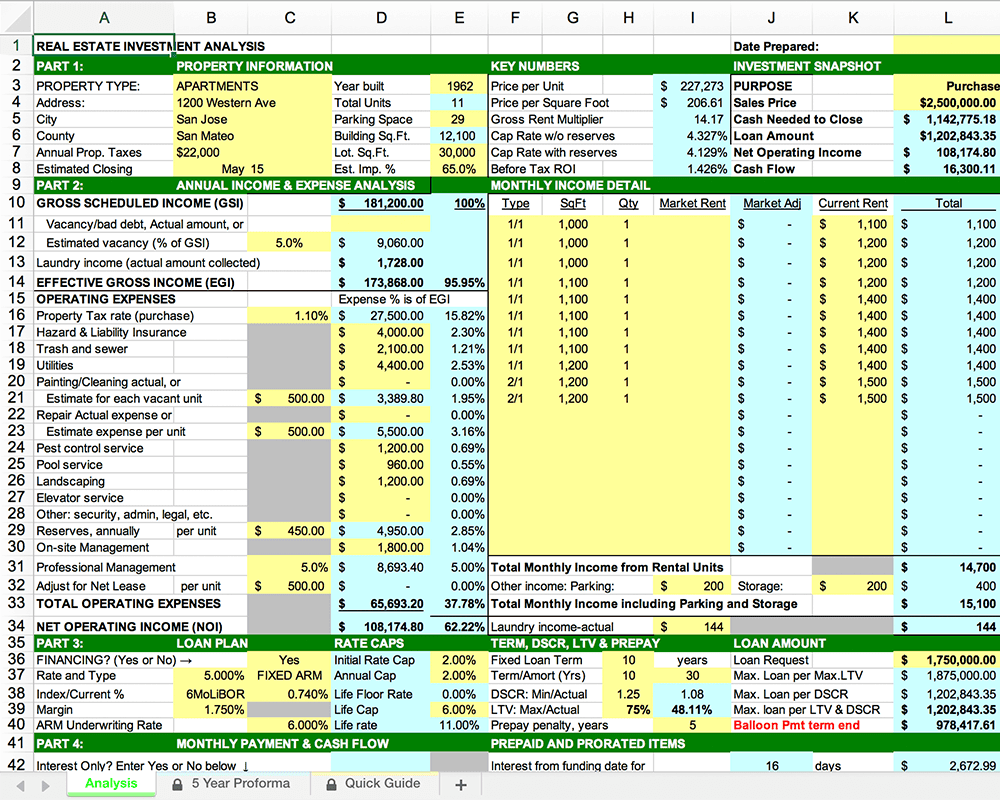
Where do I even begin?!
And that’s when I had the idea to build DealCheck – a cloud-based, easy-to-use property analysis tool for real estate investors and agents. I wanted to create a platform that would help new investors learn the ropes and avoid costly mistakes, but at the same time provide the flexibility to perform more advanced analysis with a click of a button.
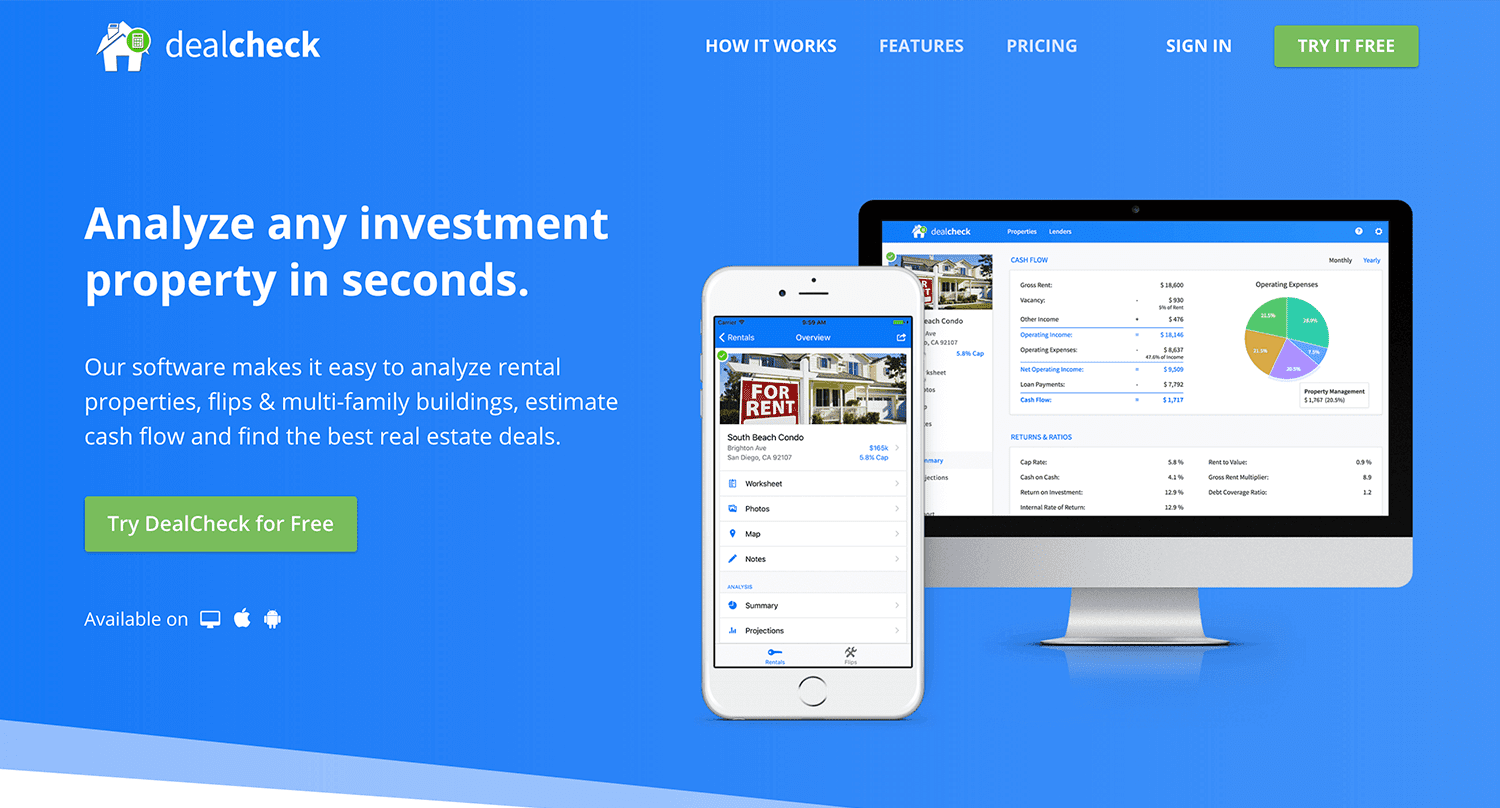
Making real estate investing easier and more accessible.
The Challenges of Solo Development
I was working as a front-end engineer at the time, so I knew I could build the UI myself, but what about the back-end, data storage, authentication, and a bunch of other things you need for a full-functioning cloud app?
I didn’t know anybody I could bring on as a co-founder, so I set out to research what technologies and platforms I could leverage to help me with the back-end and server infrastructure.
Firebase kept popping up again and again and I began to look at it in more detail. It was then recently acquired by Google and its collection of BaaS (backend-as-a-service) modules seemed to offer the exact solution I needed to build DealCheck.
I was especially impressed with the documentation for each feature and how well all of the different technologies could be tied together to create one unified platform.
It wasn’t long before I signed up and started building the first MVP of the app.
Using Firebase to Quickly Build a Scalable Backend
As the only developer on the project, I had limited time and resources to spend on building the back-end, so I set out to use every Firebase feature that was available at the time to my advantage.
My goal was actually to write as little server-side code as possible and instead focus on leveraging the different Firebase modules to solve three specific challenges:
Challenge #1 – Authentication and User Management
The first one was authentication and user management. DealCheck’s users needed the ability to create their accounts so they can view and analyze properties on any device (more on that later). I wanted to have the ability to sign in with email, Facebook or a Google account.
Firebase Authentication was designed specifically for this purpose and I used it to handle pretty much the entire authentication flow. Out-of-the-box, it has support for all the major social networks, cross-network credential linking and the basic account management operations like email changes, password resets and account deletions.
There was no server-side code required at all – I just needed to build the UI on the front-end.
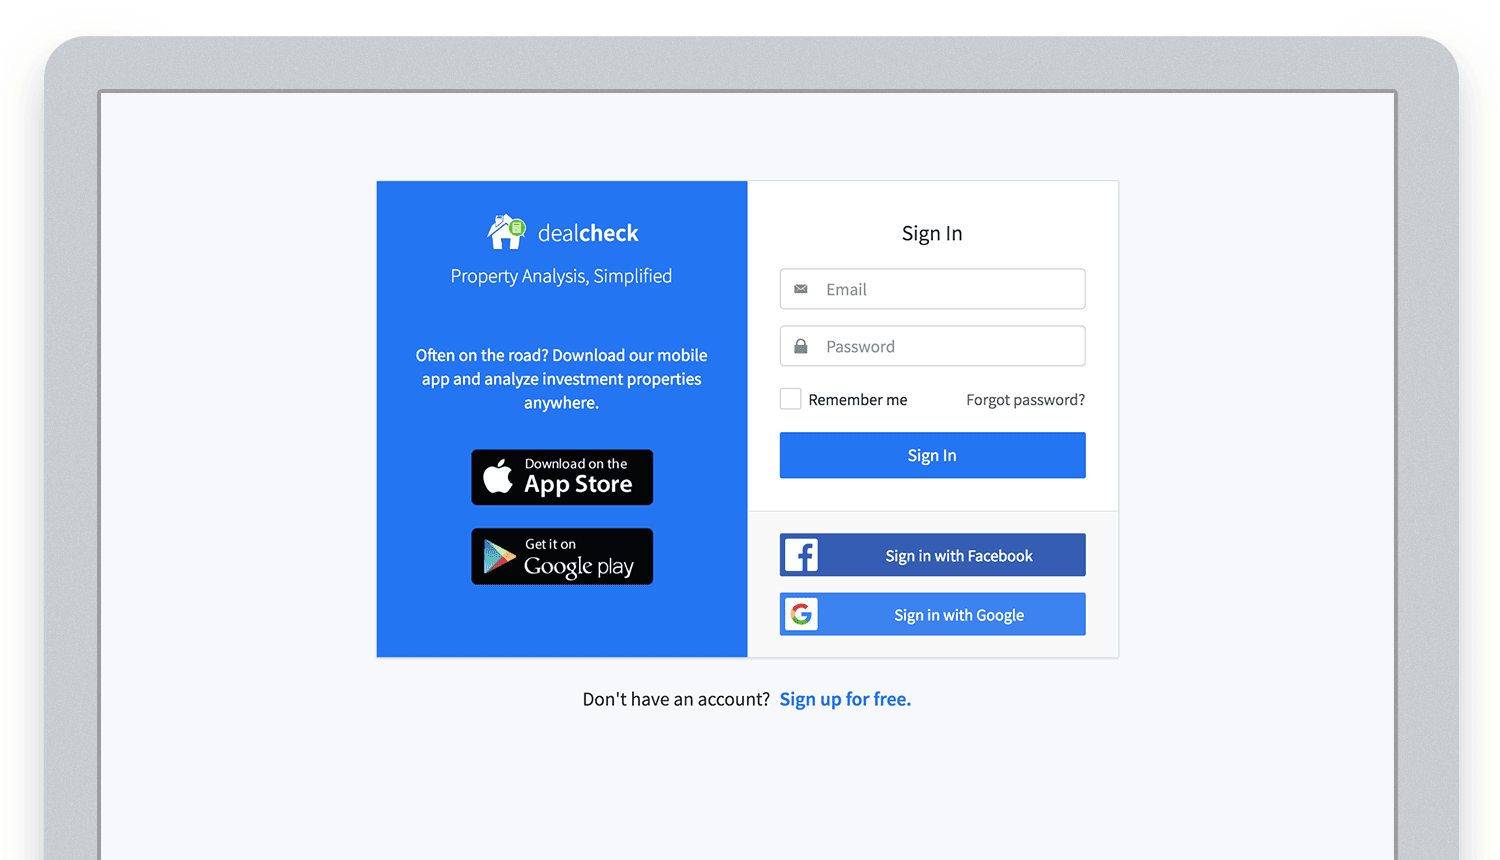
Email, Facebook and Google sign in powered by Firebase.
And as an added benefit, Firebase Authentication ties directly into the Realtime Database product to create a declarative permissions and access control framework that’s easy to implement and maintain. This helped me make sure user data was protected from unauthorized access, but also facilitate data sharing among users.
Challenge #2 – Cloud Storage with Cross-Device Sync
Next up was data storage. I knew that I wanted DealCheck’s users to be able to use the app and analyze properties online, on iOS and Android. So I needed a real-time, cloud-based database solution that could sync data across any device.
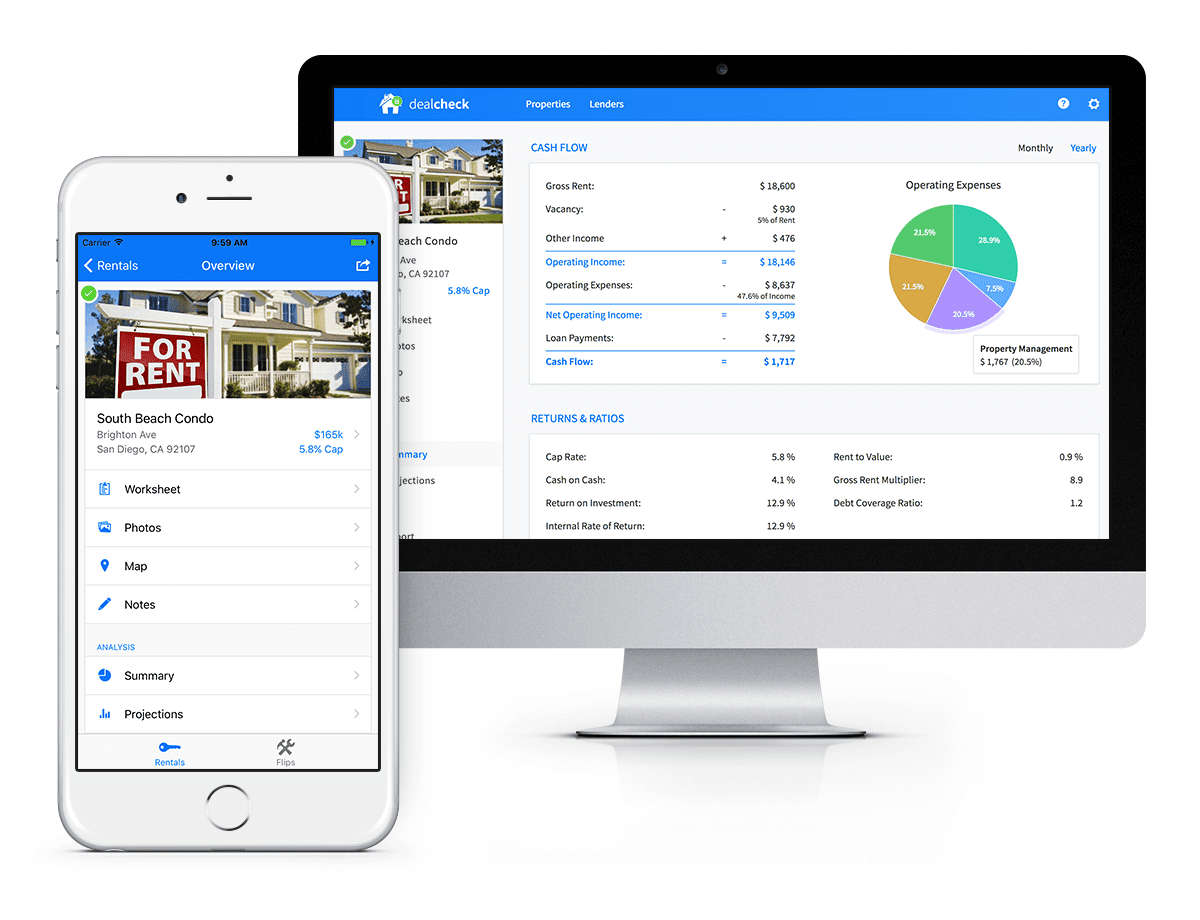
Syncing data across web and mobile is not easy!
Firebase Realtime Database is a NoSQL, JSON-based database solution that was designed exactly for this purpose, and I was actually surprised how great it worked. I used the official AngularJS bindings for Firebase on the front-end to read and write to it directly from the client.
I had to do some extra work on mobile to implement an offline mode with syncing after reconnections, but all-together the code required to make everything work was minimal.
As I mentioned, Firebase Authentication tied directly to the database to facilitate access control, so I really didn’t need to do anything extra there. And I was able to set up automatic daily backups of all the data with a click of a button.
Challenge #3 – Third-Party Integrations
Up to now, I had written exactly 0 lines of server-side code and everything was handled by the client directly. As DealCheck’s development progressed, however, I knew that I would need a server to handle some operations that could not be done in the client.
I wasn’t very experienced with server maintenance and DevOps, but fortunately the Firebase Cloud Functions product was able to solve all of my needs. Cloud Functions are essentially single-purpose functions that can be triggered (or executed) based on a specific HTTP request or events coming from the Authentication, Realtime Database or other Firebase products.
Each function can be run once based on a specific event trigger to perform its prescribed task. You don’t have to worry about provisioning a server instance or managing load – everything is done automatically for you by Firebase.
What’s even cooler, is that Cloud Functions can access the Realtime Database and Cloud Storage buckets of the same project, performing operations on them server-side, as needed.
This is how DealCheck processes subscription payments through Stripe, validates Apple and Google Play mobile subscription receipts, integrates with third-party APIs and updates database records without user interaction.
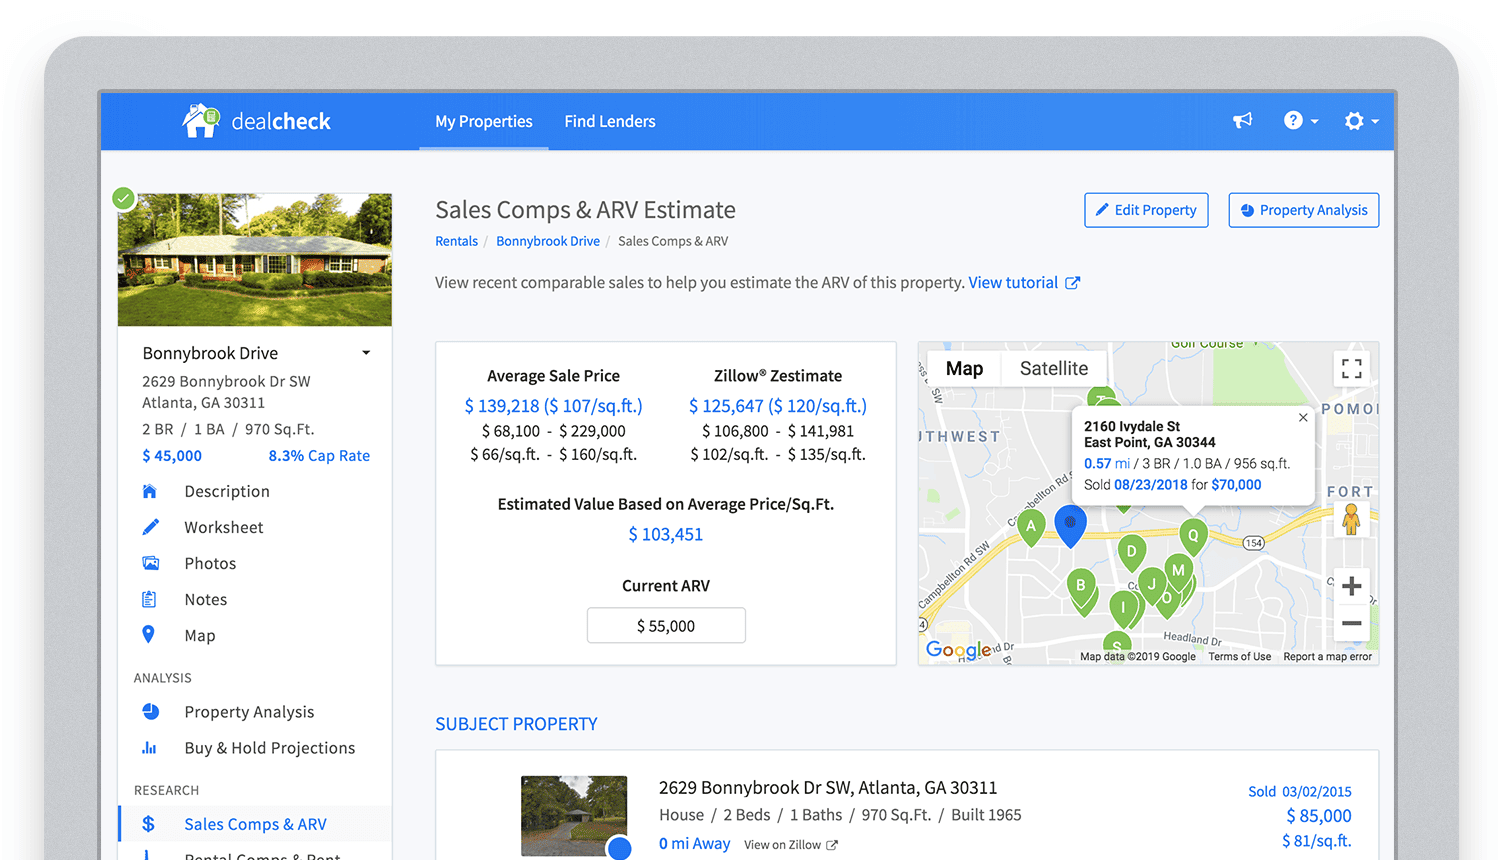
Bringing in sales comparable data from third-party providers into DealCheck.
Cloud Functions became the “glue” that tied the entire back-end infrastructure together.
Growing from an MVP to 100,000 Users with Firebase
The first version of the DealCheck app was built and launched in less than 5 months with just me on the development team. I definitely don’t think that would have been possible without Firebase powering the back-end infrastructure. Maybe the project wouldn’t have ever launched at all.
While Firebase is awesome for quick MVP development, it’s definitely designed to power production applications at scale as well. As DealCheck grew from a small side-project to one of the most popular real estate apps with over 100k users, all of the Firebase products that we use scaled to support the increasing load.
Moreover, the fantastic interoperability of all Firebase modules allows us to develop and release new features much faster because of the reduced coding requirements and ease of configuration.
So next time you’re looking to build an ambitious project with a small team – take a look at how Firebase can help you reduce development time and provide a suite of powerful tools that scale as your business grows.
This is exactly how DealCheck grew from a simple idea to make property analysis easier and faster, to an app that is helping tens of thousands of people grow their wealth and passive income through real estate investing. It’s a truly awesome and fulfilling experience to see your work positively impact so many people and it wouldn’t have been possible without Firebase.
BigQuery’s User-friendly SQL is Like a Cool Drink for Hot Summer

5669
Of your peers have already read this article.
2:30 Minutes
The most insightful time you'll spend today!
With summer just around the corner, things are really heating up. But you’re in luck because this month BigQuery is supplying a cooler full of ice cold refreshments with this release of user-friendly SQL capabilities.
We are pleased to announce three categories of BigQuery user-friendly SQL launches: Powerful Analytics Features, Flexible Schema Handling, and New Geospatial Tools.
Powerful Analytics Features
These powerful SQL analytics features provide greater flexibility to analysts for organizing, filtering, and rendering data in BigQuery than ever before. You can enable spreadsheet-like functionality on summarized data using PIVOT and UNPIVOT and filter irrelevant data in analytic functions using QUALIFY.
Through this section, we will become familiar with these new features through examples using the BigQuery Public dataset, usa_names.
PIVOT/UNPIVOT (Preview)
One of the most time-consuming tasks for data analytics practitioners is wrangling data into the right shape. SQL is great for wrangling data, but sometimes you want to reformat a table as you would in a spreadsheet, pivoting rows and columns interchangeably. To support this use case, we are pleased to introduce PIVOT and UNPIVOT operators in BigQuery. PIVOT creates columns from unique values in rows by aggregating values, and UNPIVOT reverses this action.The example below uses PIVOT on bigquery-public-data.usa_names.usa_1910_current to show the number of males and females born each year, representing each gender as a column. Then UNPIVOT reverses this action.
Language: SQL
-- we start with SQL to create a simple table-- we only include gender, year, and number.CREATE TABLEmydataset.sampletable1 AS (SELECTGender,Year,SUM(Number) AS NumberFROM`bigquery-public-data.usa_names.usa_1910_current`WHEREYear >= 2017GROUP BYGender, Year);-- The resulting table:--+----------------------------------------+--| Gender | Year | Number |--+----------------------------------------+--| F | 2019 | 1353716 |--| F | 2017 | 1403989 |--| F | 2018 | 1380382 |--| M | 2018 | 1568678 |--| M | 2019 | 1538056 |--| M | 2017 | 1604609 |--+----------------------------------------+-- use PIVOT to create columns for “female” and “male”CREATE TABLEmydataset.Pivoted ASSELECTyear, male, femaleFROMmydataset.sampletable1PIVOT( SUM(Number) FOR gender IN ('M' AS male,'F' AS female))ORDER BYyear;-- The resulting pivoted table:--+----------------------------------------+--| Year | female | male |--+----------------------------------------+--| 2017 | 1403989 | 1604609 |--| 2018 | 1380382 | 1568678 |--| 2019 | 1353716 | 1538056 |--+----------------------------------------+-- UNPIVOT reverses the row/column rotation of PIVOT.SELECT*FROMmydataset.PivotedUNPIVOT(number FOR gender IN (male AS 'M',female AS 'F'));
QUALIFY (Preview)
More advanced users of SQL know the power of analytic functions (aka window functions). These functions compute values over a group of rows, returning a single result for each row. For example, customers use analytic functions to compute a grand total, subtotal, moving average, rank, and more. With the announcement of support for QUALIFY, BigQuery users can now filter on the results of analytic functions by using the QUALIFY clause.
QUALIFY belongs in the family of query clauses used for filtering along with WHERE and HAVING. The WHERE clause is used to filter individual rows in a query. The HAVING clause is used to filter aggregate rows in a result set after aggregate functions and GROUP BY clauses. The QUALIFY clause is used to filter results of analytic functions.
To show the utility of QUALIFY, the example below uses QUALIFY to return the top 3 female names from each year in the last decade using from bigquery-public-data.usa_names.usa_1910_current.
Language: SQL
-- QUALIFY filters the result of the RANK functionSELECTname,year,SUM(number) AS total,RANK() OVER (PARTITION BY yearORDER BY SUM(number) DESC) AS rankFROM`bigquery-public-data.usa_names.usa_1910_current`WHEREgender = 'F'AND YEAR >= 2010GROUP BY 1,2QUALIFY RANK <= 3ORDER BY 2,4;
Flexible Schema Handling
New SQL for administrators and data engineers enables table renaming for data pipeline processes, as well as flexible column management.
Table Rename (GA)
In data pipeline processes, tables are often created and then renamed so that they can make way for the next iteration of the pipeline run. To accomplish this, customers need a mechanism by which they can create a table and then subsequently rename it. Now if customers want to change this name using SQL, they can. Using the simple syntax that ALTER TABLE RENAME TO provides, customers will be able to rename a table after creation to clear the way for the next iteration of tables in the data pipeline.
Language: SQL
-- create a sample table “tablename” in “mydataset”.-- You will rename this table.CREATE OR REPLACE TABLE dataset.tablename(col1 STRING,col2 NUMERIC);-- if this table “tablename” becomes obsolete-- perform Table Rename to “obsoletetable”ALTER TABLEmydataset.name RENAME TO obsoletetable;
DROP NOT NULL constraints on a column (GA)
While BigQuery has historically provided many tools available in the UI, CLI and APIs, we know that many administrators prefer interfacing with the database using SQL. BigQuery recently released DDL statements which enable data administrators to provision and manage datasets and tables, greatly simplifying provisioning and management. Today, we continue the next addition in this line of releases by announcing ALTER COLUMN DROP NOT NULL constraint on a column:
- ALTER COLUMN DROP NOT NULL allows the administrator to remove the NOT NULL constraint from a column in BigQuery.
Language: SQL
-- create a table to store credit card numbers-- the business requires this field, so-- include a NOT NULL constraintCREATE TABLEmydataset.customers(credit_card_number STRING NOT NULL);-- if needs of the business no longer require this field,-- the customer can allow null entries in this column-- by dropping the constraintALTER TABLEmydataset.customersALTER COLUMN credit_card_number DROP NOT NULL;
CREATE VIEW with column list (GA)
Views are used ubiquitously by BigQuery customers to capture business logic. Oftentimes, BigQuery users have business requirements to assign aliases to columns in views. Now BigQuery supports doing so upon view creation in a column name list format with the release of CREATE VIEW with column list syntax.
Language: SQL
-- aliases list1 and list2 can be assigned in a list formatCREATE VIEWmyview (list1, list2) ASSELECTcolumn_1, column_2FROMmydataset.exampletable
New Geospatial Tools
ST_POINTN, ST_STARTPOINT, and ST_ENDPOINT
Geospatial data is incredibly valuable to data analytics customers dealing with data from the physical world. BigQuery has very strong geospatial function support to help customers process marketing data, track storms, or manage self-driving cars. Particularly for analyzing vehicle or location tracking data, we’re thrilled to provide three new functions to allow users to easily extract or filter on key points:
For example, when working with vehicle histories, ST_POINTN, ST_STARTPOINT, and ST_ENDPOINT allow users to extract elements such as the start and the end of a trip. For identifying origin-destination pairs these functions will make that task much easier.
Language: SQL
-- pull the first, second, penultimate and final points-- from a linestringWITH linestring as (SELECT ST_GeogFromText('linestring(1 1, 2 1, 3 2, 3 3)') g)SELECTST_StartPoint(g) AS first, ST_EndPoint(g) AS last,ST_PointN(g,2) AS second, ST_PointN(g, -2) as second_to_lastFROMlinestring+--------------+--------------+--------------+----------------+| first | last | second | second_to_last |+--------------+--------------+--------------+----------------+| POINT(1 1) | POINT(3 3) | POINT(2 1) | POINT(3 2) |+--------------+--------------+--------------+----------------+
As sure as a hot summer day pairs well with an ice-cold beverage, these new user-friendly SQL features in BigQuery pair well with your data analytics workflows. To learn more about BigQuery, visit our website, and get started immediately with the free BigQuery Sandbox.
Cloud Bigtable brings database stability and performance to Precognitive

5707
Of your peers have already read this article.
3:40 Minutes
The most insightful time you'll spend today!
At Precognitive, we were able to start with a blank technology slate to support our fraud detection software products. When we started building the initial version of our platform in 2017, we had some decisions to make: What coding language to use? What cloud infrastructure provider to choose? What database to use? The majority of the decisions were straightforward, but we struggled to decide upon a database. We had plenty of collective experience with relational databases, but not with a wide-column database like Cloud Bigtable—which we knew we’d need to scale our behavior and device workloads. At launch, our products were supported by a self-managed database, but we quickly migrated to Cloud Bigtable, and we love it.
To efficiently support our bursty, real-time fraud detection workloads, we needed a cloud database that could satisfy the following key requirements:
- Stability to keep up with increased adoption of our products
- Intelligent scaling that avoids bottlenecks
- Native integrations with BigQuery and Cloud Dataproc
- Managed services that free up our engineers’ time to work on our products
Adding Cloud Bigtable as our performance database
As we scaled our services and added customers, our data collection services for our Device Intelligence and Behavioral Analytics products were seeing thousands of events per second. Cloud Bigtable provided a stable managed database that could handle the volume we were receiving during peak hours. We weren’t always able to handle this scale, as an early version of our product utilized a self-managed database.
Every month, two or three engineers spent hours managing the database instances. Whenever the instances crashed, it would cost at least one engineer a day or two of productivity attempting to restore the instances and recovering any data from our backup database. Managing this database internally was taking precious time away from product development.
We circled back to Cloud Bigtable. After two weeks of R&D, we decided to switch the Device Intelligence and Behavioral Analytics services to Cloud Bigtable.
Cloud Bigtable solved our scaling issues. Cloud Bigtable had been attractive to us from the start because it was fully managed, and offered regional replication and other features we were lacking in our own managed instances. Cloud Bigtable provides horizontal scaling and automatically rebalances row keys (equivalent to a shard key) over time to prevent “hot” nodes. In addition, Cloud Bigtable provides a connector to BigQuery and Cloud Dataproc that allows us to analyze the terabytes of data we are processing and use that data for unsupervised machine learning.
The perks of using Cloud Bigtable
After the migration to Cloud Bigtable, we noticed a number of additional benefits: improved I/O performance, a significant cost reduction, and a sizable decrease in hours spent on database maintenance.
We measured some of our typical metrics before and after implementing Cloud Bigtable. Our request latency dropped by about 30 ms on average (to sub-10 ms) for API requests. Prior to the change, we were seeing latencies of 40+ ms on average. This latency drop on our Behavioral Analytics and Device Intelligence products allowed us to trim about an additional 10 to 15 ms off our average response time across all dependent services.
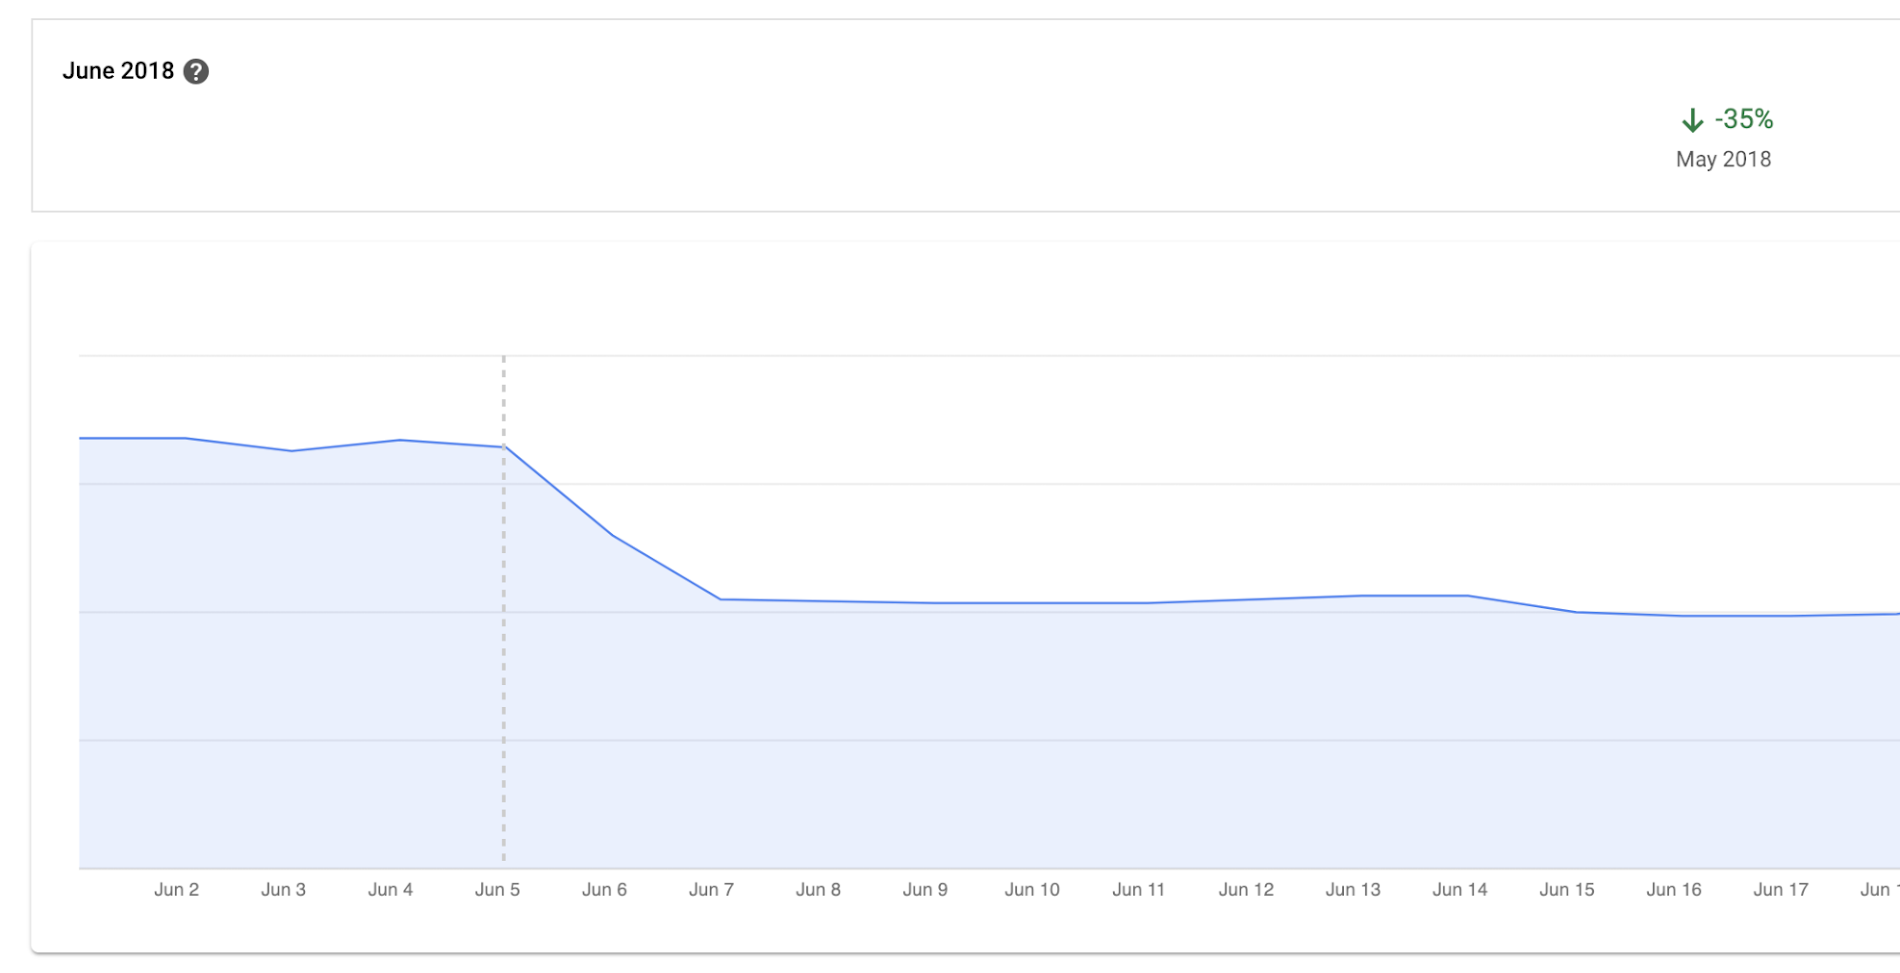
Before we moved to Cloud Bigtable, we had to scale our database instances every time a new customer was onboarded. We were over-scaling in an attempt to avoid constantly resizing our database servers. By sunsetting our self-managed database and switching to Cloud Bigtable, we cut database infrastructure costs by approximately 35% and can now scale as needed, with a couple of clicks, during onboarding.
We have spent zero hours managing a Cloud Bigtable database since launch, and we put the time we are saving every month toward product development.
Moving forward with Cloud Bigtable
As an engineering team, we love working with Cloud Bigtable. We are not only seeing improved developer experience and reduced latency, which keeps the engineers happy, but also reduced costs, which keeps the business happy. We’re able to build more product, too, with the time we’ve saved by switching to Cloud Bigtable. Stay tuned to our engineering blog for more on the lessons we’ve learned and our contributions to the wider Cloud Bigtable community.
Updating Twitter’s Ad Engagement Analytics Platform for the Modern Age

3094
Of your peers have already read this article.
3:30 Minutes
The most insightful time you'll spend today!
As part of the daily business operations on its advertising platform, Twitter serves billions of ad engagement events, each of which potentially affects hundreds of downstream aggregate metrics. To enable its advertisers to measure user engagement and track ad campaign efficiency, Twitter offers a variety of analytics tools, APIs, and dashboards that can aggregate millions of metrics per second in near-real time.
In this post, you’ll get details on how the Twitter Revenue Data Platform engineering team, led by Steve Niemitz, migrated their on-prem architecture to Google Cloud to boost the reliability and accuracy of Twitter’s ad analytics platform.
Deciding to migrate
Over the past decade, Twitter has developed powerful data transformation pipelines to handle the load of its ever-growing user base worldwide. The first deployments for those pipelines were initially all running in Twitter’s own data centers. The input data streamed from various sources into Hadoop Distributed File System (HDFS) as LZO-compressed Thrift files in an Elephant Bird container format. The data was then processed and aggregated in batches by Scalding data transformation pipelines. Then, aggregation results were output into Manhattan, Twitter’s homegrown distributed key-value store, for serving. Additionally, a streaming system using Twitter’s homegrown systems Eventbus (a messaging tool built on top of DistributedLog), Heron (a stream processing engine), and Nighthawk (a sharded Redis deployment) powered the real-time analytics that Twitter had to provide, filling the gap between the current time and the last batch run.
While this system consistently sustained massive scale, its original design and implementation was starting to reach some limits. In particular, some parts of the system that had grown organically over the years were difficult to configure and extend with new features. Some intricate, long-running jobs were also unreliable, leading to sporadic failures. The legacy end-user serving system was very expensive to run and couldn’t support large queries.
To accommodate for the projected growth in user engagement over the next few years and streamline the development of new features, the Twitter Revenue Data Platform engineering team decided to rethink the architecture and deploy a more flexible and scalable system in Google Cloud.
Platform modernization: First iteration
In the middle of 2017, Steve and his team tackled the first redesign iteration of its advertising data platform modernization, leading to Twitter’s collaboration with Google Cloud.
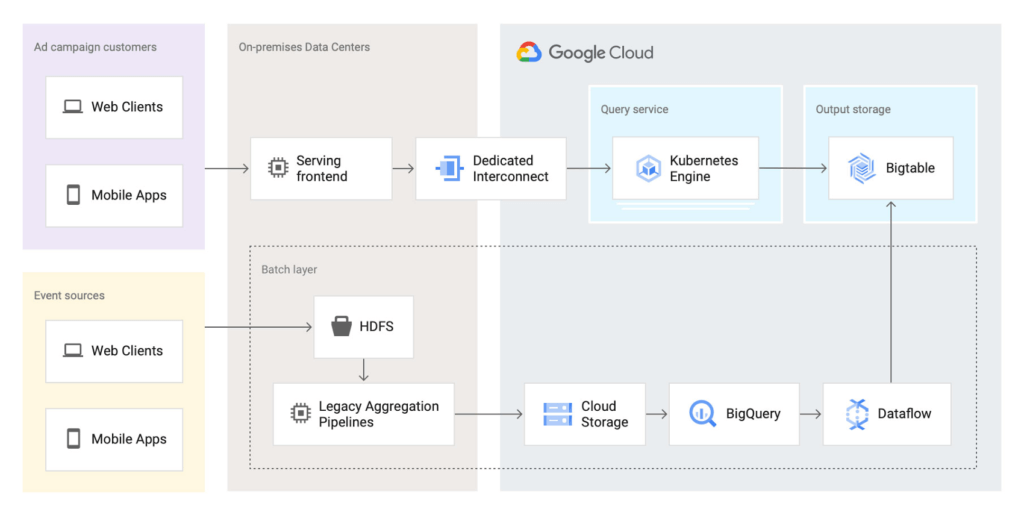
At first, the team left the data aggregation legacy Scalding pipelines unchanged and continued to run them in Twitter’s data centers. But the batch layer’s output was switched from Manhattan to two separate storage locations in Google Cloud:
- BigQuery—Google’s serverless and highly scalable data warehouse, to support ad-hoc and batch queries.
- Cloud Bigtable—Google’s low-latency, fully managed NoSQL database, to serve as a back end for online dashboards and consumer APIs.
The output aggregations from the Scalding pipelines were first transcoded from Hadoop sequence files to Avro on-prem, staged in four-hour batches to Cloud Storage, and then loaded into BigQuery. A simple pipeline deployed on Dataflow, Google Cloud’s fully managed streaming and batch analytics service, then read the data from BigQuery and applied some light transformations. Finally, the Dataflow pipeline wrote the results into Bigtable.
The team built a new query service to fetch aggregated values from Bigtable and process end-user queries. They deployed this query service in a Google Kubernetes Engine (GKE) cluster in the same region as the Bigtable instance to optimize for data access latency.
Here’s a look at the architecture:
This first iteration already brought many important benefits:
- It de-risked the overall migration effort, letting Twitter avoid migrating both the aggregation business logic and storage at the same time.
- The end-user serving system’s performance improved substantially. Thanks to Bigtable’s linear scalability and extremely low latency for data access, the serving system’s P99 latencies decreased from 2+ seconds to 300ms.
- Reliability increased significantly. The team now rarely, if ever, gets paged for the serving system anymore.
Platform modernization: second iteration
With the new serving system in place, in 2019 the Twitter team began to redesign the rest of the data analytics pipeline using Google Cloud technologies. The redesign sought to solve several existing pain points:
- Because the batch and streaming layers ran on different systems, much of the logic was duplicated between systems.
- While the serving system had been moved into the cloud, the existing pain points of the Hadoop aggregation process still existed.
- The real-time layer was expensive to run and required significant operational attention.
With these pain points in mind, the team began evaluating technologies that could help solve them. They considered several open-source stream processing frameworks initially: Apache Flink, Apache Kafka Streams, and Apache Beam. After evaluating all possible options, the team chose Apache Beam for a few key reasons:
- Beam’s built-in support for exactly-once operations at extremely large scale across multiple clusters.
- Deep integration with other Google Cloud products, such as Bigtable, BigQuery, and Pub/Sub, Google Cloud’s fully managed, real-time messaging service.
- Beam’s programming model, which unifies batch and streaming and lets a single job operate on either batch inputs (Cloud Storage), or streaming inputs (Pub/Sub).
- The ability to deploy Beam pipelines on Dataflow’s fully managed service.
The combination of Dataflow’s fully managed approach and Beam’s comprehensive feature set let Twitter simplify the structure of its data transformation pipeline, as well as increase overall data processing capacity and reliability.
Here’s what the architecture looks like after the second iteration:
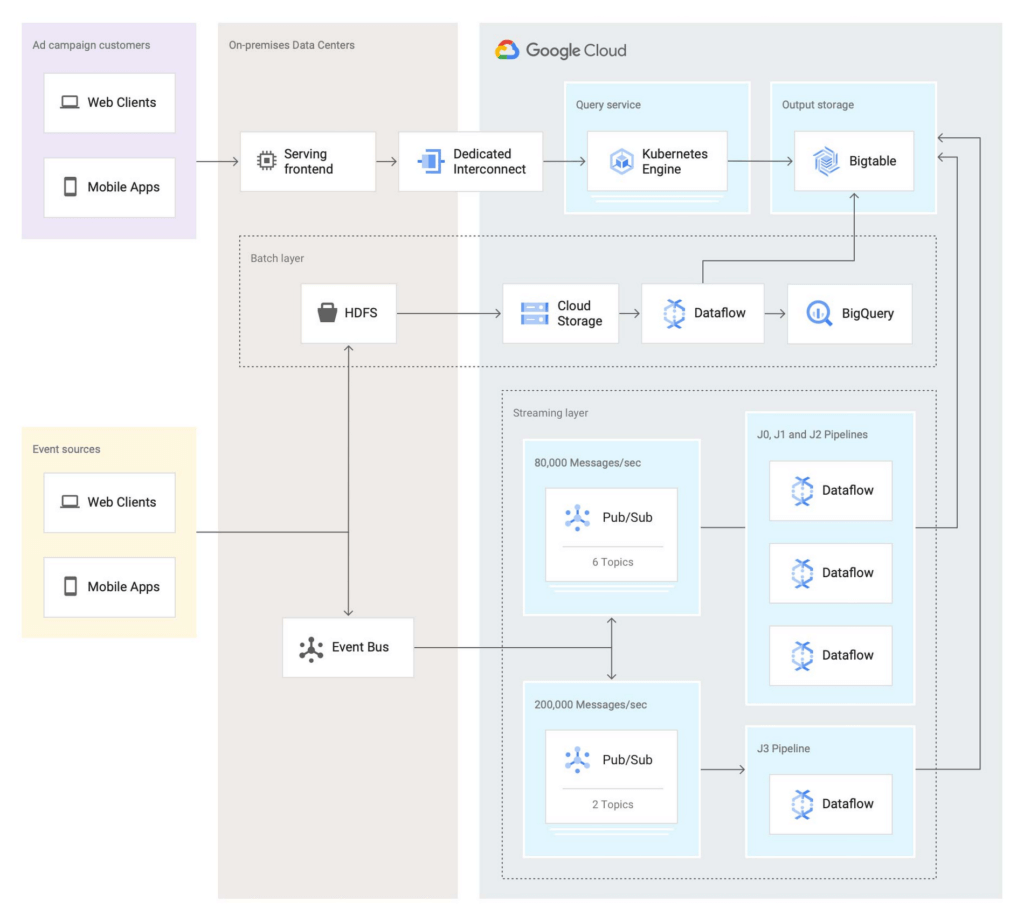
In this second iteration, the Twitter team re-implemented the batch layer as follows: Data is first staged from on-prem HDFS to Cloud Storage. A batch Dataflow job then regularly loads the data from Cloud Storage, processes the aggregations, and dual-writes the results to BigQuery for ad-hoc analysis and Bigtable for the serving system.
The Twitter team also deployed an entirely new streaming layer in Google Cloud. For data ingestion, an on-prem service now pushes two different streams of Avro-formatted messages to Pub/Sub. Each message contains a bundle of multiple raw events and affects between 100 and 1,000 aggregations. This leads to more than 3 million aggregations per second performed by four Dataflow jobs (J0-3 in the diagram above). All Dataflow jobs share the same topology, although each job consumes messages from different streams or topics.
One stream, which contains critical data, enters the system at a rate of 200,000 messages per second and is partitioned in two separate Pub/Sub topics. A Dataflow job (J3 in the diagram) consumes those two streams, performs 400,000 aggregations per second, and outputs the results to a table in Bigtable.
The other stream, which contains less critical but higher volume data, enters the system at a rate of around 80,000 messages per second and is partitioned into six separate topics. Three Dataflow jobs (J0, J1, and J2) share the processing of this larger stream, with each of them handling two of the available six topics in parallel, then also outputting the results to a table in Bigtable. In total, those three jobs process over 2 million aggregations/second.
Partitioning the high-volume stream into multiple topics offers a number of advantages:
- The partitioning is organized by applying a hash function on the aggregation key and then dividing the function’s result by the number of available partitions (in this case, six). This guarantees that any per-key grouping operation in downstream pipelines is scoped to a single partition, which is required for consistent aggregation results.
- When deploying updates to the Dataflow jobs, admins can drain and relaunch each job individually in sequence, allowing the remaining pipelines to continue uninterrupted and minimizing impact on the end users.
- The three jobs can each handle two topics without issue currently, and there is still room to scale horizontally up to six jobs if needed. The number of topics (six) is arbitrary, but is a good balance at the moment based on current needs and potential spikes in traffic.
To assist with job configuration, Twitter initially considered using Dataflow’s template system, a powerful feature that enables the encapsulation of Dataflow pipelines into repeatable templates that can be configured at runtime. However, since Twitter needed to deploy jobs with topologies that might change over time, the team decided instead to implement a custom declarative system where developers can specify different parameters for their jobs in a pystachio DSL: tuning parameters, data sources to operate on, sink tables for aggregation outputs, and the jobs’ source code location. A new major version of Dataflow templates, called Flex Templates, will remove some of the previous limitations with the template architecture and allow any Dataflow job to be templatized.
For job orchestration, the Twitter team built a custom command line tool that processes the configuration files to call the Dataflow API and submit jobs. The tool also allows developers to submit a job update by automatically performing a multi-step process, like this:
- Drain the old job:
- Call the Dataflow API to identify which data sources are used in the job (for example, a Pub/Sub topic reader).
- Initiate a drain request.
- Poll the Dataflow API for the watermark of the identified sources until the maximum watermark is hit, which indicates that the draining operation is complete.
- Launch the new job with the updated code.
This simple, flexible, and powerful system allows developers to focus on their data transformation code without having to be concerned about job orchestration or the underlying infrastructure details.
Looking ahead
Six months after fully transitioning its ad analytics data platform to Google Cloud, Twitter has already seen huge benefits. Twitter’s developers have gained in agility as they can more easily configure existing data pipelines and build new features much faster. The real-time data pipeline has also greatly improved its reliability and accuracy, thanks to Beam’s exactly-once semantics and the increased processing speed and ingestion capacity enabled by Pub/Sub, Dataflow, and Bigtable.
Twitter engineers have enjoyed working with Dataflow and Beam for several years now, since version 2.2, and plan to continue expanding their usage. Most importantly, they’ll soon merge the batch and streaming layers into a single, authoritative streaming layer.
Throughout this project, the Twitter team collaborated very closely with Google engineers to exchange feedback and discuss product enhancements. We look forward to continuing this joint technical effort on several ongoing large-scale cloud migration projects at Twitter. Stay tuned for more updates!

3693
Of your peers have already downloaded this article
16:30 Minutes
The most insightful time you'll spend today!
Organizations today are being forced to make difficult decisions. Innovation has moved down the list for many companies, replaced with realities like making sure your business systems stay up and running during a disaster, managing unexpected shifts in demand,and above all, staying in business.
In the short term, this means looking for cost savings wherever possible, and making sure you’re up and running, no matter what circumstances come your way. In the longer term, it means identifying areas to reduce capital expenditures—including things like data center commitments, migration costs, and other overhead.
Google Cloud database solutions can help with both the short- and longer-term issues. Our solutions provide the opportunity to reduce the load that managing legacy applications is placing on your IT department and ensure you can manage unforeseen demand, all while making sure your databases are up and running, no matter what circumstances come your way.
In this whitepaper we’ll look in detail at some Google Cloud database solutions that can help you re-host, re-platform, or re-write your enterprise database with Google Cloud. You’ll see how we can help you plan for both the short- and long-term health of your Oracle workloads.
How Data Teams in EdTech Firms Make Most of the Educational Data at All Levels

3541
Of your peers have already read this article.
1:30 Minutes
The most insightful time you'll spend today!
Education data can inform strategy, enhance both teaching and learning, and help us better understand customer needs. But that data is only as useful as an organization’s ability to access, analyze, and act upon it. Education Technology (EdTech) companies with a strong data warehouse management policy can help to make the most of educational data at all levels.
Creating a data team
When an EdTech doesn’t have a dedicated data team, databases will likely be poorly maintained and data can be hard to find, it can lack critical security, or fail to meet a customer’s specific requirements. A dedicated data team can prevent this and better support an organization’s data needs. There’s a correlation between the maturity of a data team and the success of an organization’s data utilization. When considering the three primary components of team, outlook, and results, we can better understand an organization’s maturity. By using this matrix from Looker’s Analytical Maturity Playbook, you can assess the maturity of your organization’s data team. Most would agree, the goal is for your operation to move from data chaos to data-driven. But, how can you do that? Think about your data this way: the intelligence you gain from your data is not only an asset…it’s a product. When your data team views your business intelligence as a product—one that’s just as important as the services you offer—they can set the stage for creating a successful data-driven company. Mature data organizations:
- Report functionality regularly
- Constantly assess potential improvements to existing systems
- Manage content rollout to internal employees
Redivis: Making data accessible, connected & secure
Redivis is a platform that connects academic researchers with data and the tools to understand education intelligence. Their customers, who are researchers, expressed how difficult it is to find new datasets for their studies. Once they found a dataset, they often had to access and work with it before they could tell if the information would be useful for their studies. Redivis Data administrators were also concerned about data security. Redivis built their platform on top of Google Cloud’s security infrastructure, making it a highly scalable data processing environment.
Redivis developed a transparent, tiered access system for datasets that allows researchers to request separate access to a dataset’s documentation to determine whether they can use the dataset. Detailed audit logs (supported by Google Cloud Logging) and robust application-level security controls tighten data access. To offer more insights for their researchers, they securely connected their private datasets with public datasets hosted in BigQuery allowing researchers to run queries on billions of records in seconds, not hours.
With a data team in place, it’s time to visualize where to store and organize your data. Data is an asset. You want to invest in collecting, operationalizing, and storing it properly. “Inadequate data aggregation, harmonization, and processing impedes teams from making the right data-driven decisions and pivoting when needed,” according to Jesus Trujillo Gomez, a strategic business executive at Google Cloud. You can determine how mature your warehouse is by using this matrix to help you identify where your organization falls on the spectrum (least mature on the left, most mature on the right). A company’s data warehouse can be assessed in four areas: Technology, Pipeline, Quality, and Performance. Here are some suggested steps to bring your EdTech company one step closer to a data powerhouse.
Classcraft: Using a data-driven approach to make learning fun
Launched in 2014, learning company Classcraft is reimagining the classroom, creating better learning environments with gamification. To support their mission, their team has created a complete data platform that uses data analytics to find new ways to engage students in the classroom. Classcraft became a Google for Education Build Partner to keep up with rising demand. They expanded their footprint to reach 6 million students and educators in 165 countries.
They also migrated to Google Cloud, building on several integrations with Google Workspace for Education, Google Classroom, and Chrome for Education, allowing them to support customers ranging from individual teachers to entire school districts. Classcraft migrated its database and analytics infrastructure to BigQuery and Cloud Storage. “We capture about 10 million new data points every month related to school culture and student performance,” says Chief Technology Officer and VP of Product Stéphane Guillemette. “With BigQuery and other Google Cloud tools, we can quickly deliver valuable insights to educators.”
More Relevant Stories for Your Company

Cloud Spanner Powers Vimeo to Deliver Consistent UX for across Content
Editor’s note: The video platform Vimeo leverages managed database services from Google Cloud to serve up billions of views around the world each day. Here’s how they deliver a consistent user experience across all their content. Vimeo is the world’s leading video software solution, powering hundreds of thousands of new uploads
Why–and How–You Should Migrate Oracle Workloads to Google Cloud
If you are like many of your peers you are looking to Google Cloud to reduce overheads, drive innovation, and agility with a wide variety of databases for your Oracle workloads. From Bare Metal Solution to cloud-native databases, Google Cloud offers the infrastructure to meet your needs. The Benefits Optimizing

Making Mothers’ Day Special: How Google Cloud Migration for 1-800-FLOWERS.COM, Inc Impacts CX
Editor’s note: In honor of Mother’s Day, we look at how 1-800-FLOWERS.COM, Inc. migrated to Google Cloud as part of its digital transformation to quickly deploy seamless and convenient customer experiences across multiple brands on Mother’s Day and every day. As a leading provider of gifts designed to help customers

Key Highlights on Data Analytics to Smooth Your Organization’s Data Journey
As the Olympics kicked off in Tokyo at the end of July, we found ourselves reflecting on the beauty of diverse countries and cultures coming together to celebrate greatness and sportsmanship. For this month’s blog, we’d like to highlight some key data and analytics performances that should help inspire you
