





Cloud Spanner Powers Vimeo to Deliver Consistent UX for across Content

3506
Of your peers have already read this article.
3:00 Minutes
The most insightful time you'll spend today!
Editor’s note: The video platform Vimeo leverages managed database services from Google Cloud to serve up billions of views around the world each day. Here’s how they deliver a consistent user experience across all their content.
Vimeo is the world’s leading video software solution, powering hundreds of thousands of new uploads every day and billions of views. At our scale, it’s paramount that we retain a seamless user experience across all of the videos hosted, shared, and viewed on our platform. With managed database services from Google Cloud, we’ve been able to deliver a consistent and reliable user experience no matter where our users and their audiences are.
https://youtube.com/watch?v=ggpAUgEL2iE%3Fenablejsapi%3D1%26
Outgrowing the data center and gaining more scale
Our first exposure to Google Cloud was the excellent performance between Google Compute Engine (GCE) and Google Cloud Storage (GCS), which we used to design a really high quality playback and upload environment for our customers’ videos. At first we were simply creating cloud-based packaging and delivery of their content, but the bulk of our application ran on an on-premises MySQL database. Seeing the gains from our initial investment in GCE and GCS, we decided to fully migrate to Google Cloud.
We started by lifting and shifting our workloads from our on-premises deployments to GCE. But we quickly realized we had to redesign our application to deliver higher availability and responsiveness for an exceptional user experience, which led us to Cloud Spanner, a distributed SQL database management and storage service. With Spanner, we found all the benefits of a relational semantics database with global scale, allowing us to add more nodes with the push of a button.
Today we have a multi-region instance with 99.999% uptime, so we’re confident it can handle our video workloads. We use about 16 Spanner nodes to cover approximately 50.8 billion rows and about 4.5 terabytes of storage/disk space. And with the launch of Video Library, we have the scale we need to fundamentally change the way organizations handle content.
Using Spanner as a time machine during migration
During the initial migration, we wanted to ensure an accurate data transfer with as few errors or bugs as possible. When we moved data from MySQL tables into Spanner, we ran spot analyses to check for potential problems. If the data didn’t match, Spanner allowed us to revert to the original in a single click. Through Spanner we could check stale timestamps or past users. It almost functioned like a time machine by offering point-in-time recovery functionality.
Serving up any video at any time
We work with a long tail of content. Depending on how popular a video is, we take a different approach to storing it. We cache the most popular material so it’s immediately accessible and use Cloud Spanner to ensure it’s highly available across multiple regions. On the flip side, we use Cloud SQL for some lower volume satellite services that support other components of the application that don’t require the same guarantees or performance that Cloud Spanner provides.
As our millions of users continue to upload their own videos, Spanner also acts as a video metadata indexing and cataloging service. When we need to play back a particular video, we can quickly and easily find it in a sea of content. It’s crucial that our database is highly available and reliable so the playback experience is seamless for our users.
To learn more about Vimeo, visit our site.
Learn more about how your organization can use Cloud Spanner.
Seven-Eleven Japan Leverages Google Cloud’s Performance and Speed for Real-time Business Insights

6817
Of your peers have already read this article.
4:00 Minutes
The most insightful time you'll spend today!
With the rise of technologies like smartphones, retailers have felt the pressure to meet evolving consumer needs and expectations. Seven-Eleven Japan(“SEJ”) has long been on the forefront of this thanks to the way they develop and invest in IT. However, in recent years, Japan’s leading convenience store chain has struggled to maintain its complex legacy systems at the rate needed to keep up with today’s rapid digitization, spurred on by the increasing proliferation of smartphones and an IT vendor-dependent structure.
Legacy systems limiting real-time responsiveness and innovation
Since its early days, SEJ has been proactive in adopting information technology, mainly relying on technology solutions from Japan’s leading vendors. But as the systems have grown, key business issues have been resolved using a vendor-dependent structure rather than being driven by SEJ’s own needs.
Datasets and business logic were combined and built into legacy environments, gradually leading to data silos. As a result, data was distributed across multiple systems, causing a variety of problems, including the inability to efficiently retrieve data when needed, delays in accessing data collected in individual stores, and difficulties taking measurements at the right time in business operations that require real-time responsiveness.
Connecting different systems also takes time and money, and the lead time for introducing new services—from planning to development and launch—has been longer than expected.
To solve these problems, SEJ’s IT department built “Seven Central”—a new platform for practical data use launched in 2020 to support the company’s future IT strategies and digital transformation initiatives.
At its core, Seven Central’s ultimate purpose is to allow real-time data views. Versatile, real-time datasets—such as point-of-sale (POS) data from 7-Eleven stores—are consolidated into a centralized location in the cloud. They created a simple data mart that provides data via an API to enable them to respond more quickly to requests from individual departments.
“In such uncertain times, it’s vital to use data to make quick decisions,” says Izuru Nishimura, Executive Officer and Head of ICT Department. “Each department across the entire company will be able to gain an immediate understanding of the situation based on the most up-to-date data and respond accordingly. This is why we built Seven Central.”
Google Cloud selected to help SEJ build and grow their data cloud
Today’s rapidly changing business environment has also highlighted the risk of IT support becoming a bottleneck. The long-term strategy is to gradually expand the datasets managed and collected in Seven Central according to business needs.
In the first phase, SEJ collected POS data from all 21,000+ stores to enable real-time analysis. Moving forward, they would like to collect other relevant data—for example, unstructured data, such as images and videos, or master datasets that are currently stored externally.
Google Cloud was already a top contender when SEJ started developing Seven Central in 2019. They compared various public cloud services besides Google Cloud, focusing on three main capabilities.
“We placed particular emphasis on service scalability to drive future digital transformation; security when handling data, which is the lifeline of our company; and finally, openness,” says Nishimura. He emphasizes that openness was perhaps the most important factor for choosing Google Cloud. Breaking away from the negative aspects of an entirely vendor-dependent system enabled them to build an agile development system with multiple vendors.
Google Cloud technologies including BigQuery and API management platform, Apigee, play a vital role in Seven Central. BigQuery’s high-speed processing at petabyte scale and fully managed infrastructure helped keep costs low during development and verification.
“Data is stored in a way that allows you to share it easily across organizations, which helps solve the issue of data silos from the perspective of scalability. I also like the fact there are some interesting features that could be used in the future—like BigQuery ML, which enables machine learning on BigQuery,” says Nishimura.
Apigee allows SEJ to separate datasets and business logic, which is one of the key points of Seven Central. While the trend these days is to standardize interfaces using an API, the reality tends to involve many different APIs rather than the introduction of one unified API. With Apigee, SEJ provides a single unified API for all of its data cloud, and they can now understand what data is used thanks to Apigee’s API usage visualizations.
“Right now, we collect data from all 21,000+ stores,” says Nishimura. “But in anticipation of a future expansion in business operations, we have designed a system that can scale up and run without issue, even if we were to have 30,000 stores, with 1,000 customers per store per day, purchasing five items per person.”
Real-time insights with BigQuery and Cloud Spanner
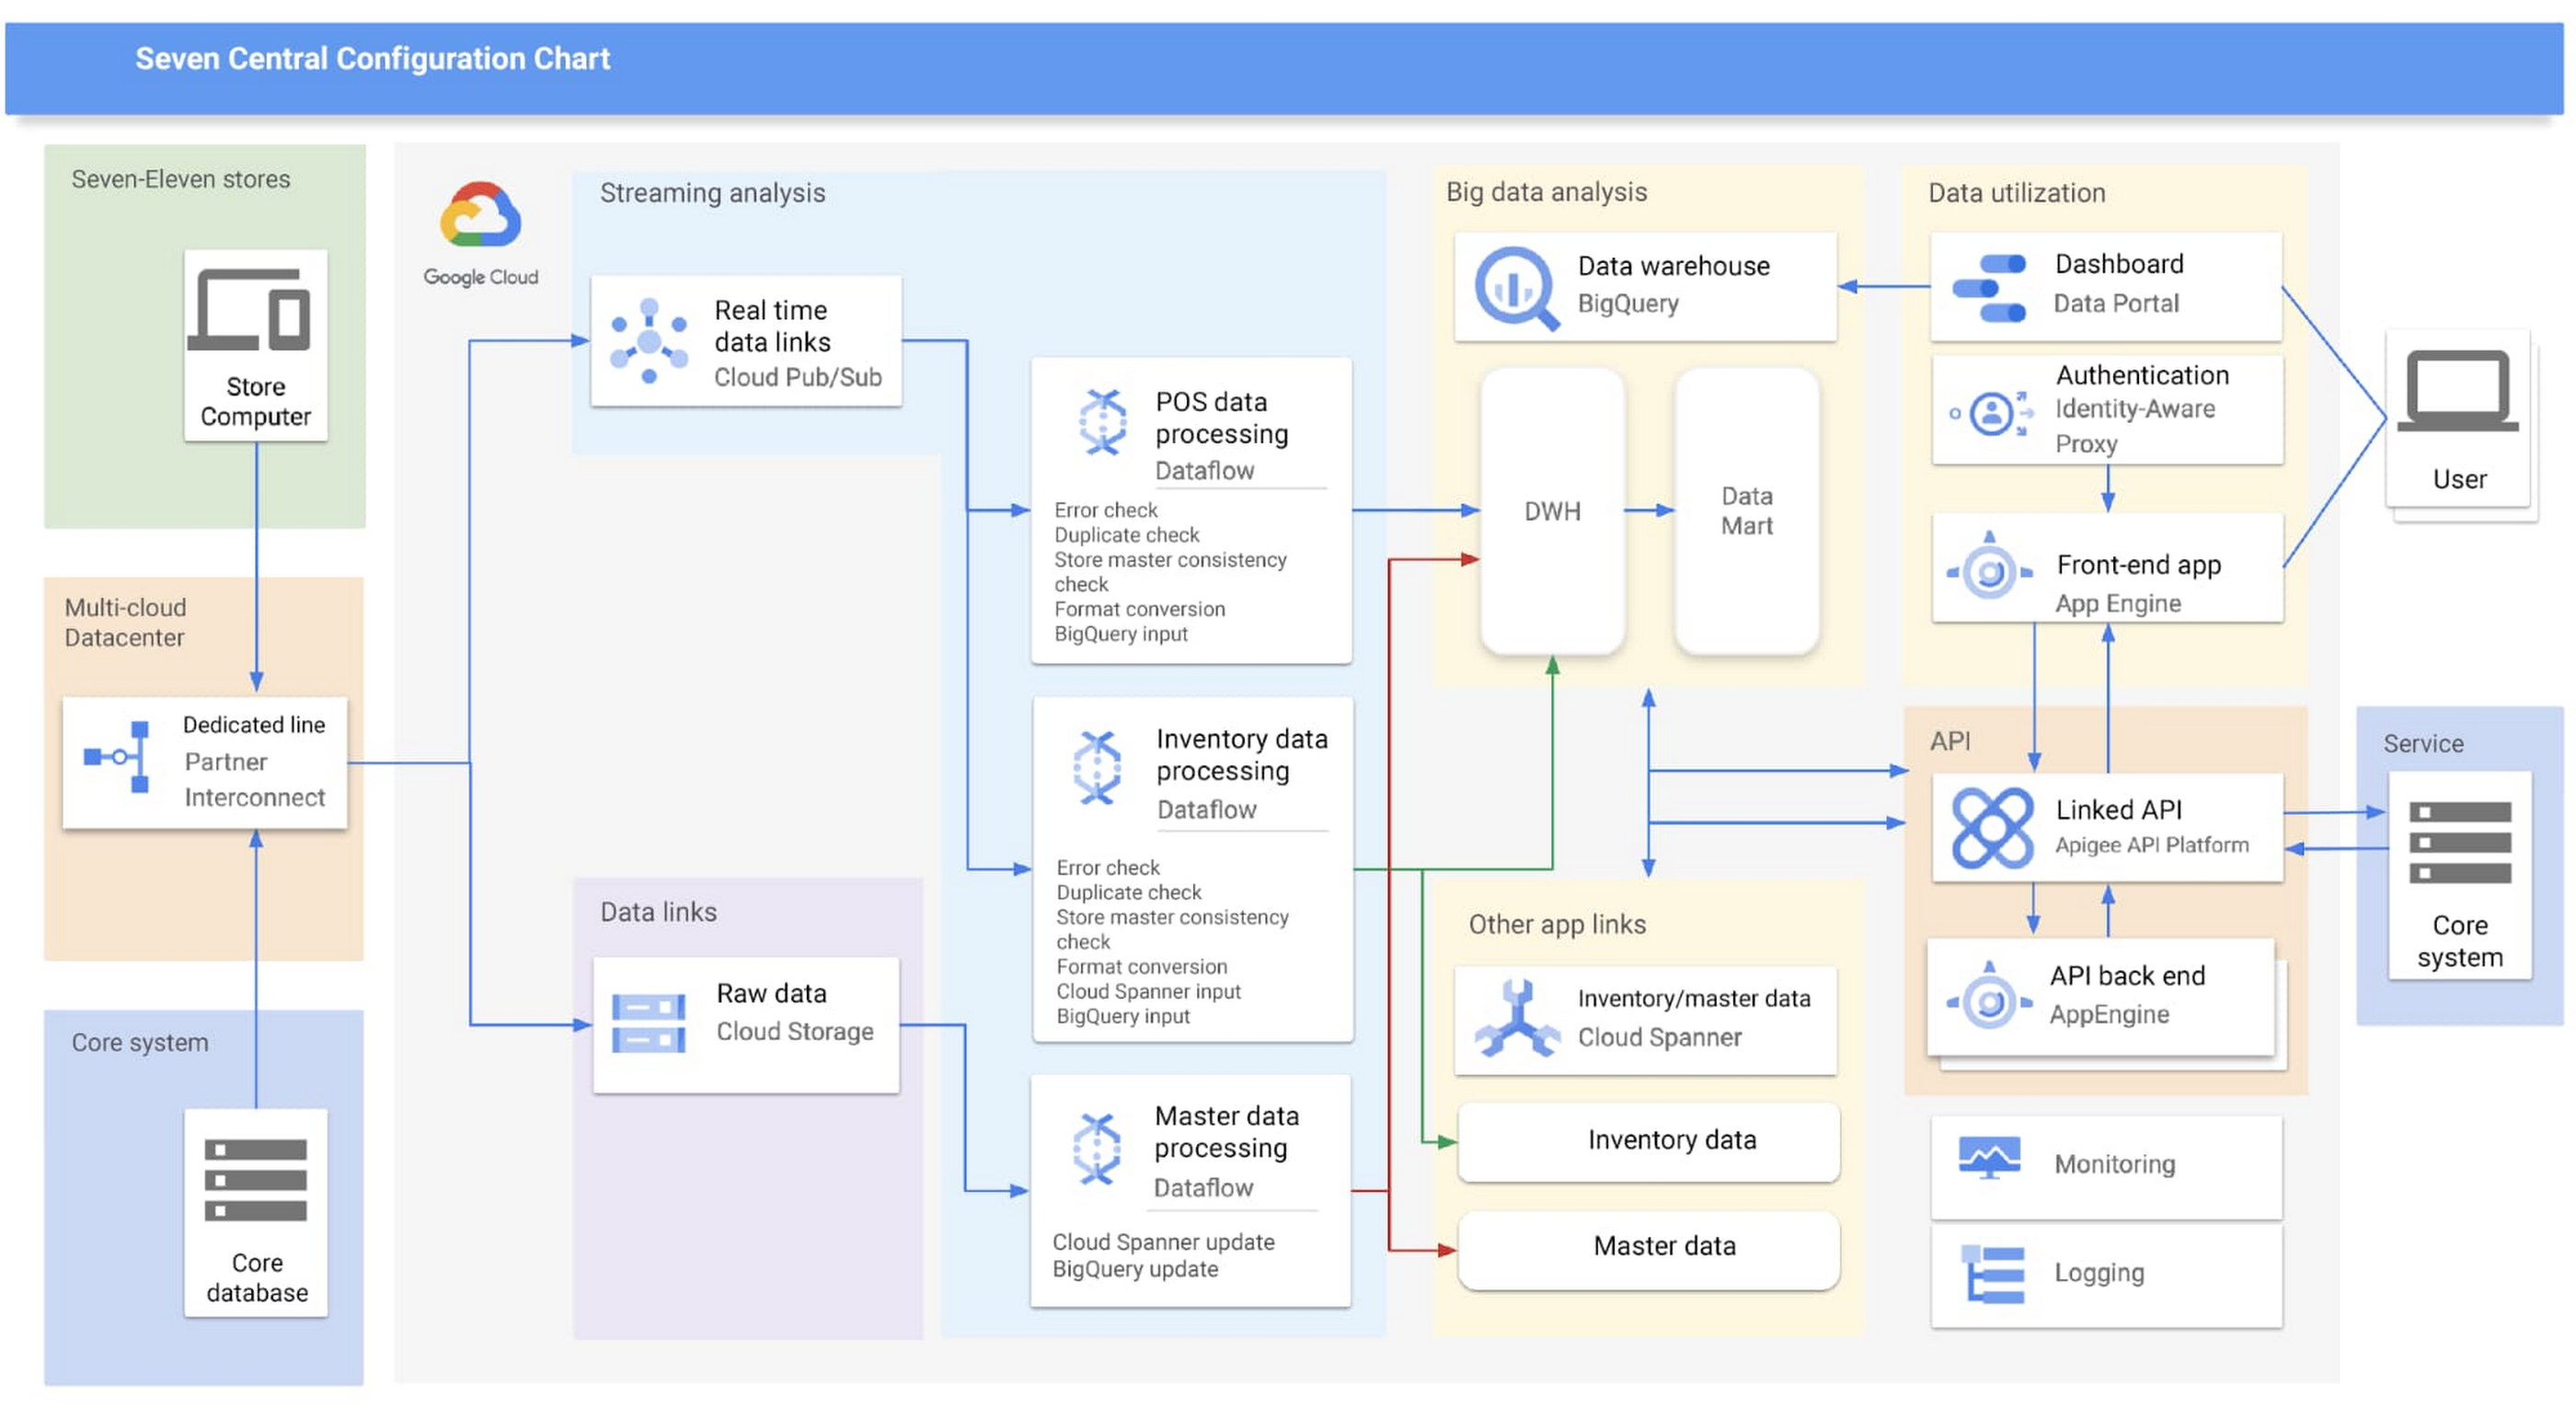
Google Cloud partner Cloud Ace came on board early in the planning phases. Based on their recommendations, SEJ decided to continue making full use of BigQuery to analyze data collected from all 21,000+ stores throughout Japan, while also using Cloud Spanner’s availability, near-unlimited scalability and transactional consistency to help achieve the real-time results needed for the project.
“Given that both the data and the regularity with which it is accessed are expected to steadily increase in the future, we chose Cloud Spanner as backend storage for data delivery via API. We consider it a good choice,” says Shota Kikuchi, General Manager, Consulting Department, Technology Division, Cloud Ace Co., Ltd.
Finally, they chose to use Google Cloud’s Stream Analytics Solutions messaging service for collecting POS data in real time, which can then be put to immediate use with Cloud Spanner and BigQuery.
High-speed responses exceed targets and create new value
Seven Central went live in September 2020 with surprising results.
They initially set a target time of one hour from when a customer makes a purchase to the point when Seven Central can use that data. But when the final system was first tried—it took barely a minute. Moving forward they estimate that the latest inventory data from the service side will become available within a few minutes of being added to the system.
“This is real innovation, and I must admit that I am quite surprised. As well as being able to solve existing issues, we also hope it will lead to new improvements and services that have been unimaginable up until now,” says Nishimura.
The team hopes to roll out the Seven Central platform in all companies affiliated with Seven & i Holdings—not just SEJ. They also plan to explore Google Cloud AI and machine learning technologies to take on challenges in new areas. For example, they are investigating the idea of clustering individual stores using BigQuery ML.
Seven Central has already attracted attention from many departments and received a lot of requests. Nishimura and his team say they hope to continue to grow Seven Central while still observing their fundamental principles—not including business logic, maintaining real-time results, and staying true to the uniqueness of SEJ.
Learn more about Google Cloud smart analytics solutions.
Daffodil Software Saves Hundreds of Hours Managing Databases with Google Cloud SQL

4711
Of your peers have already read this article.
4:30 Minutes
The most insightful time you'll spend today!
Daffodil Software is an India-based information technology services company with 180 employees and satellite offices in the US, Singapore, and the United Arab Emirates.
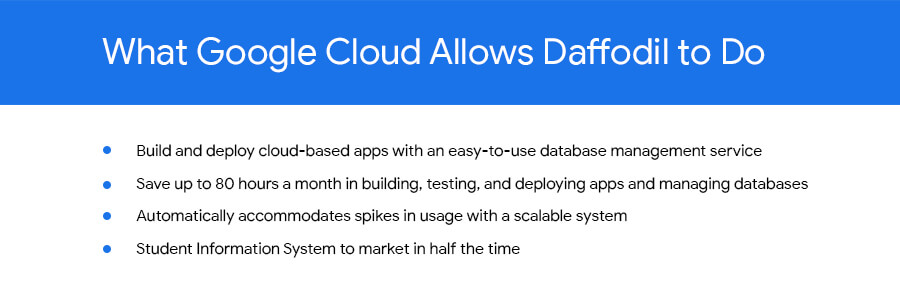
Its product: A suite of web-based applications, including a business customer relationship management (CRM) program and an enterprise resource planning (ERP) app for schools.
Daffodil’s Challenge
Daffodil needed a cloud-based hosting platform for its applications that would save money and time over in-house hosting. The company tried Amazon Elastic Cloud Compute (EC2) with MySQL to manage the databases that its applications depended on. The potential was there, but building, testing and deploying the applications took too long, and scalability was also an issue.
“The old system provided the option to scale up if many users accessed our applications at the same time, but we had to do this manually,” says Gaurav Sharma, assistant head of Daffodil’s product team.
Soon, Daffodil switched to Google App Engine, which allows businesses to build and host web apps on the same infrastructure that powers Google applications.
Integration with App Engine lets Sharma and his team quickly build, test and deploy applications and allows them to automatically accommodate fluctuations in the number of users so they don’t have to manually manage the system when demand increases.
Although App Engine’s built-in Datastore was useful, they found that they wanted more SQL-like functionality for their data-driven programs.
Google’s Solution
At Google’s suggestion, Daffodil migrated to Cloud SQL three months later to take advantage of the system’s database indexing and dynamic filtering abilities, which speed up data sorting for Daffodil’s end users.
“Using Google App Engine and Google Cloud SQL make our applications go live in half the time and have provided us with hassle-free control over all processes.”
—Yogesh Agarwal, CEO, Daffodil Software
Besides indexing and dynamic filtering, Cloud SQL has simplified database management for the Daffodil team. Sharma can easily import their databases and administer them through an intuitive interface, while Google handles backend maintenance and administration.
Google Cloud SQL replicates data among multiple geographic regions, giving Daffodil CEO Yogesh Agarwal peace of mind that users’ data held by the applications is protected.
“The safety of our customers’ data is a major concern, so we appreciate that we don’t need to worry about data loss,” he says.
The Results
With App Engine and Cloud SQL, the Daffodil team is saving about 80 hours of development time every month because of easier deployment, no active management for scaling, and simplified database management. They have also slashed the time it takes to bring new products to market.
“The shift to Google Cloud SQL has allowed us to focus on making our applications even better.”
—Yogesh Agarwal, CEO, Daffodil Software
“Using Google App Engine and Google Cloud SQL make our applications go live in half the time and have provided us with hassle-free control over all processes, such as development, deployment and monitoring,” Agarwal says. “We’re able to deploy our applications much faster and spend less time managing them.”
Going forward, the Daffodil team plans to add other Google services to their applications, including Prediction API, which allows CRM application users to better predict the probability of a lead becoming a customer, and App Engine’s Full Text Search API, which helps users retrieve customer data more easily.
Agarwal is happy with the move to App Engine and Cloud SQL. “The shift has allowed us to focus on making our applications even better,” he says.
Why and How to Migrate to Google BigQuery

5362
Of your peers have already read this article.
6:30 Minutes
The most insightful time you'll spend today!
Over the past few decades, organizations have mastered the science of data warehousing. They have increasingly applied descriptive analytics to large quantities of stored data, gaining insight into their core business operations. Conventional Business Intelligence (BI), which focuses on querying, reporting, and Online Analytical Processing, might have been a differentiating factor in the past, either making or breaking a company, but it’s no longer sufficient.
Today, not only do organizations need to understand past events using descriptive analytics, they need predictive analytics, which often uses machine learning (ML) to extract data patterns and make probabilistic claims about the future. The ultimate goal is to develop prescriptive analytics that combine lessons from the past with predictions about the future to automatically guide real-time actions.
Traditional data warehouse practices capture raw data from various sources, which are often Online Transactional Processing (OLTP) systems. Then, a subset of data is extracted in batches, transformed based on a defined schema, and loaded into the data warehouse. Because traditional data warehouses capture a subset of data in batches and store data based on rigid schemas, they are unsuitable for handling real-time analysis or responding to spontaneous queries. Google designed BigQuery in part in response to these inherent limitations.
Innovative ideas are often slowed by the size and complexity of the IT organization that implements and maintains these traditional data warehouses. It can take years and substantial investment to build a scalable, highly available, and secure data warehouse architecture. BigQuery offers sophisticated software as a service (SaaS) technology that can be used for serverless data warehouse operations. This lets you focus on advancing your core business while delegating infrastructure maintenance and platform development to Google Cloud.
BigQuery offers access to structured data storage, processing, and analytics that’s scalable, flexible, and cost effective. These characteristics are essential when your data volumes are growing exponentially—to make storage and processing resources available as needed, as well as to get value from that data. Furthermore, for organizations that are just starting with big data analytics and machine learning, and that want to avoid the potential complexities of on-premises big data systems, BigQuery offers a pay-as-you-go way to experiment with managed services.
With BigQuery, you can find answers to previously intractable problems, apply machine learning to discover emerging data patterns, and test new hypotheses. As a result, you have timely insight into how your business is performing, which enables you to modify processes for better results. In addition, the end user’s experience is often enriched with relevant insights gleaned from big data analysis, as we explain later in this series.
The migration framework
Undertaking a migration can be a complex and lengthy endeavor. Therefore, we recommend adhering to a framework to organize and structure the migration work in phases:
- Prepare and discover: Prepare for your migration with workload and use case discovery.
- Assess and plan: Assess and prioritize use cases, define measures of success, and plan your migration.
- Execute: Iterate the following steps for each use case:
- Migrate (offload): Migrate only your data, schema, and downstream business applications.
- Migrate (full): Alternatively, migrate the use case fully end-to-end. The same as Migrate (offload), with the addition of the upstream data pipelines.
- Verify and validate: Test and validate the migration to assess return on investment.
The following diagram illustrates the recommended framework and shows how the different phases are connected:

For a deeper understanding, read Migrating data warehouses to BigQuery: Introduction and overview
Google’s Anti-Pattern Recognition Tool: Streamlining BigQuery Performance

1225
Of your peers have already read this article.
2:30 Minutes
The most insightful time you'll spend today!
Why do we need a BigQuery anti-pattern recognition tool?
BigQuery is a serverless and cost-effective enterprise data warehouse that works across cloud environments and scales with your data. As with any large scale data-intensive platform, following best practices and avoiding inefficient anti-patterns goes a long way in terms of performance and cost savings.
Usually SQL optimization requires a significant time investment from engineers, who must read high-complexity queries, devise a variety of approaches to improve performance and efficiency, and test several optimization techniques. The best place to start is to fix anti-patterns, since this only requires easily applicable changes and provides significant performance improvements.
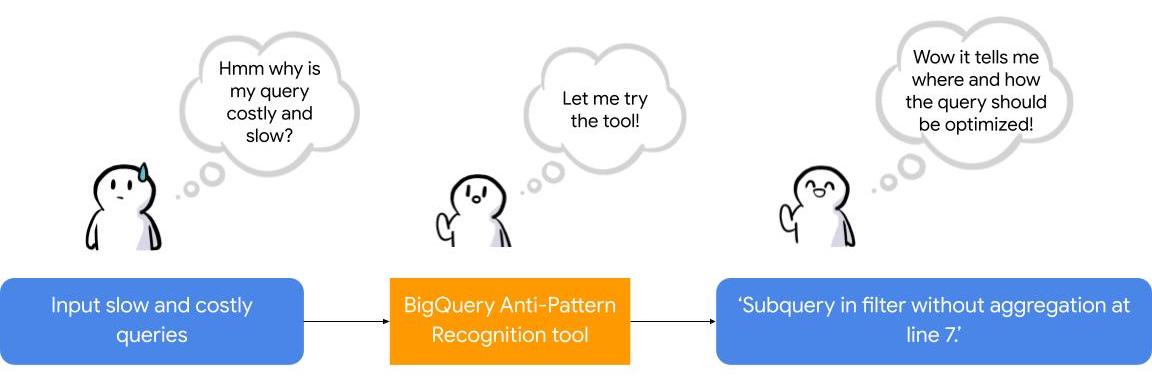
To facilitate the task of identifying and fixing said anti-pattern, Google Professional Services Organization (PSO) and Global Services Delivery (GSD) have developed a BigQuery anti-pattern recognition tool. This tool automates the process of scanning SQL queries, identifying antipatterns, and providing optimization recommendations.
What is the BigQuery anti-pattern recognition tool?
The BigQuery anti-pattern recognition tool let you easily identify performance impacting anti-patterns across a large number of SQL queries in a single go.
It utilizes ZetaSQL to parse BigQuery SQL queries into abstract syntax trees (AST) and then traverses the tree nodes to detect the presence of anti-patterns.
The tool takes a BigQuery SQL query as an input, such as:
SELECT
 t.dim1,
 t.metric1
FROM
 `dataset.table` t
WHERE
 t.id NOT IN (
 SELECT
   id
 FROM
   `dataset.table2`)
And produces the output as:
Subquery in filter without aggregation at line 8.
It examines potential optimizations, including:
- Selecting only the necessary columns
- Handling multiple WITH-clause references
- Addressing subqueries in filters with aggregations
- Optimizing ORDER BY queries with LIMIT
- Enhancing string comparisons
- Improving JOIN patterns
- Avoiding subquery aggregation in the WHERE clause
The solution supports reading from various sources, such as:
- Command line
- Local files
- Cloud Storage files
- Local folders
- Cloud Storage folders
- CSV (with one query per line)
- INFORMATION_SCHEMA
Additionally, the solution provides flexibility in writing output to different destinations, including:
- Printing to the terminal
- Exporting as CSV
Writing to a BigQuery table
Using the BigQuery anti-pattern recognition tool
The BigQuery anti-pattern recognition tool is hosted on GitHub. Below are the Quick Start steps on using the tool via command line for inline queries. You can also leverage Cloud Run to deploy it as a container on cloud.
Prerequisites
- Linux OS
- JDK 11 or above is installed
- Maven
- Docker
- gcloud CLI
Quick start: – steps
1. Clone the repo into your local machine.
git clone git@github.com:GoogleCloudPlatform/bigquery-antipattern-recognition.git
2. Build the tool image inside the `bigquery-antipattern-recognition` folder.
mvn clean package jib:dockerBuild -DskipTests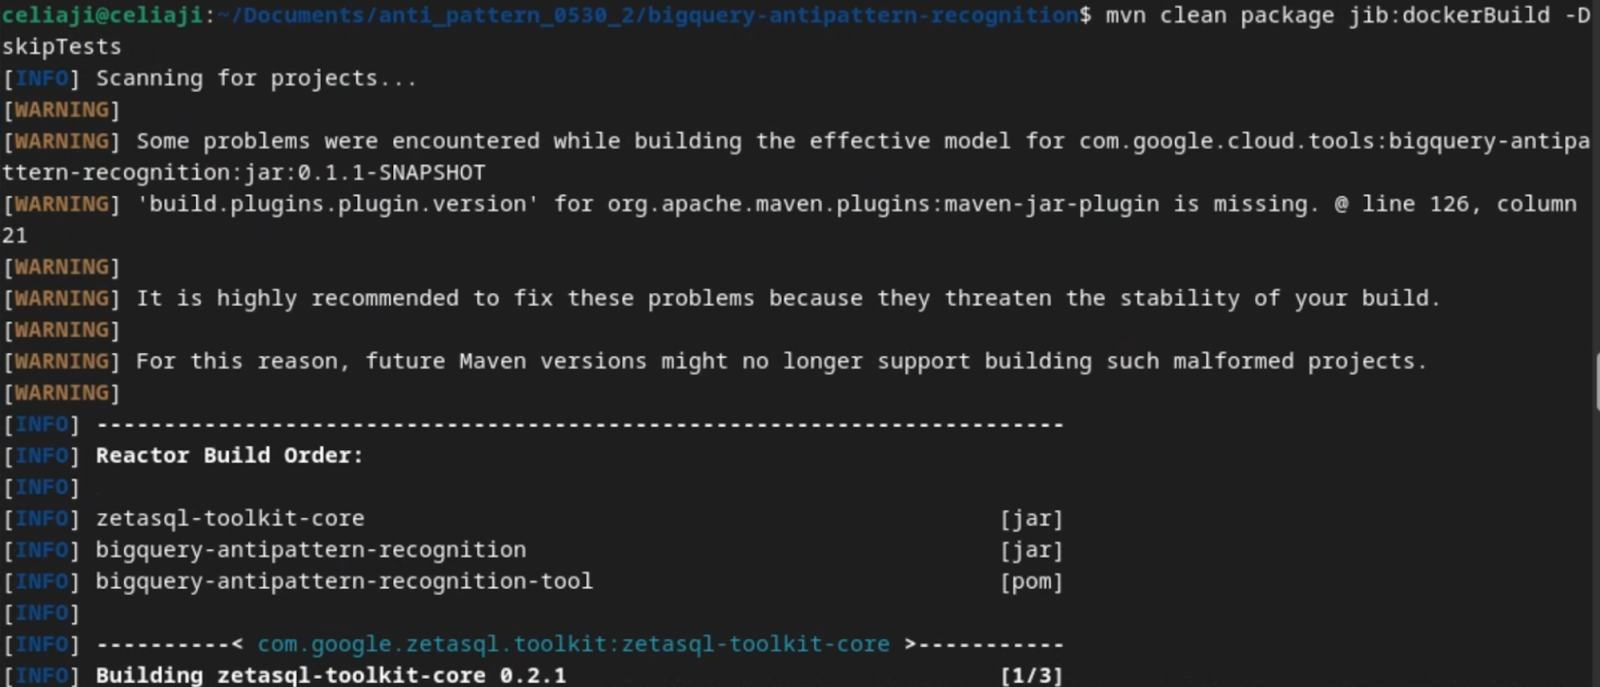
3. Run the tool for a simple inline query.
docker run \
  -i bigquery-antipattern-recognition \
  --query "SELECT * FROM \`project.dataset.table1\`"
4. Below is the output result in the command-line interface:
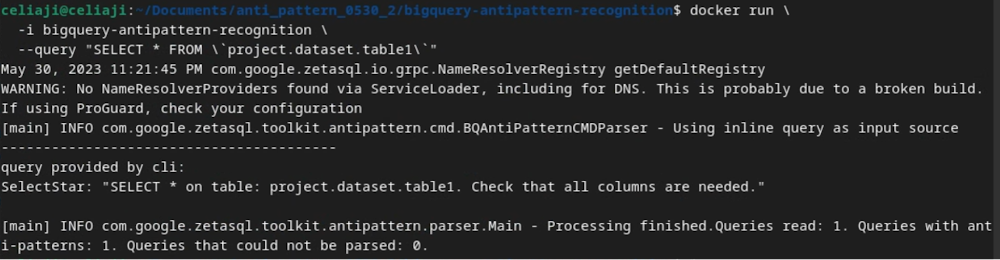
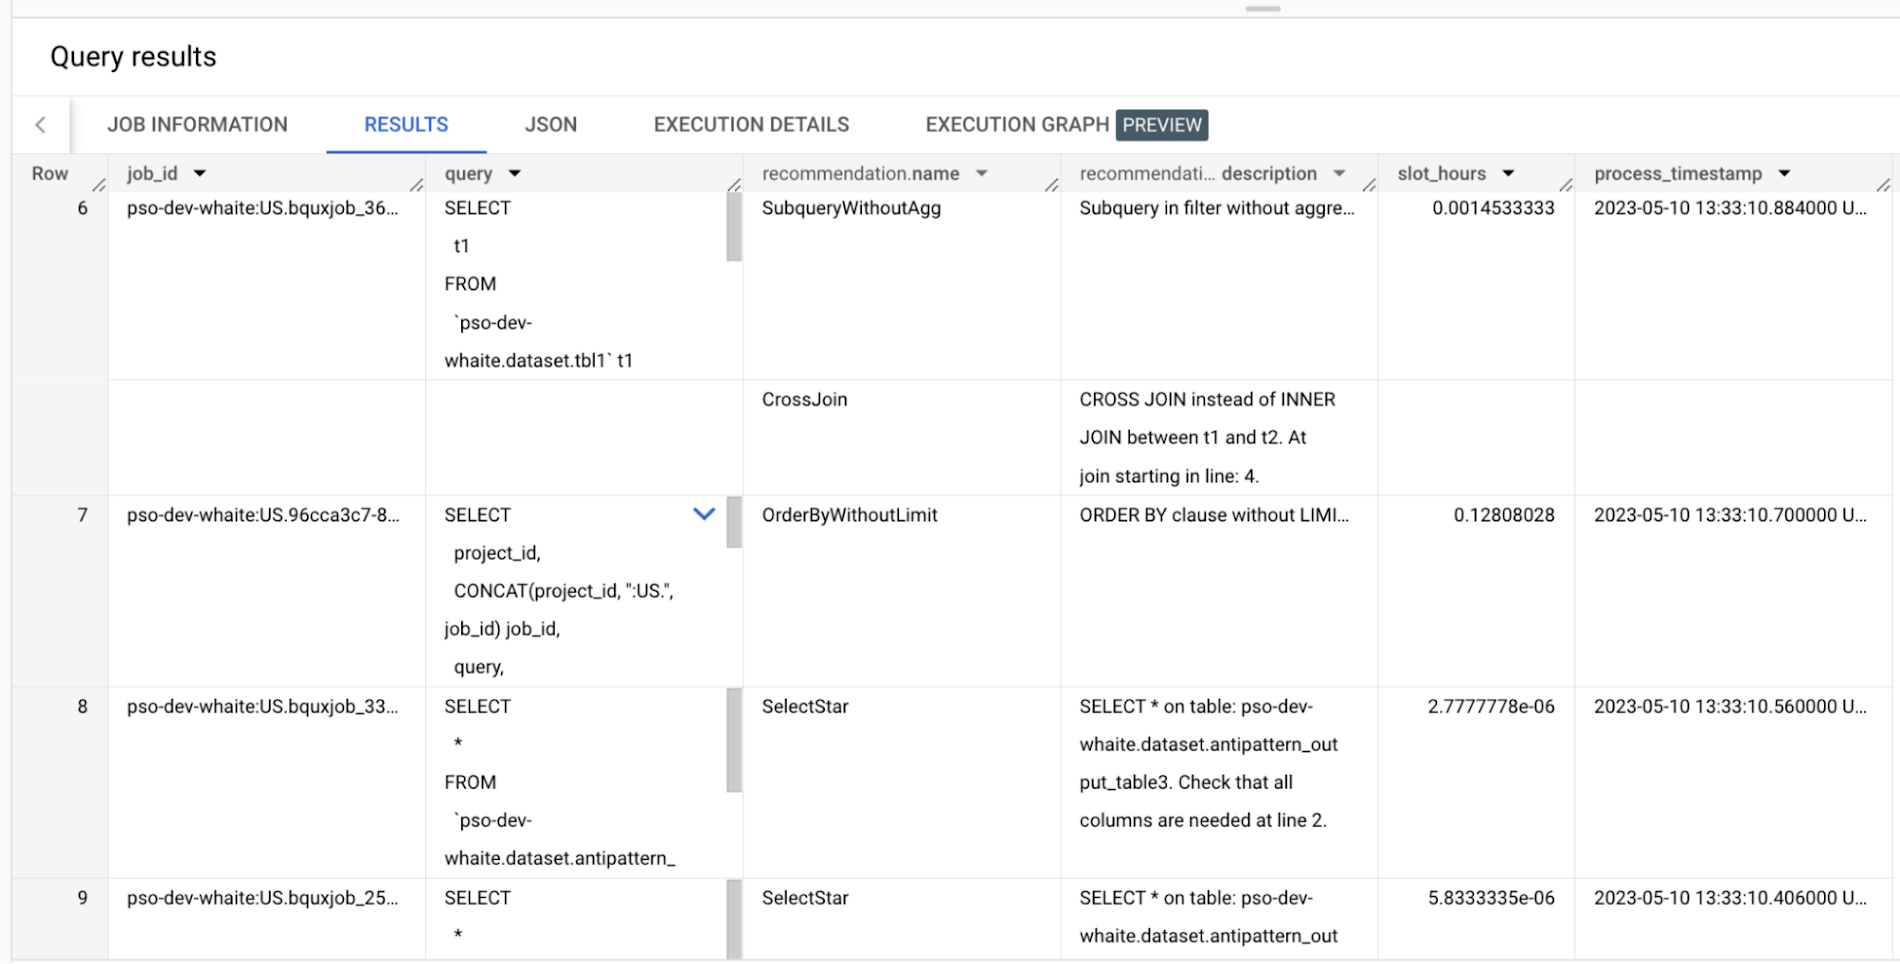
Additionally, the above tool can read queries from Information Schema and load the output recommendations to a BigQuery table.
Below is an example of the BigQuery anti-pattern recognition tool results exported to a BigQuery table.
Getting started
Ready to start optimizing your BigQuery queries and cutting costs? Check out the tool here and contribute to the tool via GitHub.
Have questions or feedback?
We’re actively working on new features to make the tool as useful to our customers. Use it and tell us what you think! For product feedback/technical questions, reach out to us at bq-antipattern-eng@google.com. If you’re already a BigQuery customer and would like a briefing on the tool, please reach out, we’d be happy to talk.
Make Meaningful Analysis with Geo Boundary Public Datasets on BigQuery

6326
Of your peers have already read this article.
4:00 Minutes
The most insightful time you'll spend today!
Geospatial data is a critical component for a comprehensive analytics strategy. Whether you are trying to visualize data using geospatial parameters or do deeper analysis or modeling on customer distribution or proximity, most organizations have some type of geospatial data they would like to use – whether it be customer zipcodes, store locations, or shipping addresses. However, converting geographic data into the correct format for analysis and aggregation at different levels can be difficult. In this post, we’ll walk through some examples of how you can leverage the Google Cloud platform alongside Google Cloud Public Datasets to perform robust analytics on geographic data. The full queries can be accessed from this notebook here.
Public US Geo Boundaries dataset
BigQuery hosts a slew of public datasets for you to access and integrate into your analytics. Google pays for the storage of these datasets and provides public access to the data via the bigquery-public-data project. You only pay for queries against the data. Plus, the first 1 TB per month is free! These public datasets are valuable on their own, but when joined against your own data they can unlock new analytics use cases and save the team a lot of time.
Within the Google Cloud Public Datasets Program there are several geographic datasets. Here, we’ll work with the geo_us_boundaries dataset, which contains a set of tables that have the boundaries of different geospatial areas as polygons and coordinates based on the center point (GEOGRAPHY column type in BigQuery), published by the US Census Bureau.

Mapping geospatial points to hierarchical areas
Many times you will find yourself in situations where you have a string representing an address. However, most tools require lat/long coordinates to actually plot points. Using the Google Maps Geocoding API we can convert an address into a lat/long and then store the results in the BigQuery table.
With a lat/long representation of our point, we can join our initial dataset back onto any of the tables here using the ST_WITHIN function. This allows us to check and see if a point is within the specified polygon.
ST_WITHIN(geography_1, geography_2)
This can be helpful for ensuring standard nomenclature; for example, metropolitan areas that might be named differently. The query below maps each customers’ address to a given metropolitan area name.
SELECTcust.id as customer_id,metro.name as metro_nameFROM `looker-private-demo.retail.customers` as cust,`bigquery-public-data.geo_us_boundaries.metropolitan_divisions` as metroWHERE ST_WITHIN(ST_GEOGPOINT(cust.longitude, cust.latitude),metro.metdiv_geom)
It can also be useful for converting to designated market area (DMA), which is often used in creating targeted digital marketing campaigns.
SELECTcust.id as customer_id,dma.dma_nameFROM `looker-private-demo.retail.customers` as cust,`bigquery-public-data.geo_us_boundaries.designated_market_area` as dmaWHERE ST_WITHIN(ST_GEOGPOINT(cust.longitude, cust.latitude),dma.dma_geom)
Or for filling in missing information; for example, some addresses may be missing zip code which results in incorrect calculations when aggregating up to the zipcode level. By joining onto the zip_codes table we can ensure all coordinates are mapped appropriately and aggregate up from there.
SELECTzip.zip_code,count(distinct cust.id) as unique_customersFROM `looker-private-demo.retail.customers` as cust,`bigquery-public-data.geo_us_boundaries.zip_codes` as zipWHERE ST_WITHIN(ST_GEOGPOINT(cust.longitude, cust.latitude),zip.zip_code_geom)GROUP BY 1
Note that the zip code table isn’t a comprehensive list of all US zip codes, they are zip code tabulation areas (ZCTAs). Details about the differences can be found here. Additionally, the zip code table gives us hierarchical information, which allows us to perform more meaningful analytics. One example is leveraging hierarchical drilling in Looker. I can aggregate my total sales up to the country level, and then drill down to state, city and zipcode to identify where sales are highest. You can also use the BigQuery GeoViz tool to visualize geospatial data!

Aside from simply checking if a point is within an area, we can also use ST_DISTANCE to do something like find the closest city using the centerpoint for the metropolitan area table.
SELECTcust.id as customer_id,ARRAY_AGG(metro.name order by ST_DISTANCE(ST_GEOGPOINT(cust.longitude, cust.latitude),metro.internal_point_geom) asc limit 1)[offset(0)] as metro_nameFROM`looker-private-demo.retail.customers` as cust,`bigquery-public-data.geo_us_boundaries.metropolitan_divisions` as metroGROUP BY cust.id
This concept doesn’t just hold true for points, we can also leverage other GIS functions to see if a geospatial area is contained within areas that are listed in the boundaries datasets. If your data comes into BigQuery as a GeoJSON string, we can convert it to a GEOGRAPHY type using the ST_GEOGFROMGEOJSON function. Once our data is in a GEOGRAPHY type we can do things like check to see what urban area the geo is within – using either ST_WITHIN or ST_INTERSECTS to account for partial coverage. Here, I am using the customer’s zip code to find all metropolitan divisions where the zip code polygon and the metropolitan polygon intersect. I am then selecting the metropolitan area that has the most overlap (or the intersection has the largest area) to be the customer’s metro that we use for reporting.
SELECTcust.id as customer_id,ARRAY_AGG(metro.name order by ST_AREA(ST_INTERSECTION(zip.zip_code_geom,metro.metdiv_geom)) desc limit 1)[offset(0)] as metro_nameFROM`looker-private-demo.retail.customers` as custJOIN `bigquery-public-data.geo_us_boundaries.zip_codes` as zip on cust.zip=zip.zip_code,`bigquery-public-data.geo_us_boundaries.metropolitan_divisions` as metroWHERE ST_INTERSECTS(zip.zip_code_geom,metro.metdiv_geom)GROUP BY cust.id
The same ideas can be applied to the other tables in the dataset including the county, urban areas and National Weather Service forecast regions (which can also be useful if you want to join your datasets onto weather data).
Correcting for data discrepancy
One problem that we may run into when working with geospatial data is that different data sources may have different representations of the same information. For example, you might have one system that records state as a two letter abbreviation and another using the full name. Here, we can use the state table to join the different datasets.
SELECTst.state_name,sum(ab.sales+fn.sales) as total_salesFROM `bigquery-public-data.geo_us_boundaries.states` as stLEFT JOIN abbreviated_table as ab on ab.state = st.stateLEFT JOIN fullname_table as fn on fn.state = st.state_nameWHERE COALESCE(ab.state, fn.state) IS NOT NULLGROUP BY 1
Another example might be using the tables as a source of truth for fuzzy matching. If the address is a manually entered field somewhere in your application, there is a good chance that things will be misspelled. Different representations of the same name may prevent tables from joining with each other or lead to duplicate entries when performing aggregations. Here, I use a simple Soundex algorithm to generate a code for each county name, using helper functions from this blog post. We can see that even though some are misspelled they have the same Soundex code.

Next, we can join back onto our counties table so we make sure to use the correct spelling of the county name. Then, we can simply aggregate our data for more accurate reporting.
SELECTc.county_name,sum(sales) as total_salesFROMtableJOIN `bigquery-public-data.geo_us_boundaries.counties` as con testing.dq_fm_Soundex(table.county) = testing.dq_fm_Soundex(c.county_name)WHERE c.state_fips_code = cast(36 as string)GROUP BY 1
Note that fuzzy matching definitely isn’t perfect and you might need to try different methods or apply certain filters for it to work best depending on the specifics of your data.
The US Geo Boundary datasets allow you to perform meaningful geographic analysis without needing to worry about extracting, transforming or loading additional datasets into BigQuery. These datasets, along with all the other Google Cloud Public Datasets, will be available in the Analytics Hub. Please sign up for the Analytics Hub preview, which is scheduled to be available in the third quarter of 2021, by going to g.co/cloud/analytics-hub.
More Relevant Stories for Your Company

Fairygoodboss and Google Cloud Tied to Advancing Diversity and Female Leadership at Workplaces
May is Asian American Pacific Islander Heritage Month — a time for us to come together to celebrate and remember the important people and history of Asian and Pacific Island heritage. This feature highlights founder Georgene Huang and how her startup Fairygodboss uses easy to use Google Cloud tools to

Principles to Make Organizations Data Engineering Driven
In the “What type of data processing organisation” paper, we examined that you can build a data culture whether your organization consists mostly of data analysts, or data engineers, or data scientists. However, the path and technologies to become a data-driven innovator are different and success comes from implementing the right

Start-up Paves Way for More Inclusive Clinical Research: Honoring Black Founders of Acclinate with Google Cloud
Editor’s note: February is Black History Month—a time for us to come together to celebrate the diverse set of experiences, perspectives and identities that make up the Black experience. Over the next few weeks, we will highlight Black-led startups and how they use Google Cloud to grow their businesses. Today’s

Vodafone Leverages Google Cloud to Aid COVID-19 Frontline with Anonymized Insights on Population Mobility
Editor’s note: When Europe’s largest mobile communications company, Vodafone, was asked by the European Commission to help understand population movement across the European Union and the UK to help fight COVID-19, it was able to provide anonymized mobile network-based insights to answer the call. Here’s how Vodafone, with the support
