





Why–and How–You Should Migrate Oracle Workloads to Google Cloud
3948
Of your peers have already read this article.
1:20 Minutes
The most insightful time you'll spend today!
If you are like many of your peers you are looking to Google Cloud to reduce overheads, drive innovation, and agility with a wide variety of databases for your Oracle workloads. From Bare Metal Solution to cloud-native databases, Google Cloud offers the infrastructure to meet your needs.
The Benefits
Optimizing your Oracle workloads with Google Cloud solutions has a number of benefits.
Dramatically reduce TCO: Reduce up-front hardware, software, and maintenance costs. Migrating Oracle workloads to Google Cloud could result in up to 78% in TCO savings.
High scale and high availability: Mission-critical applications need dependable databases that scale with your business. Google Cloud offers SLA-backed databases to protect your apps.
Simplify operation: Reduce data center and database management by leveraging managed infrastructure and fully managed database services.
Migration Strategies
Google Cloud provides multiple strategies for your specific migration journey to help you with licensing, maintenance cost, and manageability.
Rehost: To migrate Oracle workloads with specific configurations, Google Cloud offers Bare Metal Solution, where you can simply lift and shift your workloads. Bare Metal Solution provides hardware, hardware support, and integrated billing and support. This infrastructure is connected with a highly resilient interconnect and connects to all native Google Cloud services with less than 2ms latency.
Replatform: Keep your core application code and migrate to compatible platforms to help reduce licensing fees and maintenance costs. You can migrate to an open source database such as Cloud SQL for PostgreSQL that has a certain amount of compatibility with PL/SQL and stored procedure. You can also offload data analytics-centric workloads to SQL-compatible data warehousing solutions like BigQuery.
Rewrite: Rewrite your application to take full advantage of cloud-native databases. If your application requires a relational database with global scalability, you can migrate to Cloud Spanner, which provides scalability with industry-leading high availability of 99.999% SLA.
Google Cloud Helps Northwell Health to Boost Caregiver Productivity and Access to Right Care Using AI

7939
Of your peers have already read this article.
2:00 Minutes
The most insightful time you'll spend today!
Lung cancer is the leading cause of cancer death in the United States and like any cancer, early detection is crucial to survival. Screening at-risk populations is an important part of reducing mortality, and if concerning nodules are found on imaging, further testing may be required. Today, we’ll share how Northwell Health uses Google Cloud products such as Cloud Healthcare APIs and BigQuery to increase caregiver productivity and deliver better care for patients with findings that indicate potential development of lung cancer.
Northwell is New York’s largest healthcare provider
Northwell Health is New York’s largest healthcare provider with 23 hospitals and nearly 800 outpatient facilities. Northwell’s nearly 4,000 doctors care for millions of patients each year, and at this scale, there is an immense amount of healthcare data to manage. To better manage and leverage this data, Northwell Health partnered with Google Cloud starting in 2018.
Enabling caregivers to spend more time with patients
Nic Lorenzen, the lead developer of Northwell Emerging Technology and Innovation team, has a mission to put together data for caregivers in a way that makes sense. It is no secret that inefficient electronic health records systems have a negative impact on a physician’s ability to deliver quality care. Traditional EHRs have information distributed across many tabs, which forces caregivers to spend considerable time at the computer trying to find information. Moreover, speed of care matters. If care is delayed, patients may have to spend more time in the hospital and may suffer worse health outcomes.
To solve this problem, Nic’s team focused on giving caregivers the most relevant pieces of data at the right time by developing an intelligent clinician rounding app. The data needed to derive these insights can depend on the caregiver’s role–a nurse cares about different things than a cardiologist. This system aggregates multiple data sources, and provides patient-specific insights to caregivers.
This system would not have been possible before with traditional EHRs and data warehouses that have proprietary data models and rarely sync data in real time. Now with data easily accessible through Google Cloud’s Healthcare solutions, Nic’s team can deliver the right clinical information to the right people instantly. These days, Nic says, “instead of spending 75% of our time dealing with architecting the underlying platforms, we spend 75% of our time focused on higher value use cases for clinicians and patients. Google Cloud’s Healthcare solutions have greatly improved our developer productivity and time to value.”
Caregivers have found this new system to be a game changer.Before the implementation of this system, caregivers would spend, on average, seven to nine minutes finding the data needed to make medical decisions for one patient. Now, that aggregated information is delivered to a caregiver’s mobile device in less than a second.
Ensuring patients get the right care with the power of AI
There are a number of reasons why patients might not get the care that they need. For example, patients today can go to multiple hospitals and clinics settings, and coordinating care across multiple facilities is complex. Regional hospitals and clinics have their own siloed view of their data, so pertinent information gathered by one clinic might not be seen by another. These gaps in clinical data lead to gaps in patient care.
When a patient gets radiologic imaging, they may have findings unrelated to the reason they initially got the imaging. For example, a chest CT for a car accident might reveal an incidental lung nodule that could be cancerous. Unfortunately, research shows that a large portion of patients do not get follow up for these incidental findings because it isn’t the primary reason why the patient is seeing a doctor. Moreover, social determinants of health are a factor that affects which patients receive follow-up care. Identifying these patients and providing the necessary follow up care prevents adverse events related to delayed detection of cancer.

With Cloud Healthcare solutions, Northwell built an AI model to identify these patients so that oncologists can appropriately follow up with patients who have findings suspicious for lung cancer. The AI model detects incidental pulmonary nodules in radiology reports so that doctors can then contact the patients that need follow-up care. Nic says his team was able to build this system in a week: “Google Cloud did a lot of heavy-lifting for us and allowed us to get to the AI applications much faster. It allowed us to build a platform that just works.”
Healthcare systems can now rapidly generate healthcare insights with one end-to-end solution, Google Cloud Healthcare Data Engine. It builds on and extends the core capabilities of the Google Cloud Healthcare API to make healthcare data more immediately useful by enabling an interoperable, longitudinal record of patient data. Northwell Health uses Google Cloud as the core of their platform, enabling their developers to create solutions to the most pressing healthcare problems.
Special thanks to Kalyan Pamarthy, Product Management Lead on Cloud Healthcare and Natural Language APIs for contributing to this blog post.
Guide for Measuring Cloud Spanner Performance for Your Custom Workload

4819
Of your peers have already read this article.
3:00 Minutes
The most insightful time you'll spend today!
Database migration to a new database platform or technology can be daunting for various reasons. One of the common concerns is database performance. It is hard to evaluate database performance early in the evaluation cycle without performing actual data migration and application changes. This becomes even more important in the case of Cloud Spanner where modernization is required at both the database and application layers.
The traditional approach to evaluate database performance is to deploy the application and database together, migrate historical data to the new database and then simulate load tests by running an application on the new database. Doing all this for an early performance evaluation of Cloud Spanner may feel like a lot of effort.
In this post, we will explore a middle ground to performance testing using JMeter. Performance test Cloud Spanner for a custom workload before making application code changes and executing data migration. More detailed step-by-step guide is published here.
Goals
- Estimate the number of Cloud Spanner nodes needed (and get a cost estimate).
- Performance test the most frequently used set of queries and transactions.
- Demonstrate the ability to scale horizontally.
- Better understand the optimizations needed for schema and sql queries.
- Determine latency of DML operations.
Limitations
- You cannot test using non-java client libraries.
- It is more complex to test non-jdbc compliant features like mutations, parallel reads etc.
Preparing for performance tests
- Identify top SQL queries, latency, frequency / hour and avg number of rows returned or updated for each. This information will also serve as a baseline for the current system.
- Determine Cloud Spanner region / multi-region deployment. Ideally, load should be generated from the Cloud Spanner instance’s leader region for minimum latency and best performance. Read Demystifying Cloud Spanner multi-region configurations for more details on various configurations of Cloud Spanner.
- Estimate the number of Cloud Spanner nodes required for a given workload based on (step 1). It is recommended to have a minimum of 2 nodes for linear scaling.
Note: Peak performance numbers of regional performance and multi regional performance are published. It is based on a 1KB single row transaction with no secondary indexes. - Request quota for Cloud Spanner nodes on a given region / multi-region. It can take up to 1 business day.
Setting up Cloud Spanner
Creating the schema for Cloud Spanner
You can use the following tools to generate a schema for Cloud Spanner if you are migrating from the following source databases. Alternatively, you can model the schema manually. Schema design has a huge performance impact, hence it is recommended to review the schema very carefully.
| Source | Target | Tool(s) | |
| 1. | MySQL / MariaDB | Cloud Spanner | HarbourBridgeStriim |
| 2. | Postgresql | Cloud Spanner | HarbourBridgeStriim |
| 3. | Oracle | Cloud Spanner | Striim |
| 4. | SQL Server | Cloud Spanner | Striim |
Note: Manual review and tuning of schema will be needed to optimize and mitigate potential hotspots. You will need to keep in mind schema design best practices when modeling your schema.
Populating seed data into Cloud Spanner
Performance of a database depends on the amount of data present. Existing data (and indexes) determines how much data is scanned on select queries and therefore performance. Hence, it is important to seed data into Cloud Spanner before performance testing.
For most realistic results, data should be migrated from an existing production source. Sometimes you cannot do that due to schema changes. One way is to utilize a custom ETL job to export and transform data and then import into Cloud Spanner. Another alternative could be to mock seed data using JMeter(More details in later sections).
JMeter performance tests
Writing Tests
JMeter will interact with Cloud Spanner just like your application. It will perform DML operations the same way as your application does. Hence, tests need to simulate production like transactions. For example if a transaction is made up of insert and/or update statements in several tables within transaction boundaries then JMeter should mimic the same.
JMeter has the following hierarchy:
Test Plan > Thread Group(s) > Sampler(s) (aka test)
Test plan is a top level component. It can contain global properties and libraries (like jdbc driver etc).
Thread Group(s) are representative of a database transaction. It contains one or more sampler(s). All the samplers within a thread group execute serially.
Sampler(s) should represent a single DML call. If your transaction needs to have multiple dml calls, you should create multiple samplers. Typically you will use JDBC Sampler for database calls. You can also use JSR 223 Sampler as described here, in case you need to use mutations or parallel reads etc. Results from one sampler can be passed to the next, as in real world application.
Executing tests and collecting results
JMeter tests should be executed as physically close to Cloud Spanner instances as possible to minimize network latency. Therefore it is best to execute them from Compute Engine (via private service connect) from the same region as the Cloud Spanner instance. In-case of multi region Cloud Spanner, GCE instances should be created in the Leader Region of the Cloud Spanner instance for lowest network latency.
JMeter should be executed via command line, it is a CPU intensive application so make sure you have allocated enough resources on the VM.
Refer to the Cloud Spanner monitoring dashboard to ensure that your Cloud Spanner instance’s CPU utilization is at or below the recommended values. In addition, use introspection tools to investigate performance issues with your database.
You might need to optimize your queries (add indexes) and re-execute tests in multiple waves to tune the performance as needed.
Try it yourself
Follow a detailed step by step tutorial on Measure Cloud Spanner performance test using JMeter to test Cloud Spanner performance yourself.
Neo4J & Google Cloud: Graph Data in Cloud to Address Challenges in FinServ Industry

6884
Of your peers have already read this article.
3:00 Minutes
The most insightful time you'll spend today!
Over the last decade, financial service organizations have been adopting a cloud-first mindset. According to InformationWeek, lower costs and enhanced scalability were the biggest drivers for cloud adoption in financial services, and cloud-native applications allow access to the latest technology and talent, enabling adopters to rebuild transaction processing systems capable of supporting very high volumes and low latency.
Both Neo4j and Google Cloud have been using relationship-based data representations since the beginning, and we’re dedicated to using this technology to help financial services customers drive business transformation. We are excited about the prospects of financial services (FinServ) cloud systems and believe that graph data in the cloud can help solve significant challenges in the industry.
Data Challenge #1: Risk Management and Compliance
First among the top concerns for any CIO moving to the cloud is risk management and compliance. Disconnected, uncontextualized, or stale data create opportunities for fraud and financial crimes to occur. The fact is when it comes to FinServ, the question is not “if” but rather how often an attack will occur. Unfortunately, incidents have been trending upward over the last decade, and COVID has only exacerbated this reality. Financial crimes affect the bottom line both in the remediation of these crimes and in intangibles like brand value.
Add to this the complexity of international banking, which makes “compliance” a moving target. Penalties due to noncompliance are a constant concern to any FinServ organization.
The tabular representation of information with a fixed number of columns that never change prevents a description of an ever changing world with changing characteristics. Relational databases are great if the world you describe does not move fast but have limitations when data structures are highly interlinked and not homogeneous.
Neo4j Aura on Google Cloud provides a foundation for creating dynamic, futureproof, scalable applications that adhere to the security standards and protocols today’s financial services organizations require to meet the challenges of finding and preventing bad actors. This also includes enterprise scalability; reaching over 1 Billion nodes and relationships to streamline queries and provide solutions that meet regulatory and privacy compliance across geographies. Neo4j has helped some organizations save billions of USD in fraud in the first year of deployment alone.
What makes graph technology the best choice for fraud detection use cases is that the relationships between the data-points are as important as the data-points themselves. Let’s take as an example, one John Smith approaches a multi-national banking institution to manage the primary account for his new holding corporation.
While no one has any record of John R Smith Holdings LLC, the bank’s application built on graph technology understands that there are several well-known entities owned by John Smith Holdings. The application also identifies several well-known board members who bank with this institution. Due to this relationship-driven approach, the bank now understands John R Smith is not “John Smith,” who previously attempted to open an account for his holding corporation, which had no information associated with it prior to two months ago.
Data Challenge #2 Manual Processes and Inefficiencies
The ubiquity of the cloud offers an opportunity to deploy automation at unprecedented levels to tackle the errors and inefficiencies that manual processing allows to creep into processes. When data comes from disparate, perhaps legacy systems – which may have become siloed and “untouchable” over the years – further complexity arises. As an example, if someone in sales types “John Smith” into a CRM system not knowing that John R Smith is the spelling in the customer data master, it may result in two separate and potentially conflicting records. Being able to join those records together in a mastered view helps to solve this problem. In addition, low data quality equates to an increase in risk, costs, and implementation times for new systems.
Neo4j Aura on Google Cloud provides automation and artificial intelligence (AI) that reduces manual processes and the errors that accompany them. In this graph architecture each node, which can represent a person, will have labels, relationships, and properties associated with it. This allows for the use of AI which can easily understand that John Smith in the CRM is the same John R Smith in the customer master. The information contained in Neo4j can be connected bi-directionally to ensure consistency across applications and data sources.
One of the benefits of this approach is that linking information allows organizations to keep the full value of the data, rather than forcing the data into predetermined tabular representations, with the risk of losing valuable information and insights.
Data Challenge #3: Customer Engagement and Insight
Another significant concern is the high expectations today’s customers have for every interaction. End users are accustomed to predictable experiences on their digital devices, and FinServ apps are no exception. Added to this, the “Covid economy” has driven digital adoption significantly across demographics; even among customers who might traditionally have used in-person services. This also equates to increased expectations for personalized, predictable experiences with every digital interaction. We know that latency has always been a key consideration for financial trading, but a recent ComputerWeekly study showed that every financial organization should ensure their visible latency is at 10 milliseconds or less. Customers no longer accept their broadband is at fault.
Finally, blind spots in the customer journey often result in dissatisfaction, which ultimately leads to increased churn. Without gaining actionable insights from your customers, there is no room to innovate and iterate on what they are looking for in your products and services. And this translates to losing market share and competitive advantage.
The NoSQL architecture, specifically the dynamic schema and structure of Neo4j Aura gives you the ability to take charge of your data and make changes according to your development cycles or newer data models. This equates to faster builds, more comprehensive releases and a wider, richer data-set that can be contextualized and understood instantly. Graph technology is the logical choice for building a Customer 360 application. Under this approach organizations not only get valuable insight into the individual client’s behavior and patterns, but also those of their family, friends and colleagues. This allows for stronger personalization, targeted campaigns and successful execution, resulting in increased customer satisfaction and retention levels.
Graph Technology on Google Cloud

Neo4j is a recognized leader in graph database technology and the only fully integrated graph solution on Google Cloud, helping to fill a common need for Google Cloud customers. Both Neo4j and Google Cloud are invested in continuing to grow our partnership and mutual product direction.
You can find and deploy the Neo4j graph database straight from the Google Cloud marketplace, whether you want to download the software for an on-premises deployment, use the virtual machine image, or use the hosted solution, Aura on Google Cloud, the graph database-as-a-service. In any deployment, you get the same enterprise-grade scalability, reliability, and connectivity along with successful, repeatable use cases you can rely on to resolve your particular challenges and integrated billing.
For a real-world example of how graph technology can optimize financial services, you can read our Case Study with fintech Current. Current, a leading U.S. financial technology platform with over three million members, used Neo4j Aura on Google Cloud to create a personalization engine based on client relationships.
To learn more about Neo4j Aura on Google Cloud for FinServ organizations, register for our webinar on Thursday, December 16 with Jim Webber, Chief Scientist, CTO Field Ops at Neo4j and Antoine Larmanjat, Technical Director, Office of the CTO, Google Cloud.
BigQuery ML for Sentiment Analysis: How to Make the Most of Your Data

1799
Of your peers have already read this article.
4:30 Minutes
The most insightful time you'll spend today!
Introduction
We recently announced BigQuery support for sparse features which help users to store and process the sparse features efficiently while working with them. That functionality enables users to represent sparse tensors and train machine learning models directly in the BigQuery environment. Being able to represent sparse tensors is a useful feature because sparse tensors are used extensively in encoding schemes like TF-IDF as part of data pre-processing in NLP applications and for pre-processing images with a lot of dark pixels in computer vision applications.
There are numerous applications of sparse features such as text generation and sentiment analysis. In this blog, we’ll demonstrate how to perform sentiment analysis with the space features in BigQuery ML by training and inferencing machine learning models using a public dataset. This blog also highlights how easy it is to work with unstructured text data on BigQuery, an environment traditionally used for structured data.
Using sample IMDb dataset
Let’s say you want to conduct a sentiment analysis on movie reviews from the IMDb website. For the benefit of readers who want to follow along, we will be using the IMDb reviews dataset from BigQuery public datasets. Let’s look at the top 2 rows of the dataset.
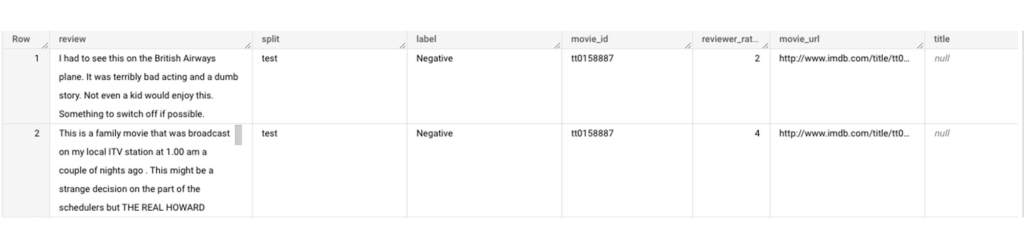
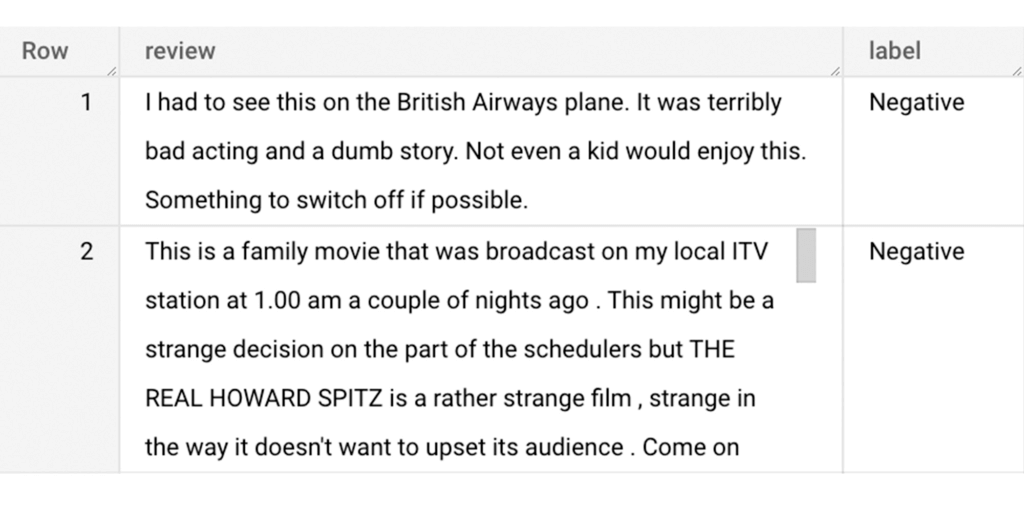
Although the reviews table has 7 columns, we only use reviews and label columns to perform sentiment analysis for this case. Also, we are only considering negative and positive values in the label columns. The following query can be used to select only the required information from the dataset.
SELECT
 review,
 label,
FROM
 `bigquery-public-data.imdb.reviews`
WHERE
 label IN ('Negative', 'Positive')
The top 2 rows of the result is as follows:
Methodology
Based on the dataset that we have, the following steps will be carried out:
- Build a vocabulary list using the review column
- Convert the review column into sparse tensors
- Train a classification model using the sparse tensors to predict the label (“positive” or “negative”)
- Make predictions on new test data to classify reviews as positive or negative.
Feature engineering
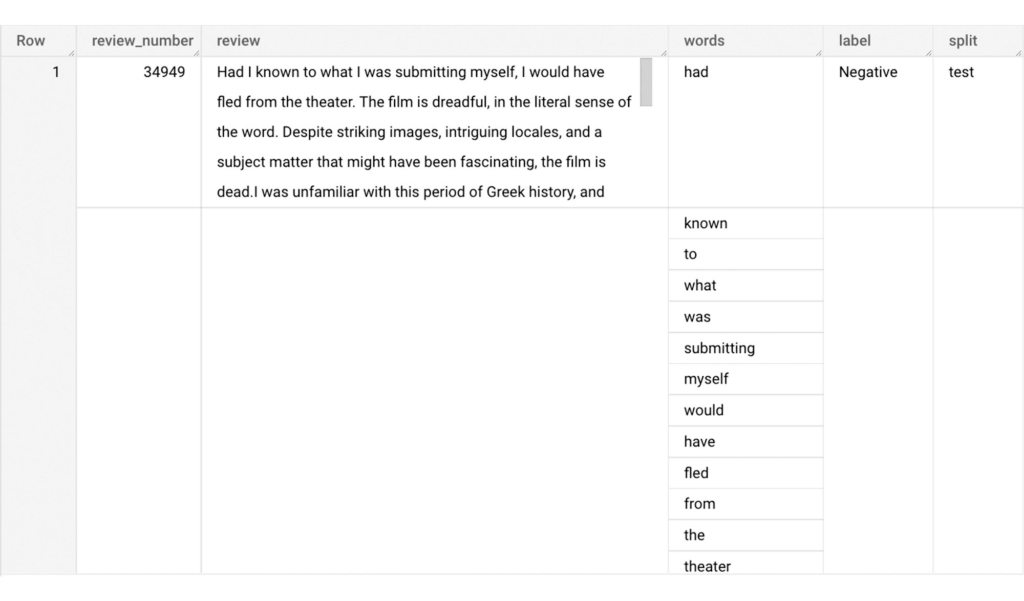
In this section, we will convert the text from the reviews column to numerical features so that we can feed them into a machine learning model. One of the ways is the bag-of-words approach where we build a vocabulary using the words from the reviews and select the most common words to build numerical features for model training. But first, we must extract the words from each review. The following code creates a dataset and a table with row numbers and extracted words from reviews.
-- Create a dataset named `sparse_features_demo` if doesn’t exist
CREATE SCHEMA IF NOT EXISTS sparse_features_demo;


-- Select unique reviews with only negative and positive labels
CREATE OR REPLACE TABLE sparse_features_demo.processed_reviews AS (
 SELECT
   ROW_NUMBER() OVER () AS review_number,
   review,
   REGEXP_EXTRACT_ALL(LOWER(review), '[a-z]{2,}') AS words,
   label,
   split
 FROM (
   SELECT
     DISTINCT review,
     label,
     split
   FROM
     `bigquery-public-data.imdb.reviews`
   WHERE
     label IN ('Negative', 'Positive')
 )
);
The output table from the query above should look like this:
The next step is to build a vocabulary using the extracted words. The following code creates a vocabulary including word frequency and word index from reviews. For this case, we are going to select only the top 20,000 words to reduce the computation time.
-- Create a vocabulary using train dataset and select only top 20,000 words based on frequency
CREATE OR REPLACE TABLE sparse_features_demo.vocabulary AS (
 SELECT
   word,
   word_frequency,
   word_index
 FROM (
   SELECT
     word,
     word_frequency,
     ROW_NUMBER() OVER (ORDER BY word_frequency DESC) - 1 AS word_index
   FROM (
     SELECT
       word,
       COUNT(word) AS word_frequency
     FROM
       sparse_features_demo.processed_reviews,
       UNNEST(words) AS word
     WHERE
       split = "train"
     GROUP BY
       word
   )
 )
 WHERE
   word_index < 20000 # Select top 20,000 words based on word count
);
The following shows the top 10 words based on frequency and their respective index from the resulting table of the query above.
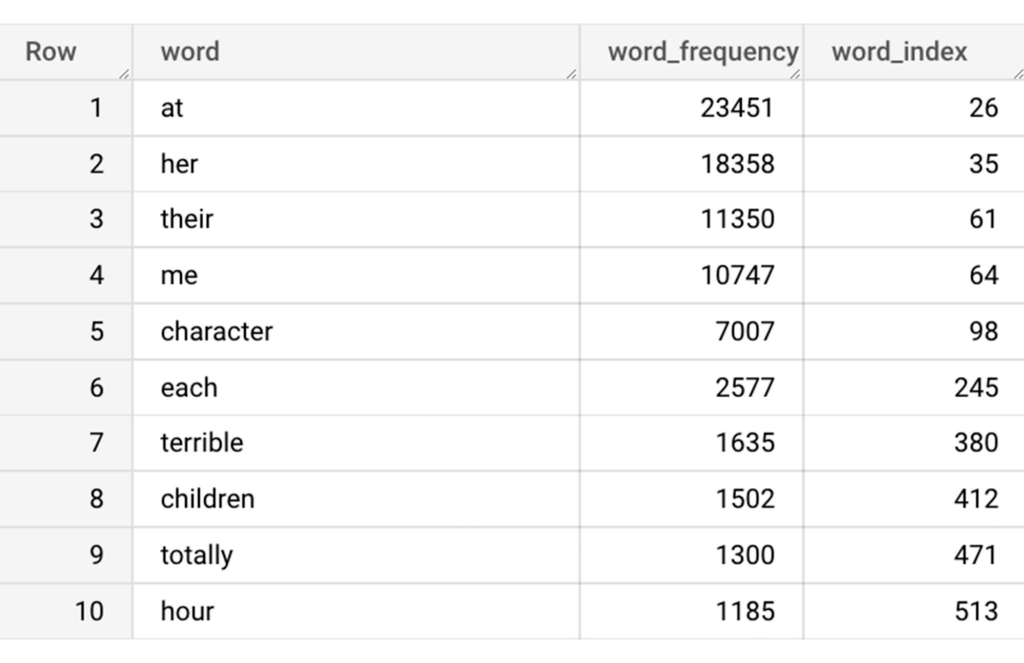
Creating a sparse feature
Now we will use the newly added feature to create a sparse feature in BigQuery. For this case, we aggregate word_index and word_frequency in each review, which generates a column as ARRAY[STRUCT] type. Now, each review is represented as ARRAY[(word_index, word_frequency)].
-- Generate a sparse feature by aggregating word_index and word_frequency in each review.
CREATE OR REPLACE TABLE sparse_features_demo.sparse_feature AS (
 SELECT
   review_number,
   review,
   ARRAY_AGG(STRUCT(word_index, word_frequency)) AS feature,
   label,
   split
 FROM (
   SELECT
     DISTINCT review_number,
     review,
     word,
     label,
     split
   FROM
     sparse_features_demo.processed_reviews,
     UNNEST(words) AS word
   WHERE
     word IN (SELECT word FROM sparse_features_demo.vocabulary)
 ) AS word_list
 LEFT JOIN
   sparse_features_demo.vocabulary AS topk_words
   ON
     word_list.word = topk_words.word
 GROUP BY
   review_number,
   review,
   label,
   split
);
Once the query is executed, a sparse feature named `feature` will be created. That `feature` column is an `ARRAY of STRUCT` column which is made of `word_index` and `word_frequency` columns. The picture below displays the resulting table at a glance.
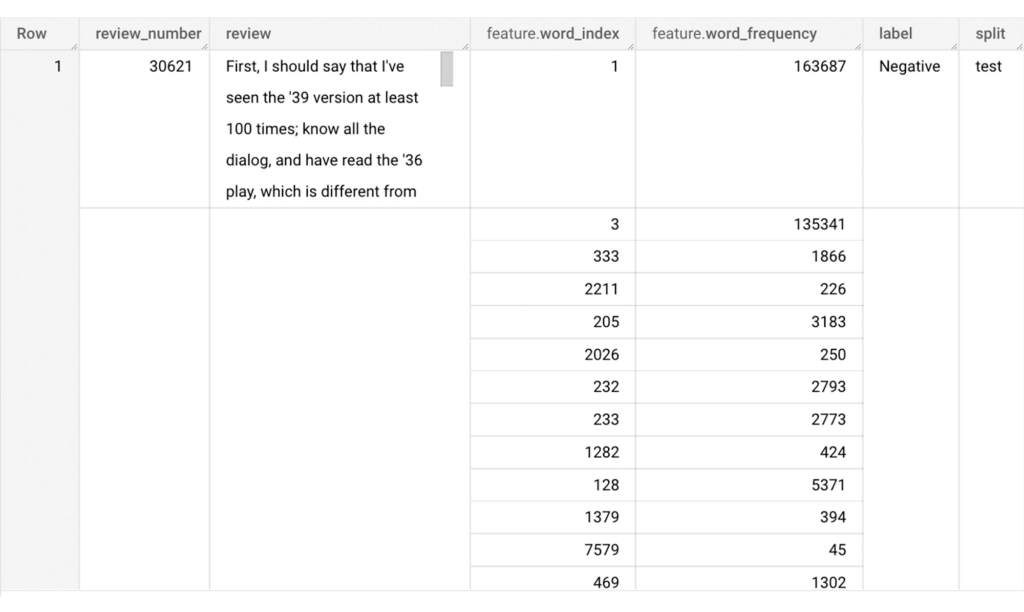
Training a BigQuery ML model
We just created a dataset with a sparse feature in BigQuery. Let’s see how we can use that dataset to train with a machine learning model with BigQuery ML. In the following query, we will train a logistic regression model using the review_number, review, and feature to predict the label:
-- Train a logistic regression classifier using the data with sparse feature
CREATE OR REPLACE MODEL sparse_features_demo.logistic_reg_classifier
 TRANSFORM (
   * EXCEPT (
       review_number,
       review
     )
 )
 OPTIONS(
   MODEL_TYPE='LOGISTIC_REG',
   INPUT_LABEL_COLS = ['label']
 ) AS
 SELECT
   review_number,
   review,
   feature,
   label
 FROM
    sparse_features_demo.sparse_feature
 WHERE
   split = "train"
;
Now that we have trained a BigQuery ML Model using a sparse feature, we evaluate the model and tune it as needed.
-- Evaluate the trained logistic regression classifier
SELECT * FROM ML.EVALUATE(MODEL sparse_features_demo.logistic_reg_classifier);
The score looks like a decent starting point, so let’s go ahead and test the model with the test dataset.

-- Evaluate the trained logistic regression classifier using test data
SELECT * FROM ML.EVALUATE(MODEL sparse_features_demo.logistic_reg_classifier,
 (
   SELECT
     review_number,
     review,
     feature,
     label
   FROM
     sparse_features_demo.sparse_feature
   WHERE
     split = "test"
 )
);
The model performance for the test dataset looks satisfactory and it can now be used for inference. One thing to note here is that since the model is trained on the numerical features, the model will only accept numeral features as input. Hence, the new reviews have to go through the same transformation steps before they can be used for inference. The next step shows how the transformation can be applied to a user-defined dataset.
Sentiment predictions from the BigQuery ML model
All we have left to do now is to create a user-defined dataset, apply the same transformations to the reviews, and use the user-defined sparse features to perform model inference. It can be achieved using a WITH statement as shown below.
WITH
 -- Create a user defined reviews
 user_defined_reviews AS (
   SELECT
     ROW_NUMBER() OVER () AS review_number,
     review,
     REGEXP_EXTRACT_ALL(LOWER(review), '[a-z]{2,}') AS words
   FROM (
     SELECT "What a boring movie" AS review UNION ALL
     SELECT "I don't like this movie" AS review UNION ALL
     SELECT "The best movie ever" AS review
   )
 ),


 -- Create a sparse feature from user defined reviews
 user_defined_sparse_feature AS (
   SELECT
     review_number,
     review,
     ARRAY_AGG(STRUCT(word_index, word_frequency)) AS feature
   FROM (
     SELECT
       DISTINCT review_number,
       review,
       word
     FROM
       user_defined_reviews,
       UNNEST(words) as word
     WHERE
       word IN (SELECT word FROM sparse_features_demo.vocabulary)
   ) AS word_list
   LEFT JOIN
     sparse_features_demo.vocabulary AS topk_words
     ON
       word_list.word = topk_words.word
   GROUP BY
     review_number,
     review
 )


-- Evaluate the trained model using user defined data
SELECT review, predicted_label FROM ML.PREDICT(MODEL sparse_features_demo.logistic_reg_classifier,
 (
   SELECT
     *
   FROM
     user_defined_sparse_feature
 )
);
Here is what you would get for executing the query above:
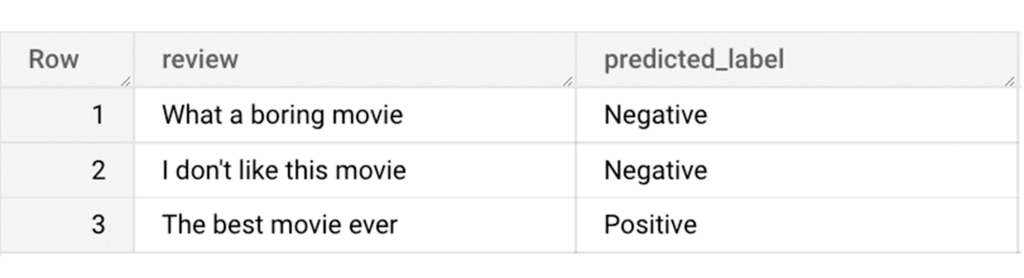
And that’s it! We just performed a sentiment analysis on the IMDb dataset from a BigQuery Public Dataset using only SQL statements and BigQuery ML. Now that we have demonstrated how sparse features can be used with BigQuery ML models, we can’t wait to see all the amazing projects that you would create by harnessing this functionality.
If you’re just getting started with BigQuery, check out our interactive tutorial to begin exploring.
11195
Of your peers have already watched this video.
1:30 Minutes
The most insightful time you'll spend today!
Indian Retailer Figures Optimizes Hyperlocal Delivery to Increase Customer Experience
Anyone who follows the Indian e-commerce scene knows that one of the largest challenges these companies face is hyperlocal delivery.
That was a problem facing Wellness Forever, a retail chain of pharmacies with 150-plus stores across India.
“Exactly a year ago, we started our journey of hyperlocal deliveries. This optimization was a big time challenge for us to understand how to optimize this,” Palani Subbiah, CTO, Wellness Forever.
The problem in front of Wellness Forever was to identify which customer could can be sold from which store, so that a delivery could be made within 90 minutes.
“We handle a large amount of customer data and we wanted to use insights to help and improve the customer satisfaction index,” says Subbiah.
To do that Wellness Forever leveraged Google Big Query to run massive amount of data to come up with the operational insights. They also used Firebase and Google Maps.
“By 2021, we are going to have about 450 stores. Those stores are going to be not only a physical store, which is a digital store.
More Relevant Stories for Your Company


Can Your Data Warehouse Handle a 100-Trillion Row Query?
Today's enterprise demands from data go far beyond the capabilities of traditional data warehousing and for many leaders, the need to digitally transform their businesses is a key driver for data analytics spending. Businesses want to make real-time decisions from fresh information as well as make future predictions from their

Is it Cheaper to Run Oracle Workloads on Google Cloud Than On-Prem? Yes, By 78%
On-premises relational database management systems (RDBMS) are the traditional heart of many core business operations, but cloud-based relational databases provide the agility and scalability of the cloud while eliminating many of the onerous tasks associated with maintaining your own infrastructure. To find out how much more value cloud-based relational databases

Creating and Using Storage Buckets for Your Data Needs
So, you want to store objects on the cloud? But you're really new to Google Cloud or Cloud Storage and would like someone to walk you through the process step by step? Today is your lucky day! I will help you understand the big steps involved in setting up and
How We Built a Brand New Bank on Google Cloud and Cloud Spanner: The First Scalable, Enterprise-grade, Database Service
Editor’s note: Technology today lets companies of any size take on entire industries simply with an innovative business model plus digital distribution. Take Shine, a French startup whose platform helps freelancers manage their finances -- and their administrative commitments. Here, Raphael Simon, Shine’s CTO and co-founder, talks about why Shine
