





Key Highlights on Data Analytics to Smooth Your Organization’s Data Journey

4861
Of your peers have already read this article.
2:00 Minutes
The most insightful time you'll spend today!
As the Olympics kicked off in Tokyo at the end of July, we found ourselves reflecting on the beauty of diverse countries and cultures coming together to celebrate greatness and sportsmanship. For this month’s blog, we’d like to highlight some key data and analytics performances that should help inspire you to reach new heights in your data journey.
Let’s review the highlights!
BigQuery ML Anomaly Detection: A perfect 10 for augmented analytics
Identifying anomalous behavior at scale is a critical component of any analytics strategy. Whether you want to work with a single frame of data or a time series progression, BigQuery ML allows you to bring the power of machine learning to your data warehouse.
In this blog released at the beginning of last month, our team walked through both non-time series and time-series approaches to anomaly detection in BigQuery ML:
- Non-time series anomaly detection
- Autoencoder model (now in Public Preview)
- K-means model (already in GA)
- Time-series anomaly detection
- ARIMA_PLUS time series model (already in GA)
These approaches make it easy for your team to quickly experiment with data stored in BigQuery to identify what works best for your particular anomaly detection needs. Once a model has been identified as the right fit, you can easily port that model into the Vertex AI platform for real-time analysis or schedule it in BigQuery for continued batch processing.
App Analytics: Winning the team event
Google provides a broad ecosystem of technologies and services aimed at solving modern day challenges. Some of the best solutions come when those technologies are combined with our data analytics offerings to surface additional insights and provide new opportunities.
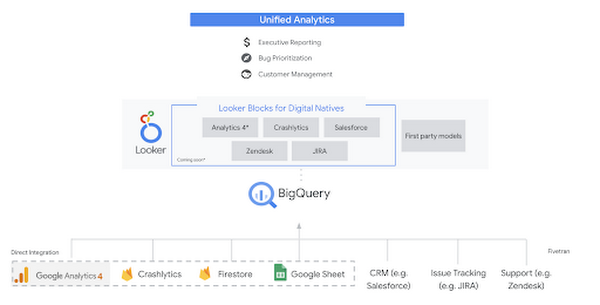
Firebase has deep adoption in the app development community and provides the technology backbone for many organization’s app strategy. This month we launched a design pattern that shows Firebase customers how to use Crashlytics data, CRM, issue tracking, and support data in BigQuery and Looker to identify opportunities to improve app quality and enhance customer experiences.
Crux on BigQuery: Taking gold in the all-around data competition
Crux Informatics provides data services to many large companies to help their customers make smarter business decisions. While they were already operating on a modern stack and not on the hunt for a modern data warehouse, BigQuery became an enticing option due to performance and a more optimal pricing model. Crux also found advantages with lower-cost ingestion and processing engines like Dataflow that allow for streaming analytics.… when it came to building a centralized large-scale data cloud, we needed to invest in a solution that would not only suit our current data storage needs but also enable us to tackle what’s coming, supporting a massive ecosystem of data delivery and operations for thousands of companies.
Mark Etherington
Chief Technology Office, Crux Informatics
Technology is a team sport, and Crux found our support team responsive and ready to help. This decision to more deeply adopt Google Cloud’s data analytics offerings provides Crux with the flexibility to manage a constantly evolving data ecosystem and stay competitive.
You can read more about Crux’s decision to adopt BigQuery in this blog.
Google Trends: A classic emerges a champion
Following up on the launch of our Google Trends dataset in June, we delivered some examples of how to use that data to augment your decision making.
As a quick recap of that dataset, Google Cloud, and in particular BigQuery, provide access to the top 25 trending terms by Nielsen’s Designated Market Area® (DMA) with a weekly granularity. These trending terms are based on search patterns and have historically only been available on the Google Trends website.https://www.youtube.com/embed/9FJAXMF0ASc?enablejsapi=1&
The Google Trends design pattern addresses some common business needs, such as identifying what’s trending geographically near your stores and how to match trending terms to products to identify potential campaigns.
Dataflow GPU: More power than ever for those streaming sprints
Dataflow is our fully-managed data processing platform that supports both batch and streaming workloads. The ability of Dataflow to scale and easily manage unbounded data has made it the streaming solution of choice for large workloads with high-speed needs in Google Cloud.
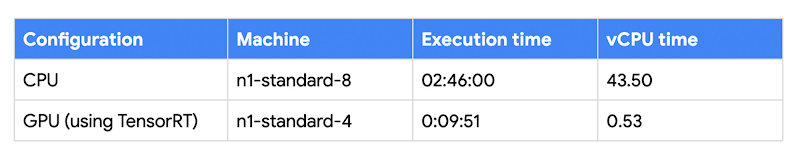
But what if we could take that speed and provide even more processing power for advanced use cases? Our team, in partnership with NVIDIA, did just that by adding GPU support to Dataflow. This allows our customers to easily accelerate compute-intensive processing like image analysis and predictive forecasting with amazing increases in efficiency and speed.
Take a look at the times below:
Data Fusion: A play-by-play for data integration’s winning performance
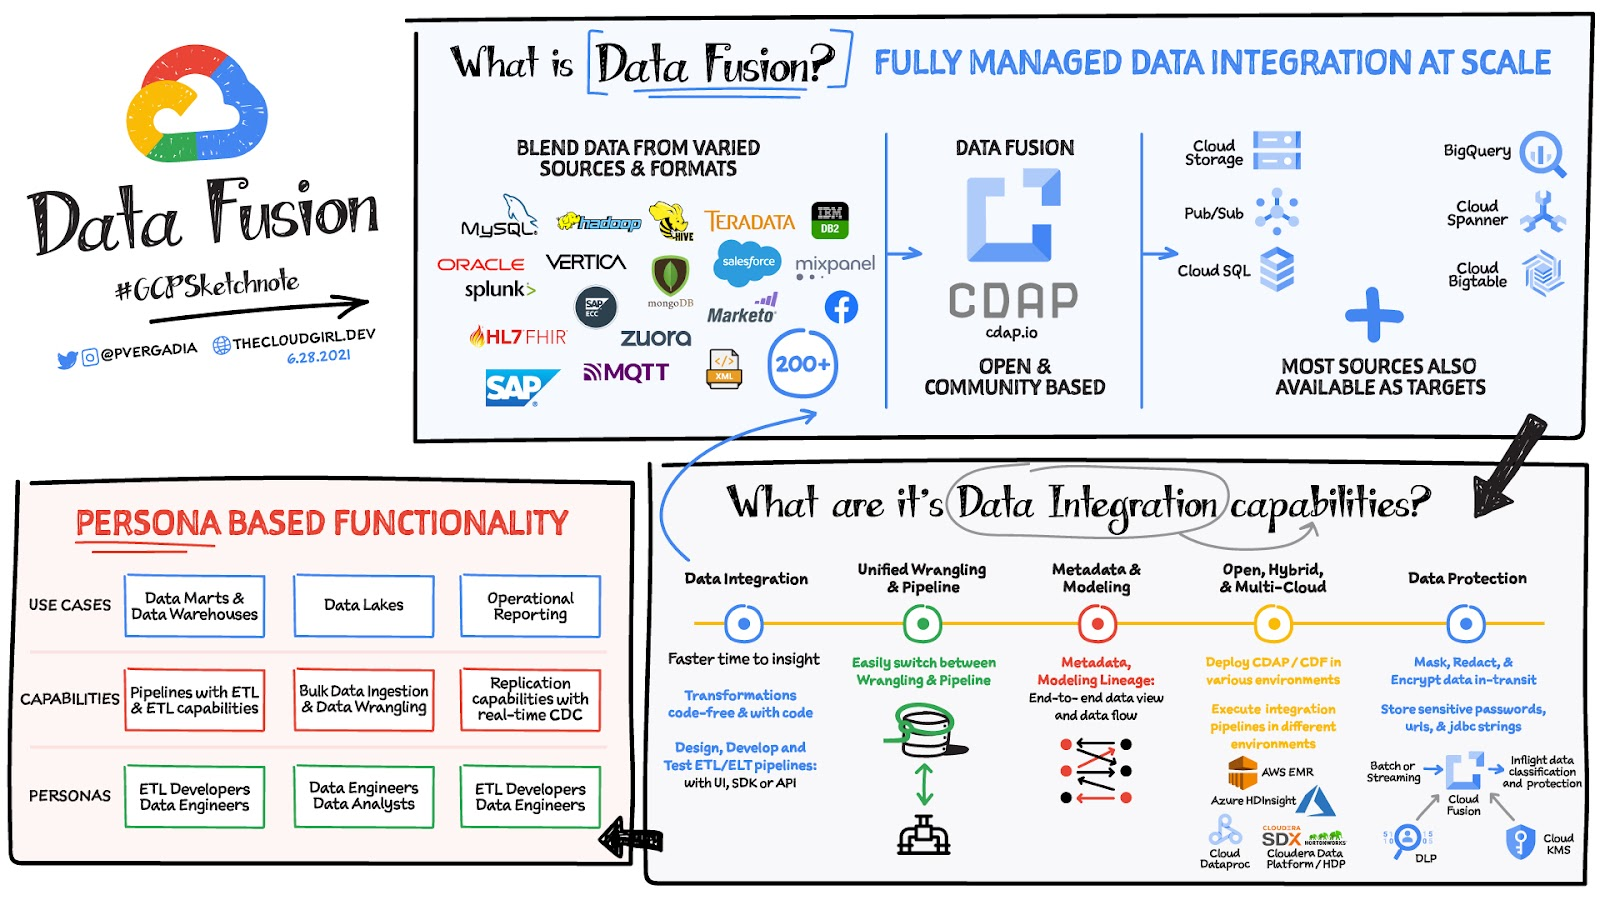
Data Fusion provides Google Cloud customers with a single place to perform all kinds of data integration activities. Whether it’s ETL, ELT, or simply integrating with a cloud application, Data Fusion provides a clean UI and streamlined experience with deep integrations to other Google Cloud data systems. Check out our team’s review of this tool and the capabilities it can bring to your organization.
What Drives Your Organization to be Data-driven?

4894
Of your peers have already read this article.
4:00 Minutes
The most insightful time you'll spend today!
Every organization has its own unique data culture and capabilities. Yet each is expected to use technology trends and solutions in the same way as everyone else. Your organization may be built on years of legacy applications, you may have developed a considerable amount of expertise and knowledge, yet you may be asked to adopt a new approach based on a technology trend. On the other hand, you may be on the other side of the spectrum, a digitally native organization built with engineering principles from scratch without legacy systems but expected to follow the same principles as process driven, established organizations. The question is, should we treat these organizations in the same way when it comes to data processing? In this series of blogs and papers this is what we are exploring: how to set up an organization from the first principles from data analyst, data engineering and data science point of view. In reality, there is no such organization that is solely driven by one of these but it is likely to be a combination of multiple types. What type of organization you become is then driven by how much you are influenced by each of these principles.
When you are considering what data processing technology encompasses, take a step back and make a strategic decision based on your key goals. This can be whether you optimize for performance, cost, reduction in operational overhead, increase in operational excellence, integration of new analytical and machine learning approaches. Or perhaps you’re looking to leverage existing employees’ skills while meeting all your data governance and regulatory requirements. We will be exploring these different themes and will focus on how they guide your decision-making process. You may be coming from technologies which are solving some of the past problems and some of the terminologies may be more familiar, however they don’t scale your capabilities. There is also the opportunity cost of prioritizing legacy and new issues that arise from a transformation effort, and as a result your new initiative can set you further behind on your core business while you play catch up to an ever changing technology landscape.
Data value chain
The key for any ingestion and transformation tool is to extract data from a source and start acting on it. The ultimate goal is to reduce the complexity and increase the timeliness of the data. Without data, it is impossible to create a data driven organization and act on the insights. As a result, data needs to be transformed, enriched, joined with other data sources, and aggregated to make better decisions. In other words, insights on good timely data mean good decisions.
While deciding on the data ingestion pipeline, one of the best approaches is to look into the volume of data, the velocity of the data, and type of data that is arriving. Other considerations include the number of different data sources you are managing, whether you need to scale to thousands of sources using generic pipelines, whether you want to create one generic pipeline but then apply data quality rules and governance. ETL tools are ideal for this use case as generic pipelines can be written and then parameterized.
On the other hand, consider the data source. Can the data be directly ingested without transforming and formatting the data? If the data does not need to be transformed and can be ingested directly into the data warehouse as a managed solution. This not only reduces the operational costs but also allows for more timely data delivery. If the data is coming in through an unstructured format such as XML or in a format such as EBCDIC and needs to be transformed and formatted, then a tool with ETL Capabilities can be used depending on the speed of the data arrival.
It is also important to understand the speed and time of arrival of the data. Think about your SLAs and time durations/windows that are relevant for your data ingestion plans. This would not only drive the ingestion profiles but would also dictate which framework to use. As discussed above, velocity requirements would drive the decision-making process.
Type of Organization
Different organizations can be successful by employing different strategies based on the talent that they have. Just like in sports, each team plays with a different strategy with the ultimate goal of winning.
Organizations often need to decide on what’s the best strategy to take in respect to data ingestion and processing – whether you need to hire an expensive group of data engineers, or exploit your data wizards and analysts to enrich and transform data that can be acted on, or whether it would be more realistic to train the current workforce to do more functional/high value work rather than to focus on building generally understood and available foundational pieces.
On the other hand, the transformation part of ETL pipelines as we know it, dictates where the load will be. All of these are made a reality in the cloud native world where data can be enriched, aggregated, and joined. Loading data into a powerful and modern data warehouse means that you can already join and enrich the data using ELT. Consequently, ETL isn’t really needed in its strict terms anymore if the data can be loaded directly into the data warehouse.
All of the above was not possible in the traditional, siloed, and static data warehouses and data ecosystems whereby systems would not talk to each other or there were capacity constraints in respect to both storing and processing the data in the expensive Data Warehouse. This is no longer the case in the BigQuery world as storage is now cheap and transformations are now much more capable without constraints of virtual appliances.
If your organization is already heavily invested into an ETL tool, one option is to use them to load BigQuery and transform the data initially within the ETL tool. Once the as-is and to-be are verified to be matching, then with the improved knowledge and expertise one can start moving workloads into BigQuery SQL, and effectively do ELT.
Furthermore, if your organization is coming from a more traditional data warehouse that extensively relies on stored procedures and scripting, then the question that one may ask is, do I continue leveraging these skills and expertise and use these capabilities that are also provided in BigQuery? ELT with BigQuery is more natural, similar to what’s already in Teradata BTEQ, Oracle PL/SQL but migrating from ETL to ELT requires changes. This change then enables exploiting streaming use cases, such as real-time use cases in retail. This is because there is no preceding step before data is loaded and made available.
Organizations can be broadly classified under 3 types as Data Analyst Driven, Data Engineering driven, and Blended organization. We will be covering a Data Science driven organization within the Blended category.
Data Analyst Driven
Analysts understand the business and are used to using SQL/spreadsheets. Allowing them to do advanced analytics through interfaces that they are accustomed to enables scaling. As a result, easy to use ETL tooling to bring data quickly into the target system becomes a key driver. Ingesting data directly from a source or staging area then also becomes critical as it allows analysts to exploit their key skills using ELT and increases timeliness of the data. This is commonplace with traditional EDWs and realized by extended capabilities of using Stored Procedures and Scripting. Data is enriched, transformed, and cleansed using SQL and ETL tools act as the orchestration tools.
The capabilities brought by cloud computing on separation of data and computation changes the face of the EDW as well. Rather than creating complex ingestion pipelines, the role of the ingestion becomes, bringing data close to the cloud, staging on a storage bucket or on a messaging system before being ingested into the cloud EDW. This then releases data analysts to focus on looking into data insights using tools and interfaces that they are accustomed to.
Data Engineering / Data Science Driven
Building complex data engineering pipelines is expensive but enables increased capabilities. This allows creating repeatable processes and scaling the number of sources. Once complemented with cloud it enables agile data processing methodologies. On the other hand, data science organizations allow carrying out experiments and producing applications that work for specific use cases but are not often productionised or generalized.
Real-time analytics enables immediate responses and there are specific use cases where low latency anomaly detection applications are required to run. In other words, business requirements would be such that it has to be acted upon as the data arrives on the fly. Processing this type of data or application requires transformation done outside of the target.
All the above usually requires custom applications or state-of-the-art tooling which is achieved by organizations that excel with their engineering capabilities. In reality, there are very few organizations that can be truly engineering organizations. Many fall into what we call here as the blended organization.
Blended org
The above classification can be used on tool selection for each project. For example, rather than choosing a single tool, choose the right tool for the right workload, because this would reduce operational cost, license cost and use the best of the tools available. Let the deciding factor be driven by business requirements: each business unit or team would know the applications they need to connect with to get valuable business insights. This coupled with the data maturity of the organization would be the key to making sure the right data processing tool would be the right fit.
In reality, you are likely to be somewhere on a spectrum. Digital native organizations are likely to be closer to being engineering driven, due to their culture and business that they are in. However, brick and mortar organizations would be closer to being analyst driven due to the significant number of legacy systems and processes they possess. These organizations are either considering or working toward digital transformation with an aspiration of having a data engineering / software engineering culture like Google.
The blended organization with strong skills around data engineering, would have built the platform and built frameworks, to increase reusable patterns would increase productivity and then reduce costs. Data engineers focus on running Spark on Kubernetes whereas infrastructure engineers focus on container work. This in turn provides unparalleled capabilities as application developers focus on the data pipelines and even the underlying technologies or platforms changes code stays the same. As a result, security issues, latency requirements, cost demands and portability are addressed at multiple layers.
Conclusion – What type of organization are you?
Often an organization’s infrastructure is not flexible enough to react to a fast changing technological landscape. Whether you are part of an organization which is engineering driven or analyst driven, organizations frequently look at technical requirements that inform which architecture to implement. But a key, and frequently overlooked, component needed to truly become a data-driven organization is the impact of the architecture on your data users. When you take into account the responsibilities, skill sets, and trust of your data users, you can create the right data platform to meet the needs of your IT department as well as your business.
To become a truly data-driven organization, the first step is to design and implement an analytics data platform that meets your technical and business needs. The reality is that each organization is different and has a different culture, different skills, and capabilities. Key is to leverage its strengths to stay competitive while adopting new technologies when it is needed and as it fits to your organization.
To learn more about the elements of how to build an analytics data platform depending on the organization you are, read our paper here.
BigQuery Reference Guide: Understanding Tables within and Routine for Data Transformation

3688
Of your peers have already read this article.
3:00 Minutes
The most insightful time you'll spend today!
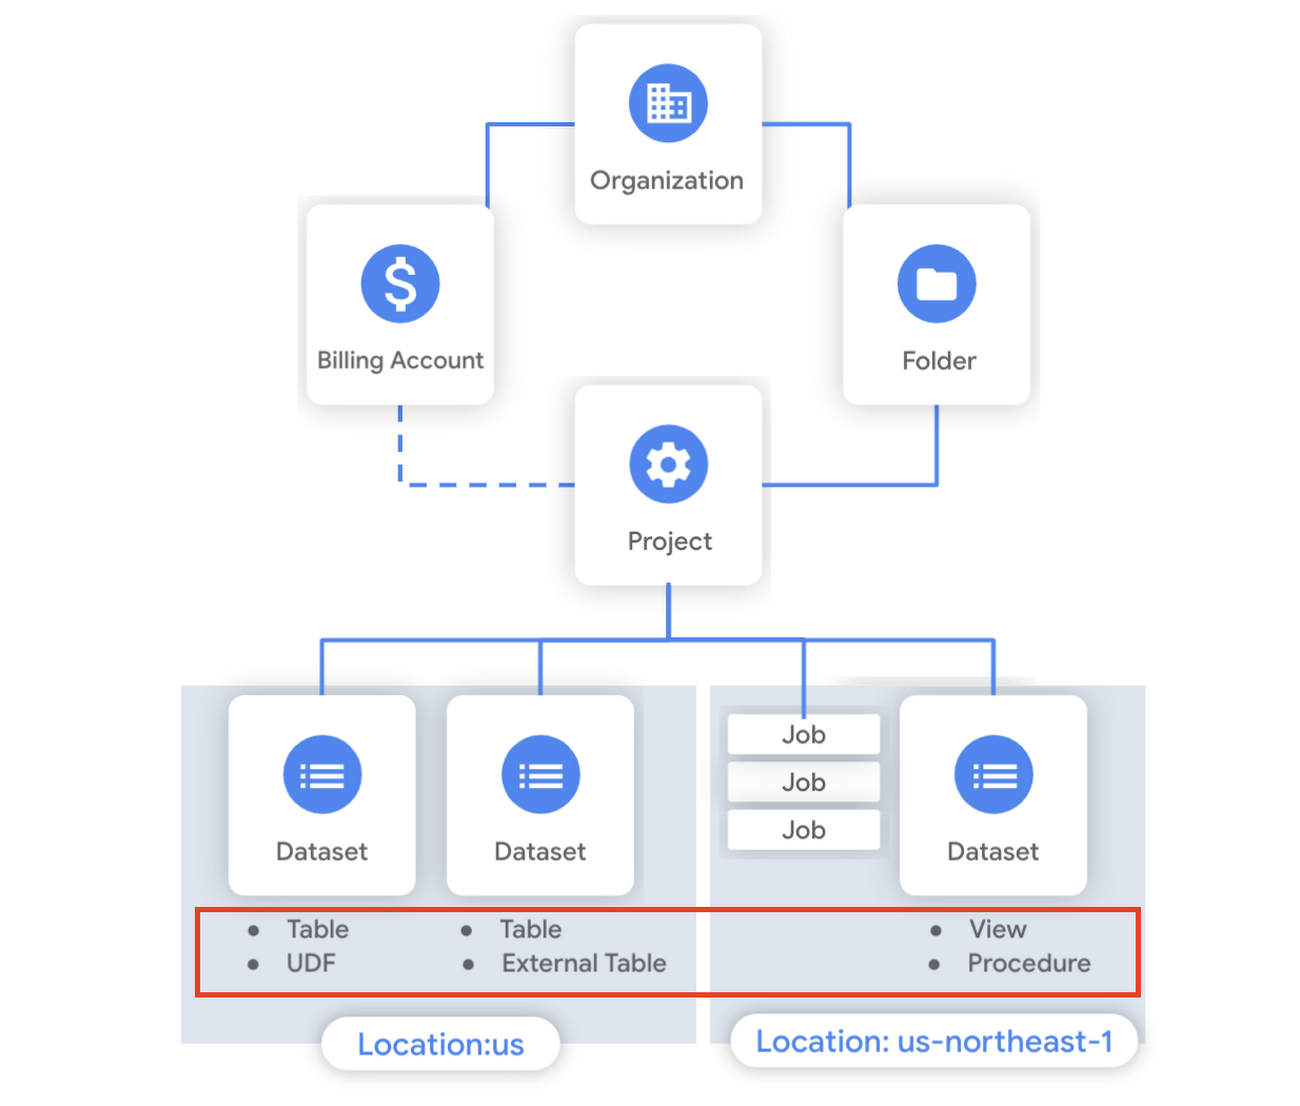
Last week in our BigQuery Reference Guide series, we spoke about the BigQuery resource hierarchy – specifically digging into project and dataset structures. This week, we’re going one level deeper and talking through some of the resources within datasets. In this post, we’ll talk through the different types of tables available inside of BigQuery, and how to leverage routines for data transformation. Like last time, we’ll link out to the documentation so you can learn more about using these resources in practice.
What is a table?
A BigQuery table is a resource that lives inside a dataset. It contains individual records organized into rows, with each record composed of columns (also called fields) where a specified data type is enforced. BigQuery supports numerous different data types including GEOGRAPHY for geospatial data, STRUCT and ARRAY for more complex data, and new parameterized data types to add specific constraints like the number of characters in a string.
Data access can also be controlled at the table, row and column levels; more details on data governance will be covered later in the series. Metadata, such as descriptions and labels, can be used for surfacing information to end users and as tags for monitoring. You can create and manage a table directly in the UI, through the API / Client SDKs or in a SQL query using a DDL statement.
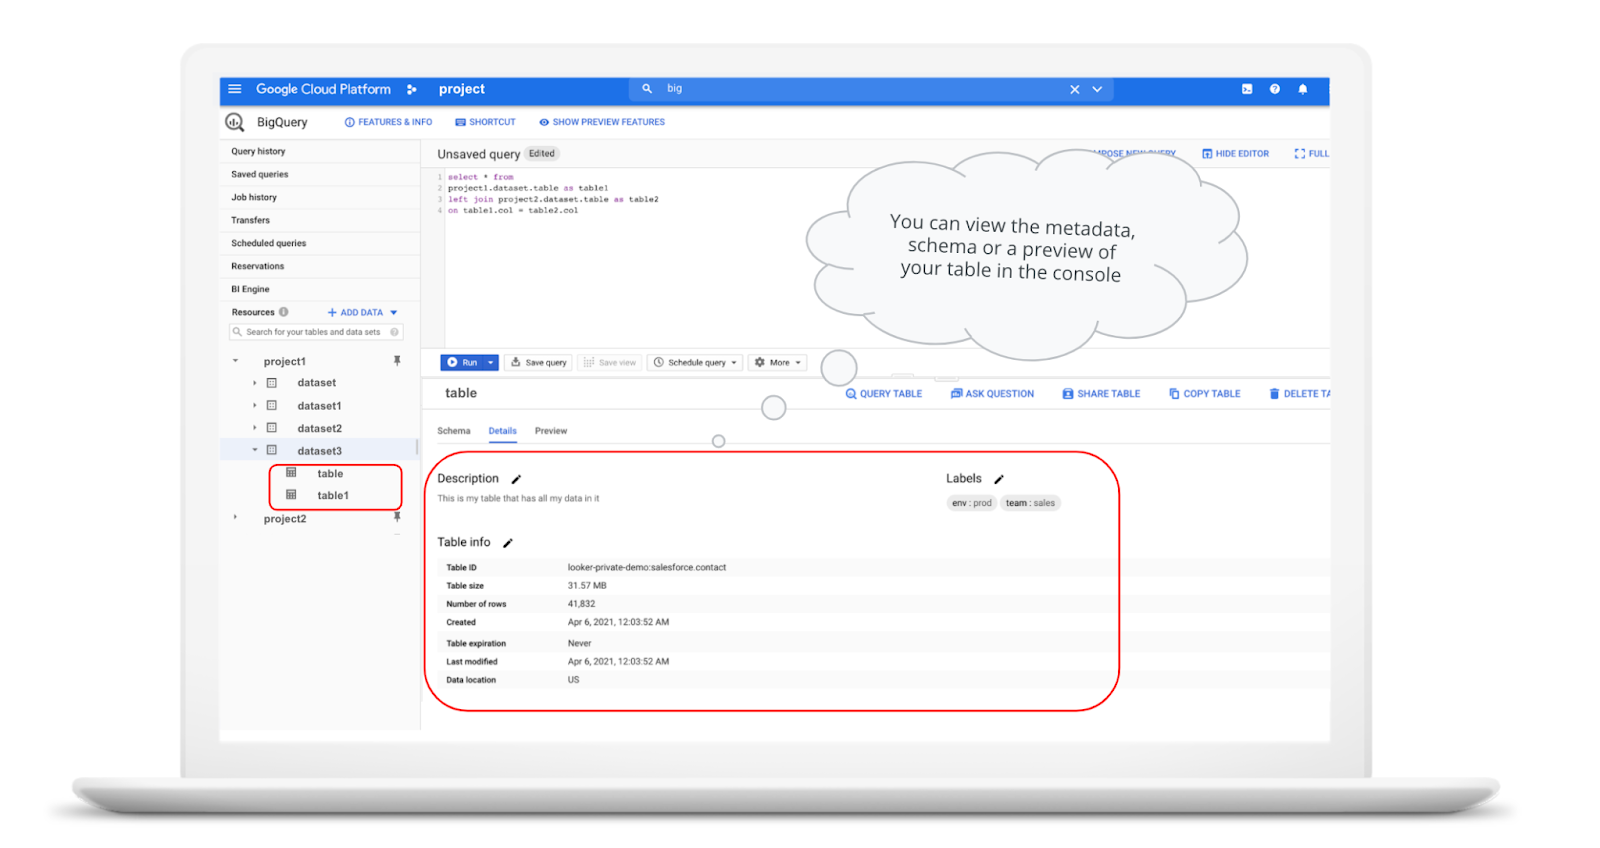
bq show \--schema \--format=prettyjson \project1:dataset3.table
Managed and external tables
Managed tables are tables that are backed by native BigQuery storage, which has many benefits that improve query performance including support for partitions and clusters. We’ll cover more details on BigQuery storage later in this series. Another advantage of using a managed table is that BigQuery allows you to use time travel to access data from any point within the last seven days and query data that was updated, expired or deleted. And now you can even create a snapshot of your table, to preserve its contents at a given time.
# create a snapshot of transactions in the library_backup dataset as of one hour agoCREATE SNAPSHOT TABLElibrary_backup.salesCLONE retail.transactionsFOR SYSTEM_TIME AS OF TIMESTAMP_SUB(CURRENT_TIMESTAMP(), INTERVAL 1 HOUR);
While managed tables store data inside BigQuery storage, external tables are backed by storage external to BigQuery. BigQuery currently supports creating an external table from Cloud Storage, Cloud Bigtable and Google Drive. Besides an external table, you can create a connection to Cloud SQL, which is somewhat analogous to an external dataset. Here, you can leverage federated queries to send a query that executes in Cloud SQL but returns the results to be used within BigQuery.
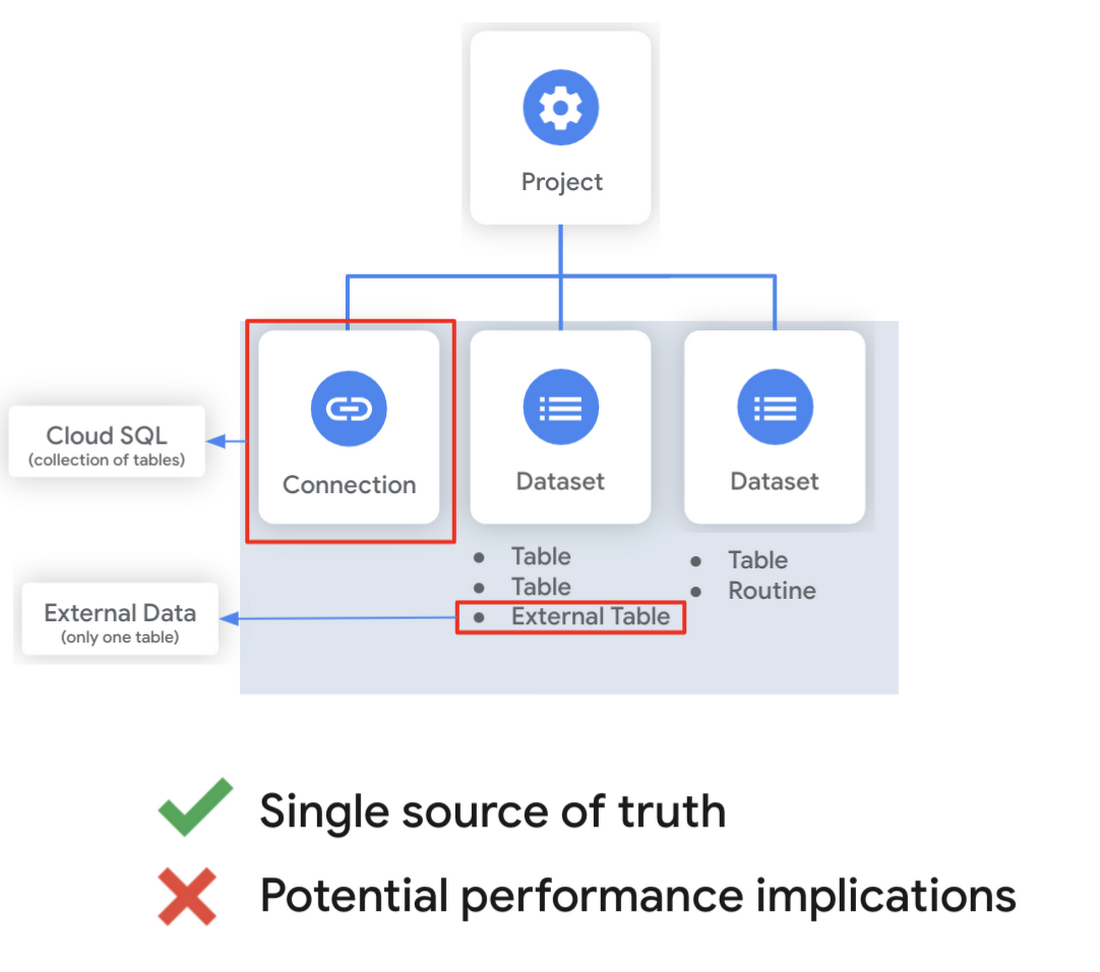
Using external tables or federated queries may result in queries that aren’t as fast as if the data had been stored in BigQuery itself. However, they can be useful for some data transformation patterns – for example, you may want to schedule a DDL/DML query that hydrates a managed table using a federated query, which selects and transforms data from Cloud SQL. An external table might also be useful for multi-consumer workflows where BQ storage isn’t the source of truth. Like, if you have a dataproc cluster accessing data in a Cloud Storage bucket that you’re not quite ready to port into BigQuery (although I do recommend taking a look at our connector if you need some convincing). You can learn more about querying external data in this video.
Logical and materialized views
In BigQuery, you can create a virtual table with a logical view or a materialized view. With logical views, BigQuery will execute the SQL statement to create the view at run time, it will not save the result anywhere. Additionally, you can grant users access to an authorized view to share query results without giving them access to the underlying tables.
# create a view that aggregates daily sales from a retail transaction tableCREATE VIEW retail.daily_sales as (SELECT date(t.transaction_timestamp) as date, sum(li.sale_price) as total_salesFROM retail.transaction_detail as tLEFT JOIN UNNEST(t.line_items) as liGROUP BY 1)
On the other hand, materialized views are re-computed in the background when the base data changes. No user action is required – they are always fresh! Better yet, if a query, or part of a query, against the source table can be resolved by querying the materialized view, BigQuery will reroute for improved performance. However, materialized views use a restricted SQL syntax and a limited set of aggregation functions. You can find details on limitations here.
# create a materialized view that aggregates daily salesCREATE MATERIALIZED VIEW retail.daily_sales as (SELECT date(t.transaction_timestamp) as date, sum(li.sale_price) as total_salesFROM retail.transaction_detail as tLEFT JOIN UNNEST(t.line_items) as liGROUP BY 1)
Temporary and cached results tables
Aside from the tables we’ve mentioned so far, you can also create a temporary managed table using the TEMP or TEMPORARY keyword. This table is saved in BigQuery storage and can be referenced for the duration of the script. Temporary tables can be a good alternative to WITH clauses because the defining query is only executed once as opposed to being inlined every place the alias is referenced.
| Original code | Optimized |
| with a as ( select …),b as ( select … from a …),c as ( select … from a …)select b.dim1, c.dim2from b, c; | create temp table a asselect …; with b as ( select … from a …),c as ( select … from a …)select b.dim1, c.dim2from b, c; |
It’s also important to mention that BigQuery writes all query results to a table – one either explicitly identified by the user or to a cached results table. Temporary, cached results tables are maintained per-user, per-project. There are no storage costs for temporary tables.
User defined functions & procedures
In BigQuery, a routine is either a user defined function (UDF) or a procedure. Routines allow you to re-use logic and handle your data in a unique way. A UDF is a function that is created using either SQL or Javascript, it takes arguments as input and returns a single value as an output. UDFs are often used for cleaning or re-formatting data. For example, extracting parameters from a URL string, restructuring nested data, or cleaning up strings:
# UDF to clean up string valuesCREATE OR REPLACE FUNCTIONmy_dataset.cleanse_string_test (text STRING)RETURNS STRINGAS (REGEXP_REPLACE(LOWER(TRIM(text)), '[^a-zA-Z0-9 ]+', ''));
We even have a community driven open-source repository of BigQuery UDFs! Just like logical views, you can create an authorized UDF that protects aspects of the underlying data. For more details on UDFs checkout our video here. You might also want to take a look at table functions – a preview feature where you can create a SQL UDF that returns a table instead of a scalar value.
Procedures, on the other hand, are blocks of SQL statements that can be called from other queries. Unlike UDFs, stored procedures can return multiple values or no values – which means you can run them to create or modify tables. In BigQuery, you can also leverage scripting capabilities within procedures to control execution flow with IF and WHILE statements. Plus, you can call your UDFs within your procedure! These aspects make procedures great for extract-load-transform (ELT) driven workflows.
# Procedure to create daily sales rollup, starting from startDate until endDateCREATE OR REPLACE PROCEDURE my_dataset.sum_sales(startDate STRING, endDate STRING)BEGINCREATE OR REPLACE TABLE retail.sales_resultAS (SELECTdate(t.transaction_timestamp) as date,sum(li.sale_price) as total_salesFROM retail.transaction_detail as tLEFT JOIN UNNEST(t.line_items) as liWHERE transaction_timestamp >= TIMESTAMP(startDate) AND transaction_timestamp <= TIMESTAMP(endDate)GROUP BY 1);END;CALL retail.sum_sales('2020-08-01', '2020-01-20');
To ensure consistent analytics across your organization, I recommend that you create a library dataset to house UDFs and procedures. You can easily grant everyone in your organization the BigQuery Data Viewer role to the library dataset so that all analysts use consistent and up-to-date logic in their queries.
Stay tuned!
We hope this gave you an understanding of how to leverage some of the different resources inside of a BigQuery dataset, and to help you make decisions like using native versus external storage, logical versus materialized views, and user defined functions or procedures.
Next up we’ll be talking about workload management in BigQuery by taking a look at jobs and the reservation model. Be sure to keep an eye out for more in this series by following me on LinkedIn and Twitter, and subscribing to our Youtube channel.
Groupe Dauphinoise Grows it Customer Base with G Suite and Google Cloud Platform

10394
Of your peers have already read this article.
2:45 Minutes
The most insightful time you'll spend today!
As a leading French agricultural cooperative, Groupe Dauphinoise places collaboration at the heart of its philosophy. Working with farmers in the Rhone-Alpes region, Groupe Dauphinoise takes on a diverse range of activities from agricultural production to research and development to running retail outlets.
As its operations expanded and strained its existing infrastructure, Groupe Dauphinoise saw the opportunity to upgrade its technology solutions and adopted G Suite, Chrome devices and ultimately Google Cloud Platform (GCP).
“We transitioned to G Suite to improve our staff’s collaboration. We quickly realized that as the company grew, we needed a new infrastructure. Based on our satisfaction with G Suite, we chose GCP. With Google, ‘any device, anytime, anywhere’ is not just a dream,” says Sylvain Claudel, Head of IT at Groupe Dauphinoise.
“We transitioned to G Suite to improve our staff’s collaboration. We quickly realized that as the company grew, we needed a new infrastructure. Based on our satisfaction with G Suite, we chose GCP. With Google, ‘any device, anytime, anywhere’ is not just a dream.”
—Sylvain Claudel, Head of IT, Groupe Dauphinoise
Flexible workforce, stable infrastructure
Many of Groupe Dauphinoise’s 1,500 employees spend their days out of the office. Five years ago, with the help of Google partner GoWizYou, the company transitioned to G Suite to improve the flexibility and collaboration of its staff.
As Groupe Dauphinoise began to expand and collect more data, the company reached the limits of its on-premise infrastructure. Adding new storage was not a simple matter. Acquiring, configuring and synchronising new servers costs Groupe Dauphinoise time as well as money. In addition, with all its servers stored in a single room, security was a concern. Groupe Dauphinoise needed a new infrastructure.
Google Cloud Platform was the only solution in mind after Groupe Dauphinoise’s experience with G Suite and Chromebooks. Disruption was kept to a minimum thanks to Google’s licensing agreements with Microsoft products, allowing the company to migrate without affecting its operations.
After migrating its infrastructure to Compute Engine, Groupe Dauphinoise can let Google look after the security and maintenance. Cloud IAM makes it easy for Groupe Dauphinoise to hand out permissions to sensitive resources across a number of sites with maximum security and minimum fuss. The company placed its archives in Cloud Storage, while Cloud SQL allows it to continue to make use of its MySQL databases without disrupting the day to day business. Meanwhile, BigQuery provides Groupe Dauphinoise with the raw power to analyse large datasets quickly.
“Our company is growing and we have more and more data to collect and analyze like sales data, weather patterns or production numbers. With GCP, we have more than a single on-premise data store, so our disaster recovery plan is much more flexible. Compute Engine allows us to add more storage quickly and easily, without having to spend days synchronizing data and installing new servers. We have improved security and maintained the stability of our infrastructure while keeping costs down,” says Sylvain.
Safeguarding the present, looking to the future
With Google Cloud Platform, Groupe Dauphinoise has expanded and secured its infrastructure without sinking costs into on-premise servers or DevOps staff. Its investment in Chrome devices and adoption of G Suite mean that its mobile workforce can fully reap the benefits of a cloud-based infrastructure while dramatically cutting the cost of hardware. Meanwhile, working with a 200 million line table of sales data in Google BigQuery, the cooperative found that queries ran ten times faster than with its previous database provider. Groupe Dauphinoise is experimenting with Google BigQuery to expand its BI capabilities. Products like Google BigQuery help Groupe Dauphinoise grow its business, safe in the knowledge that its infrastructure is stable and secure.
“The amount of data we collect is growing very quickly. We need to break our rules and evolve from the mindset that we had with on-premise infrastructure and our old databases. We can now look at collecting more customer fidelity data, or big data for our farmers. With our data and infrastructure in Google’s care, we can concentrate on growing our customer base instead of our IT department!” says Sylvain.
Why and How to Migrate to Google BigQuery

5377
Of your peers have already read this article.
6:30 Minutes
The most insightful time you'll spend today!
Over the past few decades, organizations have mastered the science of data warehousing. They have increasingly applied descriptive analytics to large quantities of stored data, gaining insight into their core business operations. Conventional Business Intelligence (BI), which focuses on querying, reporting, and Online Analytical Processing, might have been a differentiating factor in the past, either making or breaking a company, but it’s no longer sufficient.
Today, not only do organizations need to understand past events using descriptive analytics, they need predictive analytics, which often uses machine learning (ML) to extract data patterns and make probabilistic claims about the future. The ultimate goal is to develop prescriptive analytics that combine lessons from the past with predictions about the future to automatically guide real-time actions.
Traditional data warehouse practices capture raw data from various sources, which are often Online Transactional Processing (OLTP) systems. Then, a subset of data is extracted in batches, transformed based on a defined schema, and loaded into the data warehouse. Because traditional data warehouses capture a subset of data in batches and store data based on rigid schemas, they are unsuitable for handling real-time analysis or responding to spontaneous queries. Google designed BigQuery in part in response to these inherent limitations.
Innovative ideas are often slowed by the size and complexity of the IT organization that implements and maintains these traditional data warehouses. It can take years and substantial investment to build a scalable, highly available, and secure data warehouse architecture. BigQuery offers sophisticated software as a service (SaaS) technology that can be used for serverless data warehouse operations. This lets you focus on advancing your core business while delegating infrastructure maintenance and platform development to Google Cloud.
BigQuery offers access to structured data storage, processing, and analytics that’s scalable, flexible, and cost effective. These characteristics are essential when your data volumes are growing exponentially—to make storage and processing resources available as needed, as well as to get value from that data. Furthermore, for organizations that are just starting with big data analytics and machine learning, and that want to avoid the potential complexities of on-premises big data systems, BigQuery offers a pay-as-you-go way to experiment with managed services.
With BigQuery, you can find answers to previously intractable problems, apply machine learning to discover emerging data patterns, and test new hypotheses. As a result, you have timely insight into how your business is performing, which enables you to modify processes for better results. In addition, the end user’s experience is often enriched with relevant insights gleaned from big data analysis, as we explain later in this series.
The migration framework
Undertaking a migration can be a complex and lengthy endeavor. Therefore, we recommend adhering to a framework to organize and structure the migration work in phases:
- Prepare and discover: Prepare for your migration with workload and use case discovery.
- Assess and plan: Assess and prioritize use cases, define measures of success, and plan your migration.
- Execute: Iterate the following steps for each use case:
- Migrate (offload): Migrate only your data, schema, and downstream business applications.
- Migrate (full): Alternatively, migrate the use case fully end-to-end. The same as Migrate (offload), with the addition of the upstream data pipelines.
- Verify and validate: Test and validate the migration to assess return on investment.
The following diagram illustrates the recommended framework and shows how the different phases are connected:

For a deeper understanding, read Migrating data warehouses to BigQuery: Introduction and overview
How Vertex AI Helps Coca-Cola Bottlers Japan Analyze Billions of Data Records

6210
Of your peers have already read this article.
4:00 Minutes
The most insightful time you'll spend today!
Japan is home to millions of vending machines installed on streets and in buildings, sports stadiums and other facilities. Vending machine owners and operators, including beverage manufacturers, stock these machines with different product combinations depending on location and demand. For example, they primarily display coffee and energy drinks in machines placed in offices and sports drinks and mineral water in machines at sports facilities. The combinations also vary by season: for example, owners and operators may display cold beverages in summer and hot beverages in winter.
Traditionally, vending machine operators have relied on the intuition and experience of sales managers to determine the optimum product mix for each vending machine. However, in recent years, manufacturers such as Coca-Cola Bottlers Japan (CCBJ) have turned to data to analyze and make strategic decisions about when and where to locate products in machines.
CCBJ is the number one Coca-Cola bottler in Asia and vending machines comprise the bulk of its business. The organization operates about 700,000 machines across Tokyo, Osaka, Kyoto, and 35 prefectures. Minori Matsuda, Google Developer Expert and also Data Science Manager at CCBJ, says “The billions of data records collected from 700,000 physical devices are a great asset and a treasure trove we can take advantage of.”
Minori points out that when considering the mix of products in vending machines in sporting facilities, the managers naturally assume sports drinks would generally sell well. However, analysis of purchase data – including hot drinks and hot drinks plus sports drinks – found many parents purchased sweet drinks such as milk tea when they attended games or sessions involving their children. “Analyzing data gives us new discoveries and, by using catchy storytelling techniques from exploratory data analysis, we are instilling a data culture within our company,” he says. “It’s worth creating by looking at facts rather than making assumptions!”
Minori believes that to analyze the vast amount of data collected from more than 700,000 vending machines, the business needs a powerful analytical platform. However, until recently, CCBJ had to extract data for analysis from its core systems, load this data into a warehouse it created and perform the required analyses. The billions of records of data generated across the fleet – including transaction data – exposed some challenges for traditional analysis platforms. They could not efficiently process data at a considerable scale: it could take a day to return results and required extensive maintenance due to the size.
CCBJ considered building a machine learning (ML) platform as a layer on top of existing systems in August 2020 and opted for Google Cloud the following month. “I feel that Google Cloud has an edge in all products and is very well thought out,“ says Minori, noting the scalability and cost of the platform allow the business to take a ‘trial and error’ approach to achieve the best outcomes from ML. Google Cloud also delivered the required visibility and flexibility to help the business deliver change every day against key performance indicators.
MLOps platform streamlines ML pipeline development
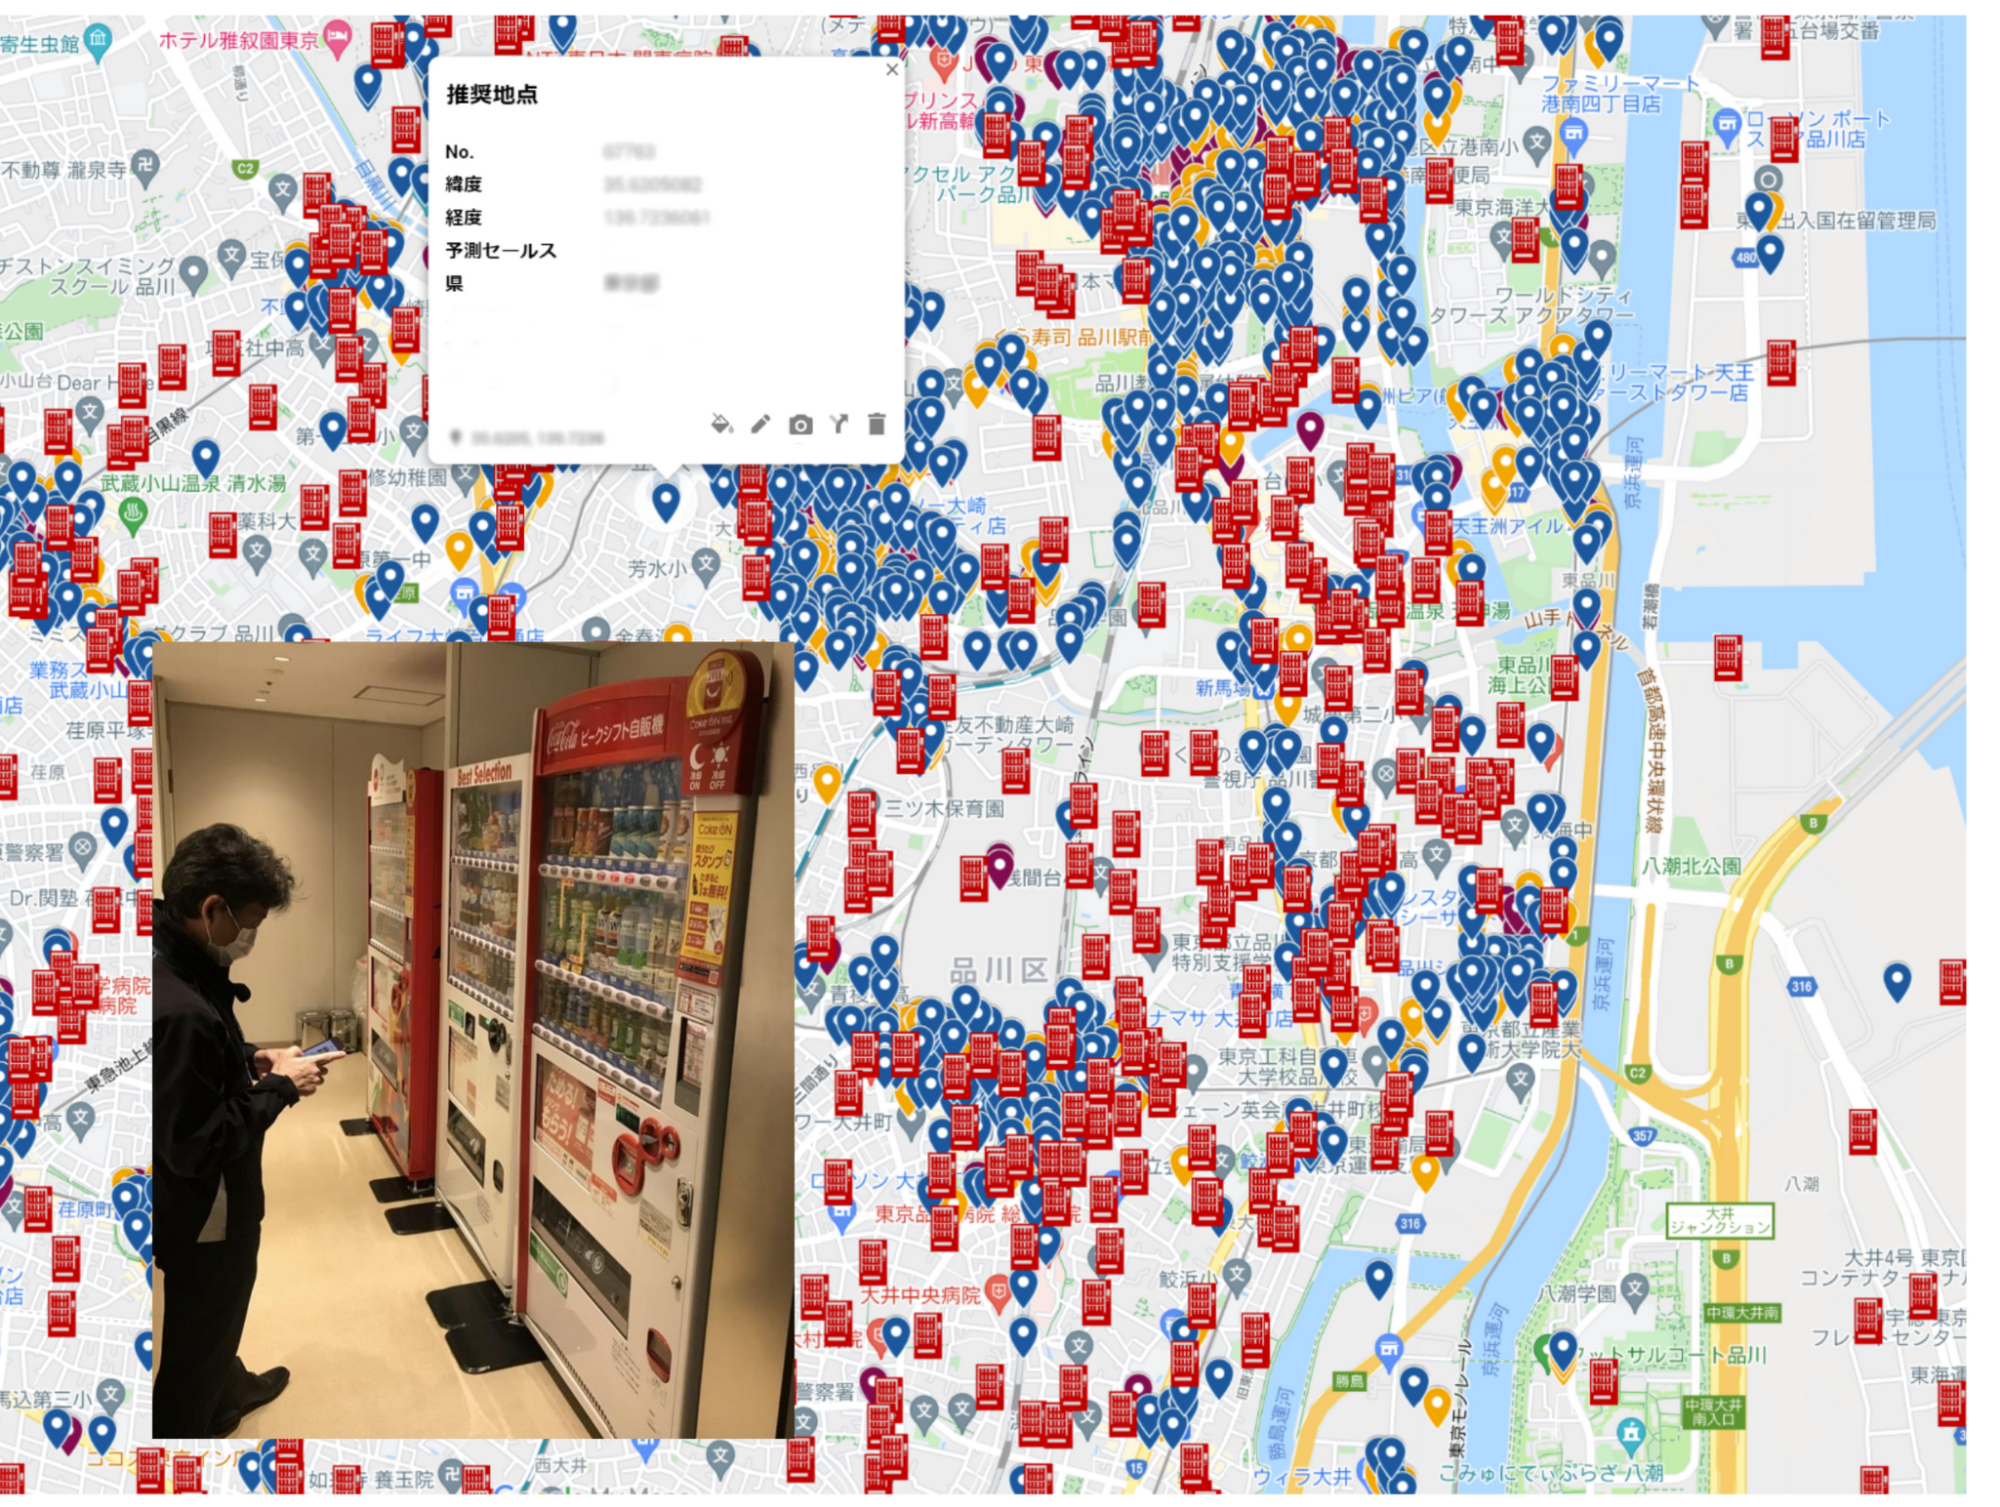
CCBJ built its analysis platform using Vertex AI (formerly AI Platform) centered on a BigQuery analytics data warehouse, and partly using AutoML for tabular data. “We have created a prediction model of where to place vending machines, what products are lined up in the machines and at what price, how much they will sell, and implemented a mechanism that can be analyzed on a map,” says Minori, adding that building the platform with Google Cloud was not difficult. “We were able to realize it in a short period of time with a sense of speed, from platform examination to introduction, prediction model training, on-site proof of concept to rollout.”
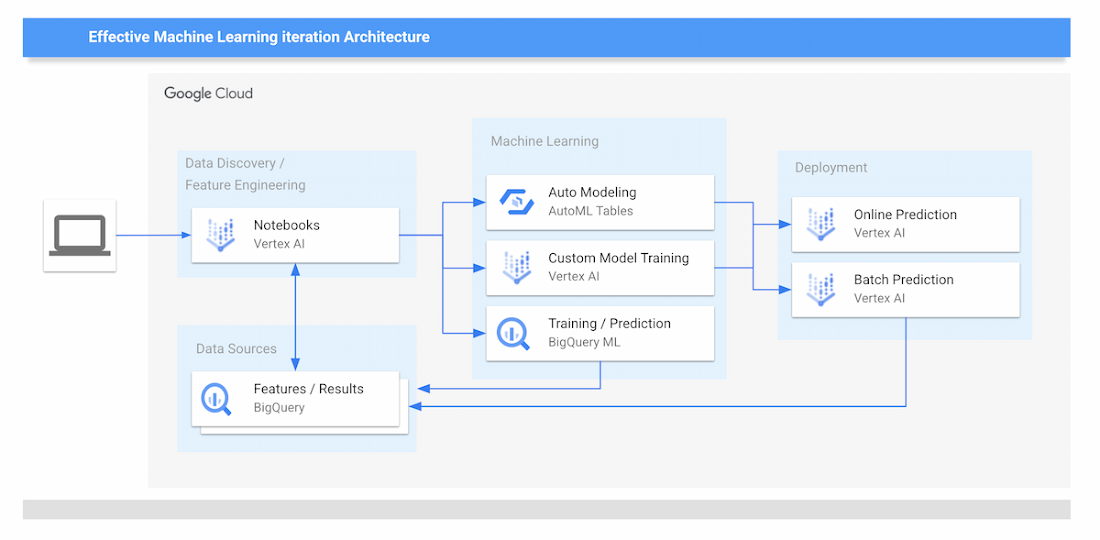
The new data analytics platform of CCBJ consists of the following parts:
Data Sources
- The data collected from the vending machines are all stored on BigQuery.
Data Discovery and Feature Engineering
- Minori and other data scientists at CCBJ are using Vertex Notebooks, where they access the data on BigQuery by executing SQL queries directly from the Notebooks. This environment is used for the data discovery process and feature engineering.
ML Training
- For ML training, CCBJ uses AutoML for Tabular data, Custom model training on Vertex AI, and BigQuery ML. AutoML gives model performance with AUC curves and also feature importance graphs.
ML Prediction and Serving
- For ML prediction, CCBJ uses Online Prediction for AutoML models and Online Prediction for custom models for real-time prediction when the salesperson finds the interesting point
- Batch Prediction is used for generating a large prediction map that covers the whole country
- The prediction results are distributed to sales managers’ tablets
CCBJ started constructing the platform in September 2020, and completed it within a month. The business has conducted proofs of concept at its base in Kyoto since February 2021, and since April, has rolled out the platform to sales managers in 35 prefectures in one metropolitan area. “Data analysis is built into the day-to-day routines of sales managers with 100% utilization,” says Minori. “They can utilize the prediction results on tablets that were able to achieve pretty high accuracy from the start.”
The hardest part was the education of sales managers in the field; having them understand the reasoning behind the ML prediction results for particular outcomes, so they could be convinced to make use of the results. “For example, regarding a new installation location predicted by the model, it seemed that there was no effective information for installation from the map information, but when I actually went there, there was a motorcycle shop and it was a place where young people who like motorcycles gathered,” says Minori. “Or there is a small meeting place where the elderly in the neighborhood are active.
“In many cases, new discoveries that cannot be understood from map information alone can be derived from the data.”
Minori also points to a phenomenon whereby humans pursued and confirmed factors inferred by the model – meaning that once they experienced analysis and it worked effectively, they asked why the same type of analysis or prediction could not be undertaken next time. The resulting cycle of more inquiries generated, more information gathered and more data captured for analysis meant the accuracy of results was improved.
Minori describes Vertex AI as having a number of strengths in helping CCBJ build a ML data analysis platform. “One of the major merits of Vertex AI was that we were able to realize MLOps that streamlines the entire development life cycle from construction of the ML pipeline to its execution,” he says.
With near real-time data analysis through Google Cloud, CCBJ teams can spend time developing strategies rather than waiting for data requested from the IT systems department. Exploratory data analysis is also considerably easier as repeated trial and error has greatly improved the accuracy of analyses. Before we used Machine Learning, most machine placement processes were done by human senses, by looking at a map to find the suggestion points. By using Machine Learning to generate a massive number of placement point suggestions, the efficiency of routing of salespeople has been dramatically improved.
In the future, CCBJ aims to automate the continuous training pipeline with Vertex AI. “CCBJ is a tech company that operates in the food industry,” says Minori. With the organization operating a vending machine network of 700,000 units, it would like to create new businesses based on utilization and analyzing data. Some of these businesses may be based on Sustainable Development Goals (SDGs) initiatives such as the utilization of recycled PET bottles, measures to prevent food loss and ways of using vending machines to contribute to local communities, which we have been working on for some time. It would be interesting if we could collaborate with Google Cloud on these in the future.”

More Relevant Stories for Your Company

IT Team Figures Out Easiest Way to Build Data Pipelines and Create ML Models
Building a strong brand in today's hyper-competitive business environment takes vision. It also requires a flexible, easily managed approach to digital asset management (DAM), so marketing professionals and other stakeholders can easily share, store, track, and manipulate assets to build the brand. Many of today's leading companies, including JetBlue, Slack,

Query Insights for Spanner: A blessing for developers and DBAs
Today, application development teams are more agile and are shipping features faster than ever before. In addition to these rapid development cycles and the rise of microservices architectures, the end-to-end ownership of feature development (and performance monitoring) has moved to a shared responsibility model between advanced database administrators and full-stack


Indian Retailer Figures Optimizes Hyperlocal Delivery to Increase Customer Experience
Anyone who follows the Indian e-commerce scene knows that one of the largest challenges these companies face is hyperlocal delivery. That was a problem facing Wellness Forever, a retail chain of pharmacies with 150-plus stores across India. “Exactly a year ago, we started our journey of hyperlocal deliveries. This optimization

Migrating Hadoop to Dataproc by LiveRamp: Best Practices
Abstract In this blog, we describe our journey to the cloud and share some lessons we learned along the way. Our hope is that you’ll find this information helpful as you go through the decision, execution, and completion of your own migration to the cloud. Introduction LiveRamp is a data
