





2878
Of your peers have already watched this video.
26:30 Minutes
The most insightful time you'll spend today!
How to Build a Data Pipeline Across Hybrid and Multi-region Infrastructures
Building a data pipeline on Google Cloud is one of the most common things enterprises do. Increasingly, organizations want to build these data pipelines across hybrid infrastructures.
Using Apache Kafka as a way to stream data across hybrid and multi-region infrastructures is a common pattern to create a consistent data fabric. Using Kafka and Confluent allows customers to integrate legacy systems and Google services like BigQuery and Dataflow in real time.
Learn how to build a robust, extensible data pipeline starting on-premises by streaming data from legacy systems into Kafka using the Kafka Connect framework.
This session highlights how to easily replicate streaming data from an on-premises Kafka cluster to Google Cloud Kafka cluster. Doing this integrates legacy applications and analytics in the cloud, using different Google services like AI Platform, AutoML, and BigQuery.
Home Depot’s Interconnected Retail Experience by Virtue of Google Cloud Migration for SAP Applications

8284
Of your peers have already read this article.
1:30 Minutes
The most insightful time you'll spend today!
With nearly 2,300 stores, The Home Depot is the world’s largest home-improvement chain — a brand that professional contractors and DIYers alike have come to depend on. The home improvement industry continues to experience unprecedented demand and dramatic increases in online ordering accompanied by expanding consumer expectations for things like curbside pickup and same day delivery. The Home Depot’s decision to migrate to cloud-based infrastructure, including the migration of the company’s SAP applications on Google Cloud which began in 2017, has set it up for success in an increasingly digital world, and helped the company adapt to changing market conditions quickly.
Interconnected retail at scale
Building on a strong customer-first philosophy, The Home Depot aims to create what it calls interconnected retail—allowing customers to shop however, whenever, and wherever they want. “So many companies are focused on omni-channel retail,” explains Sam Moses, Vice President of Corporate Systems. “At The Home Depot, we wanted to take it to the next level. Interconnected retail puts the customer at the center of everything and enables them to shop in store, online, or both. Customers can begin a transaction online and continue in-store, or vice-versa.”
To support this strategy, the company’s SAP environment needed to be more agile. Running everything on-premises, from central finance to POS systems, meant that The Home Depot’s IT teams experienced redundancy and repetitive, manual processes. Their data warehouse needed an upgrade to process and analyze growing and increasingly diverse data sets. The Home Depot chose to migrate its SAP environment to Google Cloud to support both the velocity and scale needed for the business as well as critical analytics capabilities needed for its bold digital initiatives. “We chose Google Cloud to support our SAP implementation. Our decision had a lot to do with the relationship between Google Cloud and SAP and also for the applications and services that are offered by Google Cloud, like BigQuery, which are helping to enable data and analytics within our organization,” Moses explains.
After migrating its SAP applications—including S/4HANA, its customer activity repository (CAR), general ledger, e-commerce system, enterprise data warehouse and more to Google Cloud, the company now has the speed, scale and flexibility to tackle enormous spikes in the business, all while staying fully available for their customers. Additionally, The Home Depot was able to transform its financial systems and make them more agile to deliver critical information across multiple business functions in real time.
Maximizing data insights to support customer experiences
By migrating to Google Cloud, The Home Depot is leveraging Google Cloud analytics to build the industry’s most efficient supply chain including more robust demand forecasting, supplier lead times, estimated delivery times and more, all while maintaining better security than before. “We experienced unprecedented change in our customers’ behavior and their buying patterns, which puts a lot of pressure on our supply chain,” explains Moses. “So having the ability to leverage data and analytics gives us insights to know exactly what it is that our customers need.”
The company’s analysts now use BigQuery ML for machine learning directly against the company’s BigQuery data and use AutoML to determine the best model for predictions. The Home Depot’s engineers have also adapted BigQuery to monitor, analyze, and act on application performance data across all its stores and warehouses in real time—capabilities that were not as seamless in the on-premises environment.
With hundreds of projects on Google Cloud, The Home Depot’s cloud journey is well on track, but the company is always looking to the future. “As our customers’ needs have continued to evolve, and as technology has continued to evolve, our relationship with Google will continue to advance — to be able to innovate together, to be able to find new solutions together, to better serve our customers.”
Learn more about how The Home Depot is renovating its retail operation with SAP on Google Cloud.
How to Enhance Incremental Pipeline Performance while Ingesting Data into BigQuery

6334
Of your peers have already read this article.
3:00 Minutes
The most insightful time you'll spend today!
When you build a data warehouse, the important question is how to ingest data from the source system to the data warehouse. If the table is small you can fully reload a table on a regular basis, however, if the table is large a common technique is to perform incremental table updates. This post demonstrates how you can enhance incremental pipeline performance when you ingest data into BigQuery.
Setting up a standard incremental data ingestion pipeline
We will use the below example to illustrate a common ingestion pipeline that incrementally updates a data warehouse table. Let’s say that you ingest data into BigQuery from a large and frequently updated table in the source system, and you have Staging and Reporting areas (datasets) in BigQuery.

The Reporting area in BigQuery stores the most recent, full data that has been ingested from the source system tables. Usually you create the base table as a full snapshot of the source system table. In our running example, we use BigQuery public data as the source system and create reporting.base_table as shown below. In our example each row is identified by a unique key which consists of two columns: block_hash and log_index.
CREATE TABLE reporting.base_table --156 GB processedPARTITION BY TIMESTAMP_TRUNC(block_timestamp, DAY) ASSELECT log_index, data, topics, block_timestamp, block_hashFROM bigquery-public-data.crypto_ethereum.logsWHERE block_timestamp BETWEEN TIMESTAMP '2020-01-01' AND TIMESTAMP '2020-11-30';
In data warehouses it is common to partition a large base table by a datetime column that has a business meaning. For example, it may be a transaction timestamp, or datetime when some business event happened, etc. The idea is that data analysts who use the data warehouse usually need to analyze only some range of dates and rarely need the full data. In our example, we partition the base table by block_timestamp which comes from the source system.
After ingesting the initial snapshot you need to capture changes that happen in the source system table and update the reporting base table accordingly. This is when the Staging area comes into the picture. The staging table will contain captured data changes that you will merge into the base table. Let’s say that in our source system on a regular basis we have a set of new rows and also some updated records. In our example we mock the staging data as follows: first, we create new data, than we mock the updated records:
CREATE TABLE staging.load_delta AS --5 GB processedSELECT log_index, data, topics, block_timestamp, block_hashFROM bigquery-public-data.crypto_ethereum.logsWHERE block_timestamp BETWEEN TIMESTAMP '2020-12-01' AND TIMESTAMP '2020-12-07';INSERT INTO staging.load_delta --2 GB processedSELECT log_index, CONCAT(data, RAND()), topics, block_timestamp, block_hashFROM bigquery-public-data.crypto_ethereum.logs TABLESAMPLE SYSTEM (5 PERCENT)WHERE block_timestamp BETWEEN TIMESTAMP '2020-10-01' AND TIMESTAMP '2020-11-30';
Next, the pipeline merges the staging data into the base table. It joins two tables by unique key and than updates the changed value or inserts a new row
MERGE INTO reporting.base_table T --161 GB processedUSING staging.load_delta SON T.block_hash = S.block_hashAND T.log_index = S.log_indexWHEN MATCHED THEN UPDATE SETT.data = S.dataWHEN NOT MATCHED THEN INSERT (log_index, data, topics, block_timestamp, block_hash)VALUES (log_index, data, topics, block_timestamp, block_hash);
It is often the case that the staging table contains keys from various partitions but the number of those partitions are relatively small. It holds, for instance, because in the source system the recently added data may get changed due to some initial errors or ongoing processes but older records are rarely updated. However, when the above MERGE gets executed, BigQuery scans all partitions in the base table and processes 161 GB of data. You might add additional join condition on block_timestamp:
MERGE INTO reporting.base_table T --161 GB processedUSING staging.load_delta SON T.block_hash = S.block_hashAND T.log_index = S.log_indexAND T.block_timestamp = S.block_timestampWHEN MATCHED THEN UPDATE SETT.data = S.dataWHEN NOT MATCHED THEN INSERT (log_index, data, topics, block_timestamp, block_hash)VALUES (log_index, data, topics, block_timestamp, block_hash);
But BigQuery would still scan all partitions in the base table because condition T.block_timestamp = S.block_timestamp is a dynamic predicate and BigQuery doesn’t automatically push such predicates down from one table to another in MERGE.
Can you improve the MERGE efficiency by making it scan less data? The answer is Yes.
As described in the MERGE documentation, pruning conditions may be located in a subquery filter, a merge_condition filter, or a search_condition filter. In this post we show how you can leverage the first two. The main idea is to turn a dynamic predicate into a static predicate.
Steps to enhance your ingestion pipeline
The initial step is to compute the range of partitions that will be updated during the MERGE and store it in a variable. As was mentioned above, in data ingestion pipelines, staging tables are usually small so the cost of the computation is relatively low.
DECLARE src_range STRUCT<date_min TIMESTAMP, date_max TIMESTAMP> --115 MB processedDEFAULT(SELECT STRUCT(MIN(block_timestamp) AS date_min,MAX(block_timestamp) AS date_max) FROM staging.load_delta);
Based on your existing ETL/ELT pipeline, you can add the above code as-is to your pipeline or you can compute date_min, data_max as part of some already existing transformation step. Alternatively, date_min, data_max can be computed on the Source System side while capturing the next ingestion data batch.
After computing date_min, date_max you pass those values to the MERGE statement as static predicates. There are several ways to enhance the MERGE and prune partitions in the base table based on precomputed date_min, data_max.
If your initial MERGE statement uses a subquery, you can incorporate a new filter into it:
BEGINDECLARE src_range STRUCT<date_min TIMESTAMP, date_max TIMESTAMP> --115 MB processedDEFAULT(SELECT STRUCT(MIN(block_timestamp) AS date_min,MAX(block_timestamp) AS date_max) FROM staging.load_delta);MERGE INTO reporting.base_table T --41 GB processedUSING (SELECT *FROM staging.load_deltaWHERE block_timestamp BETWEEN src_range.date_min AND src_range.date_max) SON T.block_hash = S.block_hashAND T.log_index = S.log_indexAND T.block_timestamp = S.block_timestampWHEN MATCHED THEN UPDATE SETT.data = S.dataWHEN NOT MATCHED THEN INSERT (log_index, data, topics, block_timestamp, block_hash)VALUES (log_index, data, topics, block_timestamp, block_hash);END;
Note that you add the static filter to the staging table and keep T.block_timestamp = S.block_timestamp to convey to BigQuery that it can push that filter to the base table. This MERGE processes 41 GB of data in contrast to the initial 161 GB. You can see in the query plan that BigQuery pushes the partition filter from the staging table to the base table:
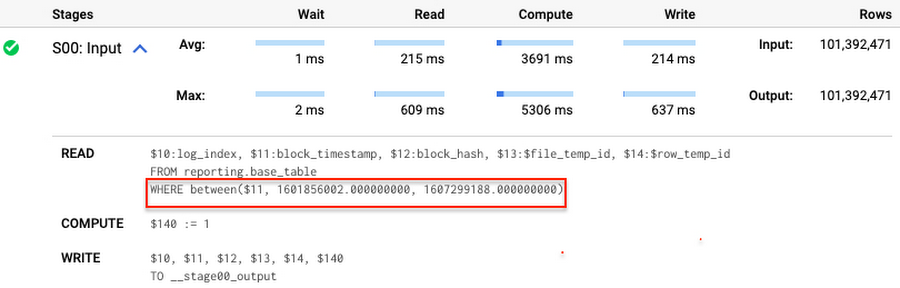
This type of optimization, when a pruning condition is pushed from a subquery to a large partitioned or clustered table, is not unique for MERGE. It also works for other types of queries. For instance:
SELECT * -- 41 GB processedFROM reporting.base_table TINNER JOIN staging.load_delta SON T.block_hash = S.block_hashAND T.log_index = S.log_indexAND T.block_timestamp = S.block_timestampWHERE S.block_timestamp BETWEEN TIMESTAMP '2020-10-05' AND TIMESTAMP '2020-12-07'
And you can check the query plan to verify that BigQuery pushed down the partition filter from one table to another.
Moreover, for SELECT statements, BigQuery can automatically infer a filter predicate on a join column and push it down from one table to another if your query meets the following criteria:
- The target table must be clustered or partitioned.
- The result size of the other table, i.e. after applying all filters, must qualify for broadcast join. Namly, the result set must be relatively small, less than ~100MB.
In our running example, reporting.base_table is partitioned by block_timestamp. If you define a selective filter on staging.load_delta and join two tables, you can see an inferred filter on the join key pushed to the target table
SELECT *FROM reporting.base_table TINNER JOIN staging.load_delta SON T.block_timestamp = S.block_timestampWHERE S.block_hash = '0x0c1caa16b34d94843aabfebc0d5a961db358135988f7498a6fdc450ad55f0870'
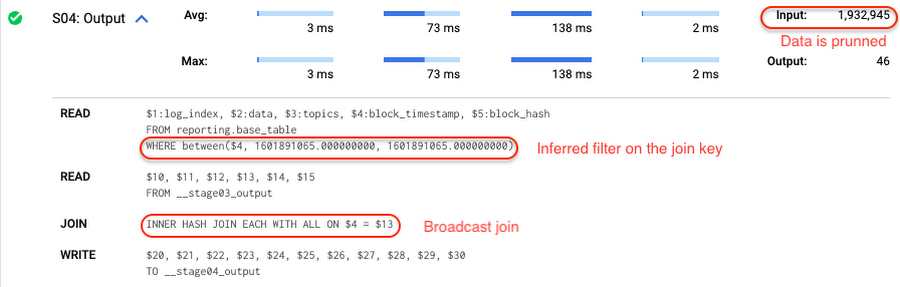
There is no requirement to join tables by partitioning or clustering key to kick off this type of optimization. However, in this case the pruning effect on the target table would be less significant.
But let us get back to the pipeline optimizations. Another way to enhance MERGE is to modify the merge_condition filter by adding static predicate on the base table:
BEGINDECLARE src_range STRUCT<date_min TIMESTAMP, date_max TIMESTAMP> --115 MB processedDEFAULT(SELECT STRUCT(MIN(block_timestamp) AS date_min,MAX(block_timestamp) AS date_max) FROM staging.load_delta);MERGE INTO reporting.base_table T --41 GB processedUSING staging.load_delta SON T.block_hash = S.block_hashAND T.log_index = S.log_indexAND T.block_timestamp BETWEEN src_range.date_min AND src_range.date_maxWHEN MATCHED THEN UPDATE SETT.data = S.dataWHEN NOT MATCHED THEN INSERT (log_index, data, topics, block_timestamp, block_hash)VALUES (log_index, data, topics, block_timestamp, block_hash);END;
To summarize, here are the steps that you can perform to enhance incremental ingestion pipelines in BigQuery. First you compute the range of updated partitions based on the small staging table. Next, you tweak the MERGE statement a bit to let BigQuery know to prune data in the base table.
All the enhanced MERGE statements scanned 41 GB of data, and setting up the src_range variable took 115 MB. Compare it with the initial 161 GB scan. Moreover, given that computing src_range may be incorporated into some existing transformation in your ETL/ELT, it results in a good performance improvement which you can leverage in your pipelines.
In this post we described how to enhance data ingestion pipelines by turning dynamic filter predicates into static predicates and letting BiQuery prune data for us. You can find more tips on BigQuery DML tuning here.
Special thanks to Daniel De Leo, who helped with examples and provided valuable feedback on this content.
Geospatial Data for Business Apps Drive Sustainable and Accurate Decision-making

4361
Of your peers have already read this article.
1:30 Minutes
The most insightful time you'll spend today!
Organizations that collect geospatial data can use that information to understand their operations, help make better business decisions, and power innovation. Traditionally, organizations have required deep GIS expertise and tooling in order to deliver geospatial insights. In this post, we outline some ways that geospatial data can be used in various business applications.
Assessing environmental risk
Governments and businesses involved in insurance underwriting, property management, agriculture technology, and related areas are increasingly concerned with risks posed by environmental conditions. Historical models that predict natural disasters like pollution, flooding, and wildfires are becoming less accurate as real-world conditions change. Therefore, organizations are incorporating real-time and historical data into a geospatial analytics platform and using predictive modeling to more effectively plan for risk and to forecast weather.
Selecting sites and planning expansion
Businesses that have storefronts, such as retailers and restaurants, can find the best locations for their stores by using geospatial data like population density to simulate new locations and to predict financial outcomes. Telecom providers can use geospatial data in a similar way to determine the optimal locations for cell towers. A site selection solution can combine proprietary site metrics with publicly-available data like traffic patterns and geographic mobility to help organizations make better decisions about site selection, site rationalization, and expansion strategy.
Planning logistics and transport
For freight companies, courier services, ride-hailing services, and other companies that manage fleets, it’s critical to incorporate geospatial context into business decision-making. Fleet management operations include optimizing last-mile logistics, analyzing telematics data from vehicles for self-driving cars, managing precision railroading, and improving mobility planning. Managing all of these operations relies extensively on geospatial context. Organizations can create a digital twin of their supply chain that includes geospatial data to mitigate supply chain risk, design for sustainability, and minimize their carbon footprint.
Understanding and improving soil health and yield
AgTech companies and other organizations that practice precision agriculture can use a scalable analytics platform to analyze millions of acres of land. These insights help organizations understand soil characteristics and help them analyze the interactions among variables that affect crop production. Companies can load topography data, climate data, soil biomass data, and other contextual data from public data sources. They can then combine this information with data about local conditions to make better planting and land-management decisions. Mapping this information using geospatial analytics not only lets organizations actively monitor crop health and manage crops, but it can help farmers determine the most suitable land for a given crop and to assess risk from weather conditions.
Managing sustainable development
Geospatial data can help organizations map economic, environmental, and social conditions to better understand the geographies in which they conduct business. By taking into account environmental and socio-economic phenomena like poverty, pollution, and vulnerable populations, organizations can determine focus areas for protecting and preserving the environment, such as reducing deforestation and soil erosion. Similarly, geospatial data can help organizations design data-driven health and safety interventions. Geospatial analytics can also help an organization meet its commitments to sustainability standards through sustainable and ethical sourcing. Using geospatial analytics, organizations can track, monitor, and optimize the end-to-end supply chain from the source of raw materials to the destination of the final product.
What’s next
Google Cloud provides a full suite of geospatial analytics and machine learning capabilities that can help you make more accurate and sustainable business decisions without the complexity and expense of managing traditional GIS infrastructure. Get started today by learning how you can use Google Cloud features to get insights from your geospatial data, see Geospatial analytics architecture.
Acknowledgements: We’d like to thank Chad Jennings, Lak Lakshmanan, Kannappan Sirchabesan, Mike Pope, and Michael Hao for their contributions to this blog post and the Geospatial Analytics architecture.
3428
Of your peers have already watched this video.
19:30 Minutes
The most insightful time you'll spend today!
Data vs. COVID-19: How public data is helping flatten the curve
The outbreak of COVID-19 has changed the reality of millions of lives around the world. Communities around the world began social distancing, events were cancelled, and healthcare efforts redirected to fight the pandemic.
Hear how public data and the Google Cloud COVID-19 Public Datasets Program is helping combat the pandemic and informing individual decision-making to help everyone make informed decisions about the spread and risks of the virus, and how cooperative efforts could help flatten the curve.
In this presentation, Javier de la Torre, Founder and Chief Strategy Officer of Carto, and Shane Glass, Developer Advocate, Google Cloud demonstrate how the Carto platform is contributing to spatial analysis and understanding for how the outbreak evolved over time as government policies and social distancing measures were put into place.
They also show how to access these public datasets, what is included in the COVID-19 Public Datasets Program, and how you can use these datasets to develop maps and dashboards that will help us continue to combat the pandemic.
Serverless and BigQuery Together on Google Cloud: Behind the L’Oreal Beauty Tech Data Platform

5356
Of your peers have already read this article.
4:00 Minutes
The most insightful time you'll spend today!
Editor’s note: In Today’s guest post we hear from beauty leader L’Oréal about their approach to building a modern data platform on fully managed services: managing the ingest of diverse datasets into BigQuery with Cloud Run, and orchestrating transformations into relevant business domain representations for stakeholders across the organization. Learn more about how businesses have benefited from Cloud Run in Forrester’s report on Total Economic Impact.
L’Oréal was born out of science. For over 100 years, we have always shaped the future of beauty, and taken its eternal quest to new horizons. This has earned us our current position as the world’s uncontested beauty leader (~€ 32 B annual sales in 2021), present in 150 countries with over 85,000 employees.
Today, with the power of our game-changing science, multiplied by cutting-edge technologies, we continue our lifelong journey of shaping the future of beauty.
As a Beauty Tech company, we leverage our decades-long heritage of rich data assets to empower our decision-making with instant, sophisticated analysis.
Because we oversee global brands, which must adapt to local requirements, we need to maintain a deep understanding of what a brands’ data represents, while managing disparate legal and regulatory requirements for different countries. Our end goal is to run a safe, compliant and sustainable data warehouse as efficiently and effectively as possible.
We sync and aggregate internal and external data from a wide variety of sources across organizations and retail stores. This made the management of our data warehouse infrastructure used to be very complex and hard to manage before Google Cloud. L’Oréal’s footprint was so large that we once found it impossible to have a standardized method to handle data. Every process was vendor-specific, and the infrastructure was brittle. We went looking for a solution to our complex data infrastructure needs, and defined the following non-negotiable principles:
- No Ops: The job of a developer at L’Oréal is not to manage servers. We need an elastic infrastructure that scales on demand, so that our developers can focus on delivering customized and inclusive beauty experiences to all consumers, rather than focusing on managing servers.
- Secure: We have strict security and compliance requirements which vary by country, and we employ a zero-trust security strategy. We must keep both our own internal data and customer data safe and encrypted.
- Sustainable : Our data lives in multiple environments, including on-prem data centers and public cloud services. We must be able to securely access and analyze this data while minimizing the complexity and environmental impact of moving and duplicating data.
- End-to-end supervision: Because developers shouldn’t be managing servers, we need a “single pane of glass” dashboard to monitor and triage the system if something goes wrong.
- Easy-to-deploy: Deploying code safely should not compromise velocity. We are constantly developing innovations that push the boundaries of science and reinvent beauty rituals. We need integrated tools to make our code deployment process seamless and safe.
- Event-driven architecture: Our data is used globally by research, product, business and engineering teams with high expectations on data quality and timeliness. Many of our internal processes and analysis are based on near real-time data.
- Data products delivered “as a service”: We want to empower our employees to drive business value at record speed. To that end, we need solutions that enable us to remove the developers from the critical path of solution delivery as much as possible.
- Extract-load-transform (ELT): Our goal is to implement the pattern to load data as soon as possible into the data warehouse to take advantage of SQL transformations.
After considering multiple vendors on the market, with these principles in mind, we landed on end-to-end Google Cloud serverless and data tooling. We were already using Google Cloud for a few processes, including BigQuery, and loved the experience.
We’ve now expanded our use of Google Cloud to fully support the L’Oréal Beauty Tech Data Platform.
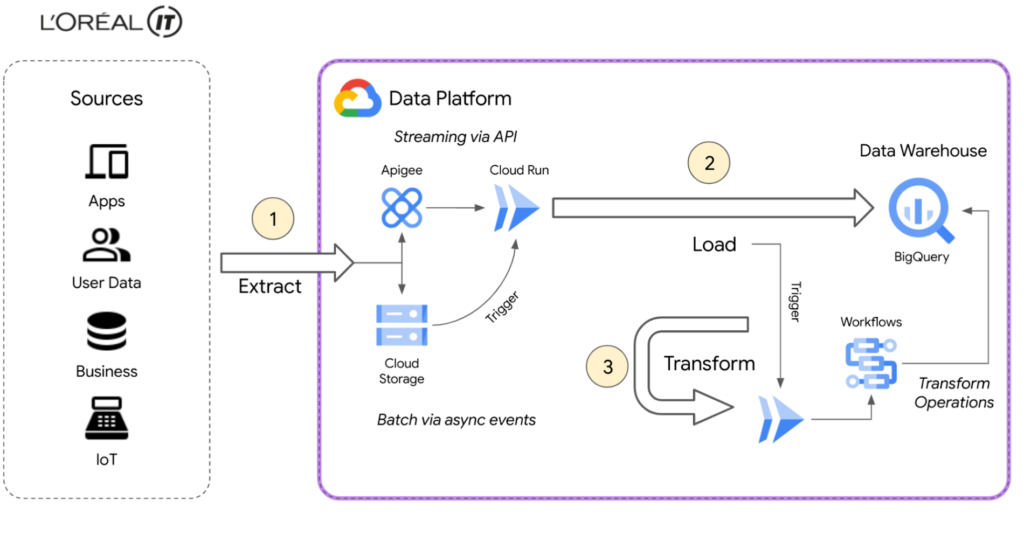
L’Oréal’s Beauty Tech Data Platform incorporates data from two types of sources: directly via API, which is data that adapts easily to our schema and is inserted directly into BigQuery, and bulk data from integrations, which require event-driven transformations using Eventarc mechanisms. These transformations are performed in Cloud Run and Cloud Functions (2nd gen), or directly in SQL. With Google Cloud, we can adapt very quickly.
Today, we currently have 8500 flows for ~5000 users using the native zero-trust capabilities offered by Google Cloud. Indeed, the flows come from Google Cloud and other third-party services.
BigQuery enabled us to adopt standard SQL as our universal language in our data warehouse and meet all expectations for queries and reporting. We were also able to load original data using features like federated queries, and efficiently transitioned from ETL to ELT data ingestion by handling semi-structured data with SQL. This approach of loading original data from sources into BigQuery with non-destructive transformations allows us to reprocess data for new use-cases easily, directly within BigQuery.
Our applications are hosted on multiple environments – on-premises, in Google Cloud, and in other public clouds. This made it difficult for our data engineers and analysts to natively analyze data across clouds until we started using BigQuery Omni. This capability of BigQuery allowed us to globally access and analyze data across clouds through a single pane of glass using the native BigQuery user interface itself. Without BigQuery Omni, it would’ve been impossible for our teams to natively do cross-cloud analytics. Moreover, it eliminated the need for us to move sensitive data, which is not only expensive because of local tax and subsea transport, but also incredibly risky – sometimes even forbidden – because of local regulations.
Today Google Cloud powers our Beauty Tech Data Platform, which stores 100TB of production data in BigQuery and processes 20TB of data each month. We have more than 8000 governed datasets, and 2 millions of BigQuery tables coming from multiple data sources such as Salesforce, SAP, Microsoft, and Google Ads.
For more complex transformations where custom and specific libraries are required, Cloud Workflows help us to manage the complexity very efficiently by orchestrating steps in containers through Cloud Run, Cloud Functions and even BigQuery jobs — the most used way to transform and add value to the L’Oréal data.
Additionally, by using BigQuery and Google Cloud’s serverless compute for API ingestion, bulk data loading, and post-loading transformations, we can keep the entire system in a single boundary of trust at a fraction of the cost. With ingest, queries, and transformations all being fully elastic and on-demand, we no longer have to perform capacity planning for either the compute or analytics components of the system. And of course these services’ pay-as-you-go model perfectly aligns with L’Oréal’s strategy of only paying for something when you use it.
Google Cloud fulfilled the requirements of our Beauty Tech Data Platform. And as if offering us a no-ops, secure, easy-to-deploy, custom-development free, event-based platform with end-to-end supervision wasn’t enough, Google Cloud also helped us with our sustainability efforts.
Being able to measure and understand the environmental footprint of our public cloud usage is also a key part of our sustainable tech roadmap. With Google Cloud Carbon Footprint, we can easily see the impact of our sustainable infrastructure approach and architecture principles. Our Beauty Tech platform is a strategic ambition for L’Oréal: inventing the beauty products of the future while becoming the company of the future.
Sustainable tech is an imperative and a very important step towards this ambition of creating responsible beauty for our consumers, and sustainable-by-design tech services for our employees. We all have a role to play, and by joining forces, we can have a positive impact.
Google Cloud’s data ecosystem and serverless tools are highly complementary, and made it possible to build a next-generation data analytics platform that met all our needs.
Get started using serverless and BigQuery together on Google Cloud today.
More Relevant Stories for Your Company

ESG Report: Economic Advantages of Google BigQuery OnDemand Serverless Analytics
Traditional big data solutions require a significant upfront investment, ongoing maintenance of hardware and software, and manual provisioning to match compute and storage resources with demand. Google’s serverless analytics warehouse does away with all that extra work, helping businesses focus on what matters most: getting value from their data. Enterprise

Vector Search: The Tech Powering Billions of Search Results for Google Users
Recently, Google Cloud partner Groovenauts, Inc. published a live demo of MatchIt Fast. As the demo shows, you can find images and text similar to a selected sample from a collection of millions in a matter of milliseconds: Image similarity search with MatchIt Fast Give it a try — and either select a preset

Post-COVID: Times Driven by Data Analytics and Intelligence
As we think about economic recovery from COVID-19—both inside Google and outside through working with Google Cloud customers—we’ve made many important observations. Among them is the recognition that the ways software developers and IT practitioners work together will shift in the post COVID-19 world. Our economic recovery today will look

How Can an IT Manager Get into the Machine Learning Game?
It’s a rare technology forecast that doesn’t include machine learning and AI. But for IT managers these technologies can seem like a world away. This can be worrying for many IT managers who feel like they are being left out of the future. It needn’t be this way. One of
