





3373
Of your peers have already watched this video.
16:30 Minutes
The most insightful time you'll spend today!
Scaling Data-Driven Insights Across a Complex Global Organization with Looker and BigQuery
In this video, SpringML and Iron Mountain share how migrating data to Google Cloud not only saved hundreds of thousands of dollars in licensing consolidation but allows stakeholders across a complex global organization to:
- Consolidate 1,200 data management applications into one data lake
- Unify information governance practices across disparate corporate verticals and departments
- Provide a single view of operational and customer data for enhanced decision making across 43 countries and 200 acquisitions
- Unlock the power of data science and predictive analytics
Standardizing across varying systems and processes onto one platform took just a matter of weeks for a project that could have taken about a year.
SpringML and Iron Mountain share how this was done, lessons learned and next steps for their collaboration adopting Looker and BigQuery into Iron Mountain.
10534
Of your peers have already watched this video.
2:15 Minutes
The most insightful time you'll spend today!
The True Story of How HotStar Broke a World-Record–Thanks to Firebase and Google BigQuery
Hotstar, India’s largest video streaming platform with 150 million monthly active users around the world, provides live-streaming of TV shows, movies, sports, and news on the go.
By using a combination of Firebase products together, Hotstar safely rolled out new features to its watch screen during a major live-streaming event without disrupting users, sacrificing stability, or releasing a new build. They also used Firebase with BigQuery to analyze their event data and reduce app startup time.
“We have an ambitious mission, but our engineering team is only a fraction of the size of most of our competitors. But we are still keeping up, and we are doing it with the help of Firebase,” says Ayushi Gupta, Android Engineer, Hotstar.
New Capabilities in BigQuery to Ease Anomalies Detection in the Absence of Labeled Data

6344
Of your peers have already read this article.
4:00 Minutes
The most insightful time you'll spend today!
When it comes to anomaly detection, one of the key challenges that many organizations face is that it can be difficult to know how to define what an anomaly is. How do you define and anticipate unusual network intrusions, manufacturing defects, or insurance fraud? If you have labeled data with known anomalies, then you can choose from a variety of supervised machine learning model types that are already supported in BigQuery ML. But what can you do if you don’t know what kind of anomaly to expect, and you don’t have labeled data? Unlike typical predictive techniques that leverage supervised learning, organizations may need to be able to detect anomalies in the absence of labeled data.
Today we are announcing the public preview of new anomaly detection capabilities in BigQuery ML that leverage unsupervised machine learning to help you detect anomalies without needing labeled data. Depending on whether or not the training data is time series, users can now detect anomalies in training data or on new input data using a new ML.DETECT_ANOMALIES function (documentation), with the following models:
- Autoencoder model, now in Public Preview (documentation)
- K-means model, already GA (documentation)
- ARIMA_PLUS time series model, already GA (documentation)
How does anomaly detection with ML.DETECT_ANOMALIES work?
To detect anomalies in non-time-series data, you can use:
- K-means clustering models: When you use
ML.DETECT_ANOMALIESwith a k-means model, anomalies are identified based on the value of each input data point’s normalized distance to its nearest cluster. If that distance exceeds a threshold determined by the contamination value provided by the user, the data point is identified as an anomaly. - Autoencoder models: When you use
ML.DETECT_ANOMALIESwith an autoencoder model, anomalies are identified based on the reconstruction error for each data point. If the error exceeds a threshold determined by the contamination value, it is identified as an anomaly.
To detect anomalies in time-series data, you can use:
- ARIMA_PLUS time series models: When you use
ML.DETECT_ANOMALIESwith an ARIMA_PLUS model, anomalies are identified based on the confidence interval for that timestamp. If the probability that the data point at that timestamp occurs outside of the prediction interval exceeds a probability threshold provided by the user, the datapoint is identified as an anomaly.
Below we show code examples of anomaly detection in BigQuery ML for each of the above scenarios.
Anomaly detection with a k-means clustering model
You can now detect anomalies using k-means clustering models, by running ML.DETECT_ANOMALIES to detect anomalies in the training data or in new input data. Begin by creating a k-means clustering model:
Language: SQL
CREATE MODEL `mydataset.my_kmeans_model`OPTIONS(MODEL_TYPE = 'kmeans',NUM_CLUSTERS = 8,KMEANS_INIT_METHOD = 'kmeans++') ASSELECT* EXCEPT(Time, Class)FROM`bigquery-public-data.ml_datasets.ulb_fraud_detection`;
With the k-means clustering model trained, you can now run ML.DETECT_ANOMALIES to detect anomalies in the training data or in new input data.
To detect anomalies in the training data, use ML.DETECT_ANOMALIES with the same data used during training:
Language: SQL
SELECT*FROMML.DETECT_ANOMALIES(MODEL `mydataset.my_kmeans_model`,STRUCT(0.02 AS contamination),TABLE `bigquery-public-data.ml_datasets.ulb_fraud_detection`);

To detect anomalies in new data, use ML.DETECT_ANOMALIES and provide new data as input:
Language: SQL
SELECT*FROMML.DETECT_ANOMALIES(MODEL `mydataset.my_kmeans_model`,STRUCT(0.02 AS contamination),(SELECT * FROM `mydataset.newdata`));

How does anomaly detection work for k-means clustering models?
Anomalies are identified based on the value of each input data point’s normalized distance to its nearest cluster, which, if exceeds a threshold determined by the contamination value, is identified as an anomaly. How does this work exactly? With a k-means model and data as inputs, ML.DETECT_ANOMALIES first computes the absolute distance for each input data point to all cluster centroids in the model, then normalizes each distance by the respective cluster radius (which is defined as the standard deviation of the absolute distances of all points in this cluster to the centroid). For each data point, ML.DETECT_ANOMALIES returns the nearest centroid_id based on normalized_distance, as seen in the screenshot above. The contamination value, specified by the user, determines the threshold of whether a data point is considered an anomaly. For example, a contamination value of 0.1 means that the top 10% of descending normalized distance from the training data will be used as the cut-off threshold. If the normalized distance for a datapoint exceeds the threshold, then it is identified as an anomaly. Setting an appropriate contamination will be highly dependent on the requirements of the user or business.
For more information on anomaly detection with k-means clustering, please see the documentation here.
Anomaly detection with an autoencoder model
You can now detect anomalies using autoencoder models, by running ML.DETECT_ANOMALIES to detect anomalies in the training data or in new input data.
Begin by creating an autoencoder model:
Language: SQL
CREATE MODEL `mydataset.my_autoencoder_model`OPTIONS(model_type='autoencoder',activation_fn='relu',batch_size=8,dropout=0.2,hidden_units=[32, 16, 4, 16, 32],learn_rate=0.001,l1_reg_activation=0.0001,max_iterations=10,optimizer='adam') ASSELECT* EXCEPT(Time, Class)FROM`bigquery-public-data.ml_datasets.ulb_fraud_detection`;
To detect anomalies in the training data, use ML.DETECT_ANOMALIES with the same data used during training:
Language: SQL
SELECT*FROMML.DETECT_ANOMALIES(MODEL `mydataset.my_autoencoder_model`,STRUCT(0.02 AS contamination),TABLE `bigquery-public-data.ml_datasets.ulb_fraud_detection`);

To detect anomalies in new data, use ML.DETECT_ANOMALIES and provide new data as input:
Language: SQL
SELECT*FROMML.DETECT_ANOMALIES(MODEL `mydataset.my_autoencoder_model`,STRUCT(0.02 AS contamination),(SELECT * FROM `mydataset.newdata`));

How does anomaly detection work for autoencoder models?
Anomalies are identified based on the value of each input data point’s reconstructed error, which, if exceeds a threshold determined by the contamination value, is identified as an anomaly. How does this work exactly? With an autoencoder model and data as inputs, ML.DETECT_ANOMALIES first computes the mean_squared_error for each data point between its original values and its reconstructed values. The contamination value, specified by the user, determines the threshold of whether a data point is considered an anomaly. For example, a contamination value of 0.1 means that the top 10% of descending error from the training data will be used as the cut-off threshold. Setting an appropriate contamination will be highly dependent on the requirements of the user or business.
For more information on anomaly detection with autoencoder models, please see the documentation here.
Anomaly detection with an ARIMA_PLUS time-series model

With ML.DETECT_ANOMALIES, you can now detect anomalies using ARIMA_PLUS time series models in the (historical) training data or in new input data. Here are some examples of when might you want to detect anomalies with time-series data:
Detecting anomalies in historical data:
- Cleaning up data for forecasting and modeling purposes, e.g. preprocessing historical time series before using them to train an ML model.
- When you have a large number of retail demand time series (thousands of products across hundreds of stores or zip codes), you may want to quickly identify which stores and product categories had anomalous sales patterns, and then perform a deeper analysis of why that was the case.
Forward looking anomaly detection:
- Detecting consumer behavior and pricing anomalies as early as possible: e.g. if traffic to a specific product page suddenly and unexpectedly spikes, it might be because of an error in the pricing process that leads to an unusually low price.
- When you have a large number of retail demand time series (thousands of products across hundreds of stores or zip codes), you would like to identify which stores and product categories had anomalous sales patterns based on your forecasts, so you can quickly respond to any unexpected spikes or dips.
How do you detect anomalies using ARIMA_PLUS? Begin by creating an ARIMA_PLUS time series model:
Language: SQL
CREATE OR REPLACE MODEL mydataset.my_arima_plus_modelOPTIONS(MODEL_TYPE='ARIMA_PLUS',TIME_SERIES_TIMESTAMP_COL='date',TIME_SERIES_DATA_COL='total_amount_sold',TIME_SERIES_ID_COL='item_name',HOLIDAY_REGION='US') ASSELECTdate,item_description AS item_name,SUM(bottles_sold) AS total_amount_soldFROM`bigquery-public-data.iowa_liquor_sales.sales`GROUP BYdate,item_nameHAVINGdate BETWEEN DATE('2016-01-04') AND DATE('2017-06-01')AND item_name IN ("Black Velvet", "Captain Morgan Spiced Rum","Hawkeye Vodka", "Five O'Clock Vodka", "Fireball Cinnamon Whiskey");
To detect anomalies in the training data, use ML.DETECT_ANOMALIES with the model obtained above:
Language: SQL
SELECT*FROMML.DETECT_ANOMALIES(MODEL `mydataset.my_arima_plus_model`,STRUCT(0.8 AS anomaly_prob_threshold));

To detect anomalies in new data, use ML.DETECT_ANOMALIES and provide new data as input:
Language: SQL
WITHnew_data AS (SELECTdate,item_description AS item_name,SUM(bottles_sold) AS total_amount_soldFROM`bigquery-public-data.iowa_liquor_sales.sales`GROUP BYdate,item_nameHAVINGdate BETWEEN DATE('2017-06-02')AND DATE('2017-10-01')AND item_name IN ('Black Velvet','Captain Morgan Spiced Rum','Hawkeye Vodka',"Five O'Clock Vodka",'Fireball Cinnamon Whiskey') )SELECT*FROMML.DETECT_ANOMALIES(MODEL `mydataset.my_arima_plus_model`,STRUCT(0.8 AS anomaly_prob_threshold),(SELECT*FROMnew_data));

For more information on anomaly detection with ARIMA_PLUS time series models, please see the documentation here.
Thanks to the BigQuery ML team, especially Abhinav Khushraj, Abhishek Kashyap, Amir Hormati, Jerry Ye, Xi Cheng, Skander Hannachi, Steve Walker, and Stephanie Wang.
How OnlineSales.ai and Google Cloud Helped TATA 1mg Increase Ad Revenue by 700%

1385
Of your peers have already read this article.
3:30 Minutes
The most insightful time you'll spend today!
Editor’s note: We invited partners from across our retail ecosystem to share stories, best practices, and tips and tricks on how they are helping retailers transform during a time that continues to see tremendous change. This original blog post was published by OnlineSales.ai. Please enjoy this updated entry from our partner.

Tata’s online healthcare entity, Tata 1mg, aims to revolutionize how a consumer finds the right healthcare professional for their needs. The platform offers e-pharmacy services, diagnostics, and health content and has more than 200,000 active brands in its rapidly expanding list of suppliers, sellers and manufacturers. Several of these brands would need regular involvement from the marketplace team in order to set up and run ad campaigns. As one of the largest platforms, Tata 1mg approached OnlineSales.ai to address their growing needs for an efficient Retail Media Monetisation suite to help scale up their existing monetisation efforts.
Tata 1mg needed more data-driven insights and customizability for their monetisation efforts
Tata 1mg saw several challenges that they needed to address.
- Manual effort: Tata 1mg marketplace team’s monetization process was largely manual and required heavy time and resource investment to activate advertisers, which subsequently ate into their overall ad revenues.
- Non-scalable framework: Given the fast-growing number of advertisers on their marketplace – well into the hundreds of thousands – it became increasingly clear that their existing monetization framework was not scalable.
- Inadequate reporting & analytics: The existing framework facilitated only simple reporting, and brands were not able to draw the deep insights they needed to make data-led decisions and refine their advertising ROIs.
- Steep learning curve: Several brands lacked dedicated advertising experts who could bring the experience and skills needed to plan successful ad campaigns and optimize budgets. The involved learning curve led to increased advertiser-churn.
- Lack of personalized offerings: The manual nature of Tata 1mg’s monetization framework left little room for customizability, and account managers could offer very little in terms of tailored ad-buying experiences to different types of advertisers.
All of these issues led to regular revenue leakage. Tata 1mg realized the need for a central platform that addressed the above-mentioned issues and would also be able to cater to new ad channels and the requirements thereof. Developing such a solution in house was evaluated, but was found to be expensive and would require a lot of time to build.
OnlineSales.ai’s AI/ML-powered solution on Google Cloud offered the automation and flexibility to support modern omnichannel advertising needs
Therefore, Tata 1mg looked to OnlineSales.ai Monetize, an AI/ML-powered retail media monetisation suite on Google Cloud, to help address their needs for a cloud-based monetisation platform that offered the flexibility to support omnichannel advertising models, had automation built in to reduce manual tasks, provided detailed intelligence and analytics, and delivered quick, reliable scalability.
- White labeled self-serve platform: OnlineSales.ai’s retail media platform was implemented within a short 4 weeks. After thorough testing and implementation, the platform was successfully launched, and enabled sellers to run ads on a fully self-serve platform. This required zero involvement from the Tata team.
- Unified omni channel buying: The team at OnlineSales.ai worked closely with the platform’s core teams to activate and mobilize various advertising products through a self-serve platform, while simultaneously addressing any unique requirements they had.
- Omnichannel analytics with AI-led suggestions: Sellers are now also able to generate detailed reports that provide them critical insights into campaigns, and help them make better use of their budgets – enhancing their experience and interest in advertising on the platform.
- Personalized buying experiences: The tailored UX offered by OnlineSales.ai’s Monetize helped Tata engage brands of all levels in technical aptitude to use the platform easily. This also allowed admins to configure what types of inventories were available to different brands or advertiser segments.
OnlineSales.ai makes use of Google Cloud Dataflow to facilitate computations on real-time streaming. Microservices are deployed on the Google Kubernetes Engine (GKE) platform due to the solution’s well-known ability to handle scale.
In addition, Dataproc is used by the company to run batch processing apps while Cloud Load Balancing helps manage traffic across different regions; all at scale. Onlinesales.ai also uses Memorystore as a database for their ad servers in order to have very low latency, and deploys BigQuery to run analytical applications and facilitate powerful reporting. The bulk of their office applications are deployed on different VMs on Compute Engine, and the company also makes use of Cloud Storage for data storage and transfers between applications.
Learn more about OnlineSales.ai available on the Google Cloud Marketplace.
About OnlineSales.ai
OnlineSales.ai, offers a fully white labeled retail media platform which helps retailers unlock additional revenue by activating advertising real estate on their platform. With its AI/ML-powered solution, OnlineSales.ai allows retailers to turn brands of all sizes into advertisers – at scale. Its self-serve platform simplifies the ad buying process, and enhances outcomes with smart automation, boosting ad retailers’ ad revenues by multiples.
3137
Of your peers have already watched this video.
38:30 Minutes
The most insightful time you'll spend today!
Building Data Lakes on Google Cloud
A data lake is a centralized and a secure data platform for ingesting, storing, processing, and analyzing all your data–structured semi-structured and unstructured data–at scale.
“When we work with our customers we find out that the traditional approach for building data lakes, where you bring data from different sources and land them into a single central store has not worked. The traditional approach ended up creating swamps instead of lakes,” says Nitin Motgi, Product Manager, Google Cloud.
In this video, Motgi will talk about how to build data lakes correctly.
Google Cloud provides all the capabilities enterprises need to create and manage data lakes. Enterprises can use Google Cloud to aggregate their data and efficiently analyze it using cloud-native or open source tools irrespective of where the data is managed.
Also, learn how Google is making investments to simplify data lake deployment and management.
2845
Of your peers have already watched this video.
30:00 Minutes
The most insightful time you'll spend today!
How Major League Baseball Migrated from Teradata to BigQuery
Ever wondered how to jumpstart a migration from your legacy on-premises or cloud data warehouse to BigQuery?
In this video Robert Goretsky, VP, Data Engineering, Major League Baseball and Ryan McDowell, Cloud Data Engineer, Google Cloud show you how.
They offer a deep-dive into MLB’s Teradata to BigQuery migration journey. In the course of the session they share the lessons they learnt, and business insights that they achieved as a result of modernizing MLB’s analytics strategy.
Find out how to run a migration assessment, migrate a subset of the data and schema with BigQuery DTS, and transform the SQL queries from Teradata into BigQuery dialect with CompilerWorks. Watch this video to get a deep understanding of your enterprise data warehouse migration journey.
More Relevant Stories for Your Company

Airbus: Taking the flight to a brighter future with Google Cloud and Google Workplace
“Any device, anytime, anywhere.” A cohort of CIOs within Airbus believed that the cloud, combined with new ways of working, could provide the foundation for this vision. Google Workspace and Google Cloud have played a pivotal role in helping Airbus realize this new path, transforming security, data management, and collaboration


Why it’s Easier Than Ever for Developers to Break Into Machine Learning and Data Science
This week we talk about machine learning, its best use cases, and how developers can break into machine learning and data science. Dale Markowitz, Google Developer Advocate, talks about natural language processing as well, explaining that it’s basically the intersection of machine learning and text processing. It can be used

How Do You Cut Costs and Improve Staff Productivity, and Business Visibility? Ascend Money Has an Answer
Hundreds of millions of residents of South East Asia have only limited access to banking and finance services. However, help is at hand. One of South East Asia's largest fintech businesses, Ascend Money is using digital technologies to realize its mission of enabling as many people as possible to access


How to Build a Global Marketing Data Hub
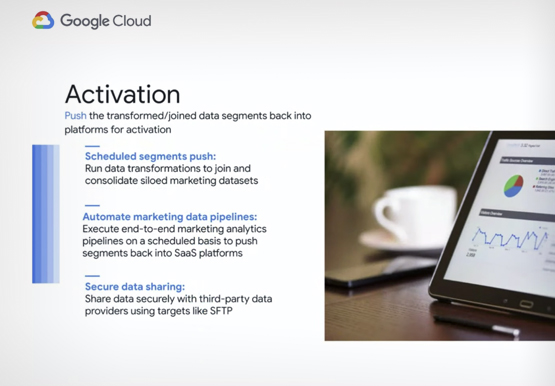
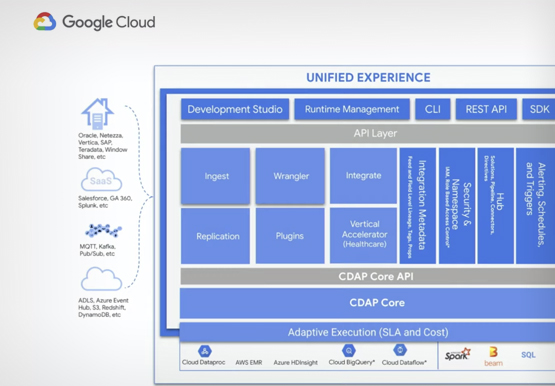
Data-driven marketing ensures that the right message is reaching the right customer at the right time through the right channel. However if an organization’s data resides in multiple systems and platforms it hampers its ability to deliver truly global data-driven campaigns, attribution analysis, and reporting. See how Cloud Data Fusion
