





Quantum Metric Increases Business 10-fold

9244
Of your peers have already read this article.
5:30 Minutes
The most insightful time you'll spend today!
At Quantum Metric, we’re in the business of bringing our customers business insights that are based on customer experience data and analytics for mid-market and Fortune 500 companies.
Our software, powered by big data, machine intelligence, and Google Cloud, helps our customers identify, quantify, prioritize and measure opportunities to improve digital experiences.
As companies move to a more agile product lifecycle, including continuous deployment and continuous integration, they’re finding that it’s critical to receive perpetual quantified feedback and insights from their data in real time to understand where the largest opportunities exist.
Each year, billions of customer interactions are captured through browsers or mobile apps on PCs, tablets, and mobile devices. This data, fed into the Quantum Metric platform, can show if a customer had a password problem they couldn’t solve or struggled when trying to purchase something and abandoned their cart.
It also can show if the customer tried in vain to complete an online change to their service provider’s subscription, to reach tech support, or couldn’t find the size or color they were looking for while shopping online.
Most importantly, the Quantum Metric platform quantifies the business value of the issue, helping organizations prioritize where they can make the largest impact to their business.
Success overwhelms our initial architecture
Initially, the Quantum Metric experience analytics software ran on a MySQL open source relational database management system (RDBMS). The MySQL RDBMS worked great for simple queries, when there was a specific question to ask of the data.
Soon, though, we knew we needed to offer more advanced data science capabilities. Our bigger customers wanted to ask questions across very large data sets—days, weeks, months, and years worth of data. They wanted to pose iterative questions using complex filters to answer their most challenging business questions.
With more complex queries across more data, response times from our RDBMS went from 100 to 500 milliseconds to as long as 20 minutes.
That delay was slowing down our ability and time to insights, which also reduced the value we could provide to our customers, since iterative exploration and analysis requires real-time query responses. Because of the need for real-time responses, there were certain questions that we just weren’t able to ask of the data. It became clear that we needed a much more robust data warehouse solution.
There were also operational challenges with MySQL and massive-scale data ingestion. We spent a lot of time into the wee hours of the night and morning handling errors and recovering databases.
We tried to address these challenges by sharding, partitioning, and indexing the data to optimize for the types of questions customers were asking. But the problems were escalating and happening more often, from once a month across the customer base to monthly for at least 20 different customers.
We could tune the platform for today and tomorrow’s workload, with good guesses at where indexes could be used, but we simply couldn’t continue to horizontally scale MySQL in a cost-efficient and operationally efficient manner.
Speed breeds innovation
Once we started exploring options that could better scale with our business, we looked at NoSQL technologies like Cassandra (a partitioned row-store database), MySQL’s Column Store (a columnar store database), and Vertica (a columnar store database)—each with unique ways of handling data storage and accessibility.
But with high volumes of complex queries across large data stores, all of these solutions began to fail, bogged down with multiple, simultaneous users. We could have solved the problems with more raw compute and storage, but it would have been prohibitively expensive to run and require a large team to operate.
We then decided to try BigQuery, and it was transformative.
We connected our front end to BigQuery via APIs. Once data is 15 minutes old, it is automatically extracted, loaded, and transformed (ETL) to BigQuery.
We continuously update the legacy MySQL RDBMS so its data is integrated with BigQuery data when queries require real-time data. Most query response times are within 100-200 milliseconds, matching what we initially experienced with MySQL.
When traffic from our customers scales up, we can now scale on-demand to accommodate it, thanks to BigQuery’s hundreds of thousands of CPUs. Our customers no longer run into slow response times, and we’ve gained confidence that we can offer them—and their users—advanced insights and better experiences without delay.
More importantly, with this scale of query power, we were able to build data science algorithms into the platform, which iteratively query BigQuery based on the results, and help quantify the impact of a specific issue to a specific segment of users. Adding these capabilities was possible because of the massive scale of BigQuery.
In addition to new insights and fast response times, we wanted our customers to be able to ask complex questions using very simple language.
For example: “Show me high-loyalty customers, located in specific geographic areas, who visited the web site at least five times, based on specific campaigns, and never booked a seat on a flight.”
This was exactly the kind of query that was used by a major U.S. airline to understand the multi-million dollar impact of a failure affecting their most valuable customers: their high-loyalty members.
And this was all done while maintaining the highest standard of care of customer data and privacy by default, using multiple layers of encryption of data in transit, at rest, and a unique military-grade encryption approach. This approach encrypts PII, including even session cookies, with a RSA-2048 key available only to a select few and used for use cases such as fraud analysis.
It’s no exaggeration to say that BigQuery has totally transformed our business. It provides the petabyte scale and speed we were missing, in addition to taking care of operational maintenance, a task that was burying our team with MySQL.
We’re now able to support some of the largest companies in the world that require real-time, petabyte-scale analytics. That lets them serve more customers faster with higher quality, and take advantage of BigQuery’s power and scale to innovate.
There are other cloud solutions that can address petabyte analytics, but the most unique value proposition of BigQuery was its on-demand scaling and operational management, with extremely cost-effective pay-as-you-go billing. While today we are at a scale where we have round-the-clock querying needs, our early days had very sporadic query loads where we needed instant scale, then a long lull of nothing. The unique business model of BigQuery’s pay-by-bytes-scanned allowed us to have access to a massive-scale querying platform without breaking the bank.
Using BigQuery powers better customer experience and reduces purchasing friction
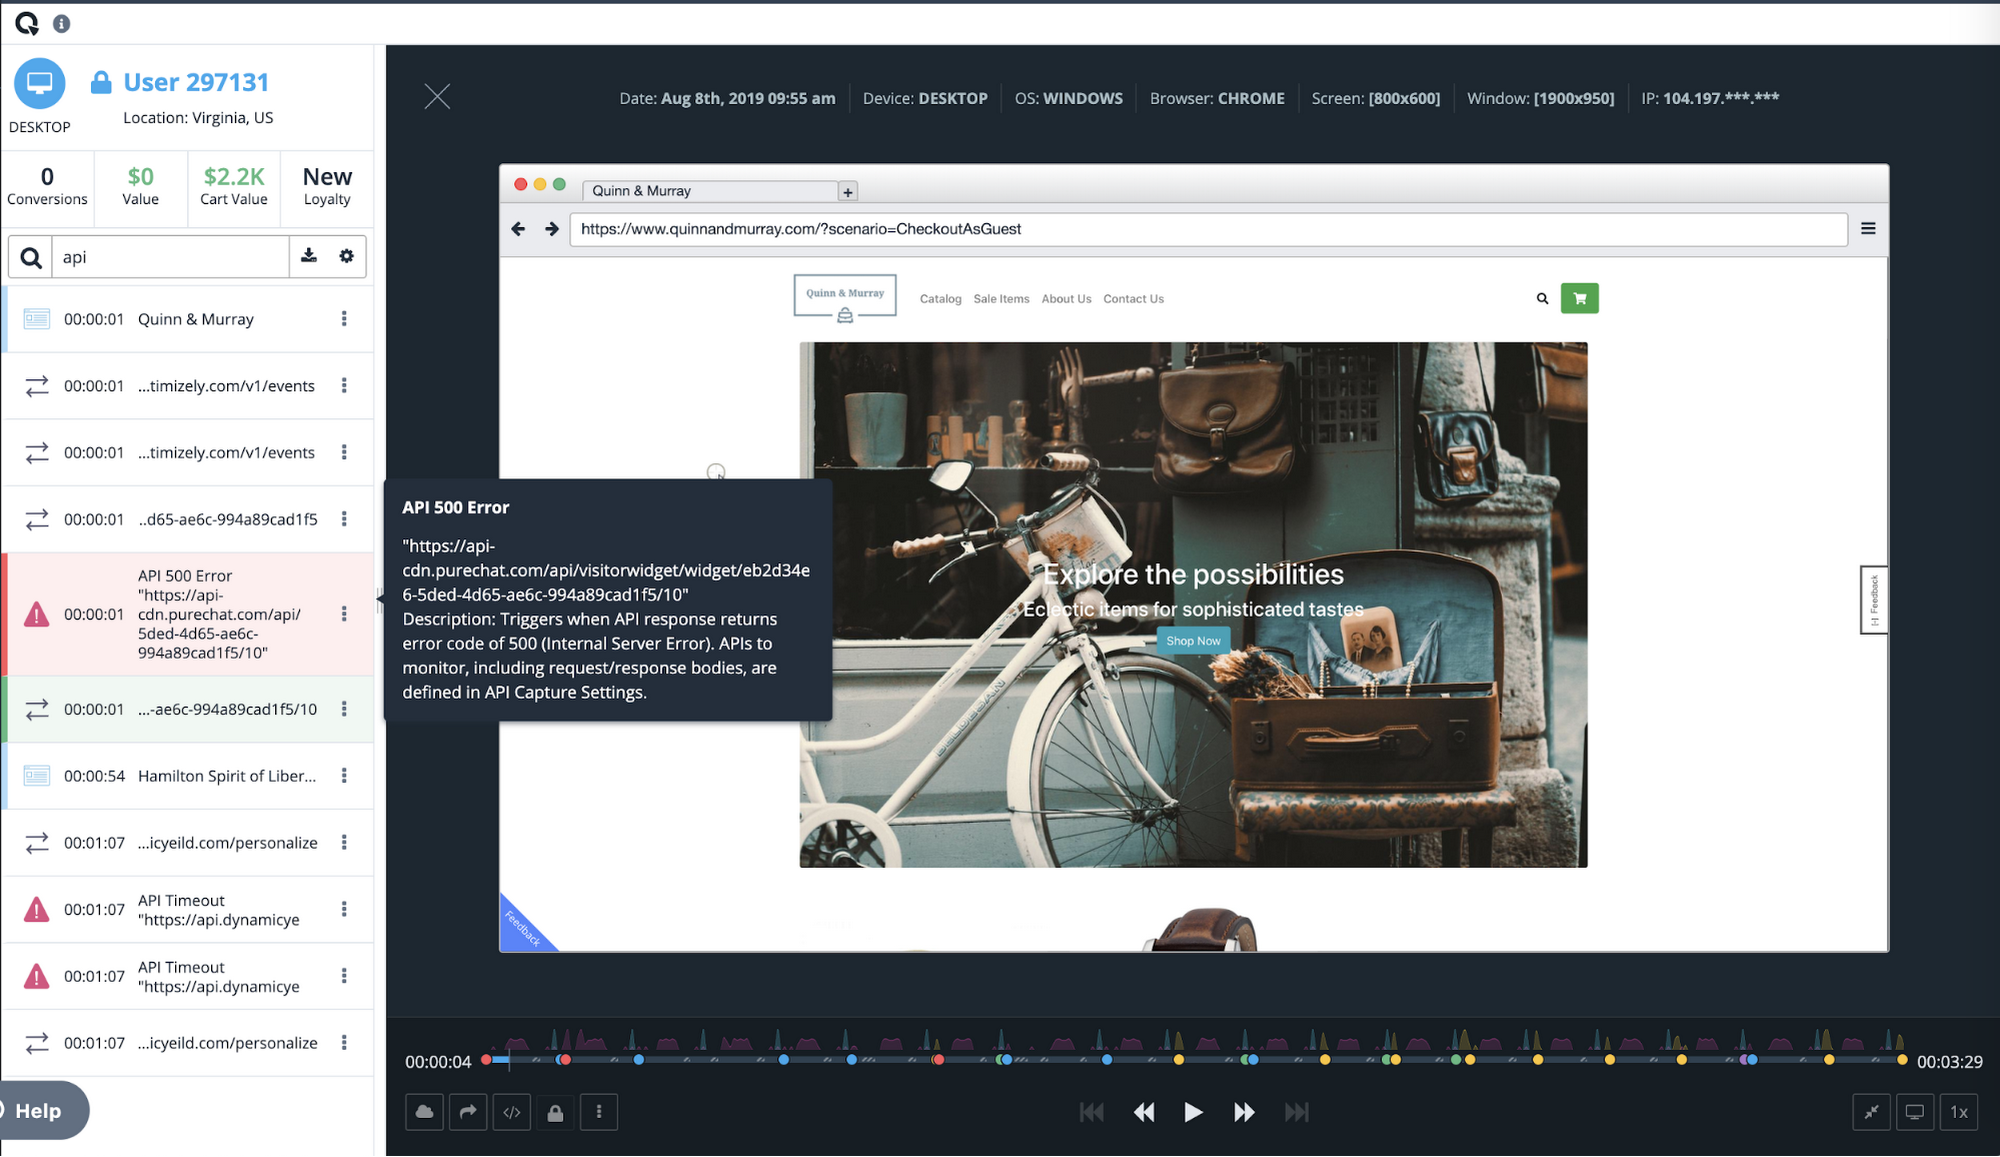
Among the many features of Quantum Metric is the ability to replay online customer sessions. In the example below from a mobile e-commerce site, each action is displayed chronologically. Why did this customer’s transaction fail?
Diving deeper, the session replay shows that the user tried to change the item quantity in the checkout cart, which resulted in a failed API call. Powered by BigQuery, Quantum Metric can then show how many other end users had this issue, with a simple click of “Show More Errors Like This.”
With BigQuery’s massive scale, Quantum Metric will then quantify the impact of that issue, so companies can prioritize which issues need attention immediately. If this is the issue that’s impacting the business the most, our customer can use a single click to open a Jira ticket, forwarding the discovery to their product and engineering teams. Those teams can then re-engineer the experience in near-real time, addressing the failed API call and cutting out the frustrating time it takes for engineers to reproduce the issue.
Once we had a powerful back end in BigQuery, we realized that Quantum Metric’s platform could be used to ask complex questions from vast datasets. We built some of the processes that data scientists use to formulate those queries right into our product.
For example, we added one series of processes to our platform to help customers understand whether a suspect issue is really impacting end-user experience. Is it something that should be prioritized and fixed? Does this really affect the user experience? Does it have financial impact? These and other questions can be pre-defined as a complex query in Quantum Metric to let our customer quickly gain insight on how an issue is impacting the business. Customers were blown away when they heard this was possible. It was the holy grail for what they were looking for in data science. It really sets us apart from our competition.
Today, with every company heavily dependent on data, those companies that can uncover and act on insights fastest are the ones that will succeed. BigQuery gives us the data warehouse platform we need to provide our customers with fast, reliable technology tools. It frees us from having to deal with the minutiae of technology infrastructure operations, so we can focus on finding and extracting the magic in customer data. With the power and scale of BigQuery, combined with the real-time capture of every user experience with 100% fidelity, we’re able to offer a self-service analytics platform that provides insights into digital journey friction points and acts as the indisputable arbitrator of truth.
Analytics Hub for Secure Data Sharing and Analytics Unlocks True Data Value and Insights

6726
Of your peers have already read this article.
2:30 Minutes
The most insightful time you'll spend today!
Customers tell us that sharing and exchanging data with other organizations is a critical element of their analytics strategy, but it’s hamstrung by unreliable data and processes, and only getting harder with security threats and privacy regulations on the rise.
Furthermore, traditional data sharing techniques use batch data pipelines that are expensive to run, create late arriving data, and can break with any changes to the source data. They also create multiple copies of data, which brings unnecessary costs and can bypass data governance processes. These techniques do not offer features for data monetization, such as managing subscriptions and entitlements. Altogether, these challenges mean that organizations are unable to realize the full potential of transforming their business with shared data.
To address these limitations, we are introducing Analytics Hub, a new fully managed service, available in Q3, in preview, that helps you unlock the value of data sharing, leading to new insights and increased business value. With Analytics Hub you get:
- A rich data ecosystem by publishing and subscribing to analytics-ready datasets.
- Control and monitoring over how your data is being used, because data is shared in one place.
- A self-service way to access valuable and trusted data assets, including data provided by Google. For example, a unique dataset from Google Search Trends will be available, that you can query and combine with your own data.
- An easy way to monetize your data assets without the overhead of building and managing the infrastructure.
Built on a decade of cross-organizational sharing
While Analytics Hub is a new service, it builds on BigQuery, Google’s petabyte-scale, serverless cloud data warehouse. BigQuery’s unique architecture provides separation between compute and storage, enabling data publishers to share data with as many subscribers as you want without having to make multiple copies of your data. With BigQuery, there are no servers to deploy or manage, which means that data consumers get immediate value from shared data. Data can be provided and consumed in real-time using the streaming capabilities of BigQuery and you can leverage the built in machine learning, geospatial, and natural language capabilities of BigQuery or take advantage of the native business intelligence support with tools like Looker, Google Sheets, and Data Studio.
BigQuery has had cross-organizational, in-place data sharing capabilities since it was introduced in 2010. We took a look at usage metrics in BigQuery and found that over a 7 day period in April, we had over 3,000 different organizations sharing over 200 petabytes of data. These numbers don’t include data sharing between departments within the same organization.
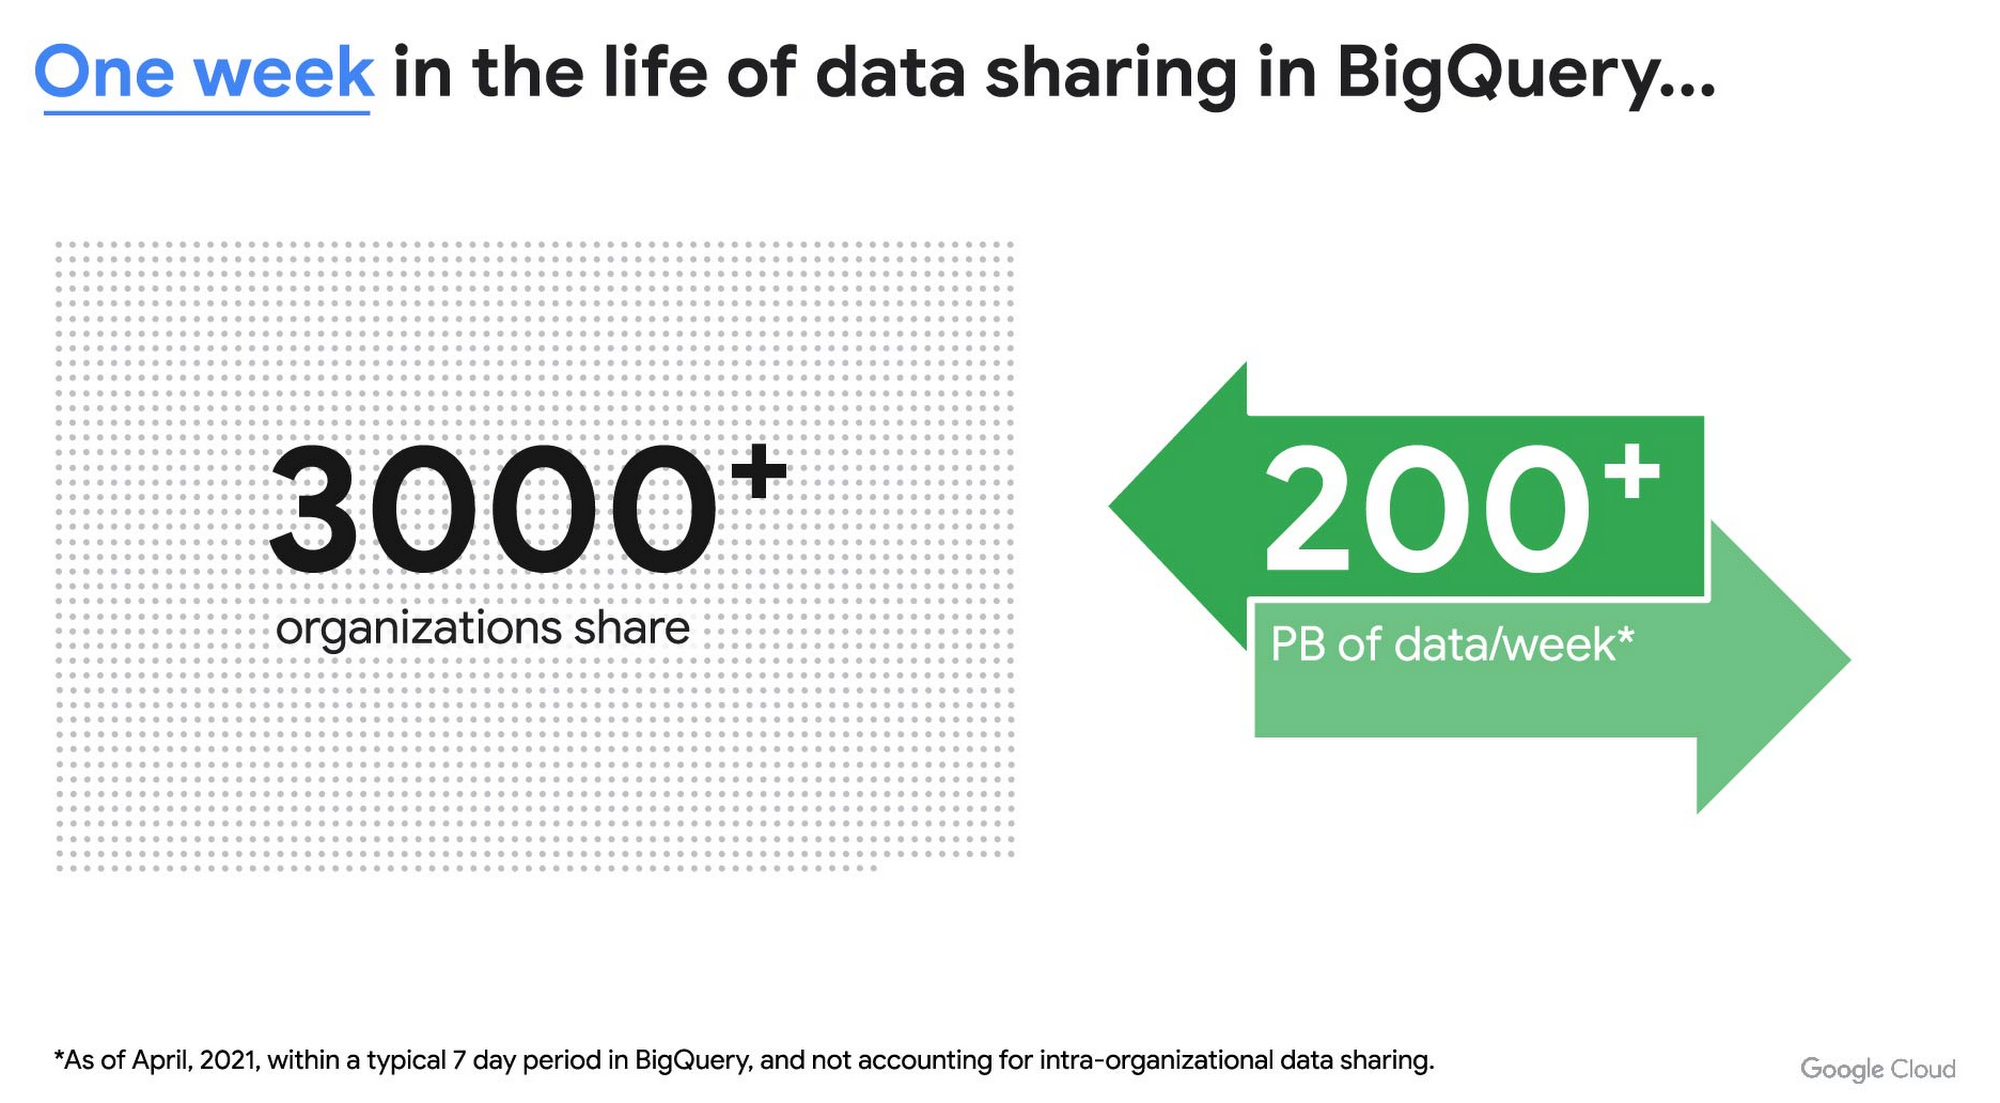
As you can see, data sharing in BigQuery is already popular. But we want to make it easier and even more scalable.
Raising the bar on data sharing
To make data sharing easier and more scalable in BigQuery, Analytics Hub introduces the concepts of shared datasets and exchanges. As a data publisher, you create shared datasets that contain the views of data that you want to deliver to your subscribers. Next, you create exchanges, which are used to organize and secure shared datasets. By default, exchanges are completely private, which means that only the users and groups that you give access to can view or subscribe to the data. You can also create internal exchanges or leverage public exchanges provided by Google. Finally, you publish shared datasets into an exchange to make them available to subscribers.
Data subscribers search through the datasets that are available across all exchanges for which they have access and subscribe to relevant datasets. This creates a linked dataset in their project that they can query and join with their own data. Subscribers pay for the queries that they run against the data while the publisher pays for the storage of the data. Data providers can add new data, new tables, or new columns to the shared dataset and these will be immediately available to subscribers. In addition, the publisher can track subscribers, disable subscriptions, and see aggregated usage information for the shared data.
Analytics Hub makes it easy for you to publish, discover, and subscribe to valuable datasets that you can combine with your own data to derive unique insights. Here are some types of data that will be available through Analytics Hub:
- Public datasets: Easy access to the existing repository of over 200 public datasets, including data about weather and climate, cryptocurrency, healthcare and life sciences, and transportation.
- Google datasets: Unique, freely-available datasets from Google. One example of this is the COVID-19 community mobility dataset. Another example is the forthcoming Google Trends dataset, which will provide the top 25 search terms and top 25 rising search terms over a 5 year window in 210 distinct locations in the US. Trends data can be used by everyone in the organization to gain insights into what customers care about.
- Commercial (paid for) datasets: We are working with leading commercial data providers to bring their data products to Analytics Hub. If you are interested in delivering your data via Analytics Hub, we’re also introducing Data Gravity, an initiative that provides storage benefits and new distribution paths for data published through Analytics Hub.
- Internal datasets: We know that data sharing can be challenging in larger organizations. Analytics Hub can be used for internal data, for example, to share standardized customer demographics with your sales engineering and data science teams.
Customers and partners using Analytics Hub

“Google Search Trends data has always been an important tool for our WPP agency data teams. At WPP we believe that data variety is a superpower which is why we are excited to use the new Trends dataset availability within BigQuery, plus the launch of Analytics Hub. The best creativity in the world is informed by data insights, and influenced by what people search for, so the operational efficiencies we’ll gain via the Analytics Hub and the insights we can drive with Trends data are just phenomenal.”
—Di Mayze Global Head of Data and AI, WPP

“Equifax Ignite is our shared data analytics environment within our Equifax data fabric. We are excited to partner with Google to leverage Analytics Hub and BigQuery to deliver data to over 400 statisticians and data modelers as well as securely sharing data with our partner financial institutions.”
—Kumar Menon, SVP Data Fabric and Decision Science, Equifax

“The flow of data and insights between our teams at Deloitte and our clients is paramount for building truly transformational data cultures. With its purpose-built architecture for secure data exchanges and sharing analytics resources, Google Cloud’s Analytics Hub can help provide significant operational efficiencies for how Deloitte teams support our clients’ data-driven initiatives within their industry ecosystems. It will also help minimize the worries about scale, privacy and security, or the administrative burden associated with each.”
—Navin Warerkar, Managing Director, Deloitte Consulting LLP, and US Google Cloud Data & Analytics GTM Lead

“Crux Informatics is proud to partner with Google to support the launch of Analytics Hub, removing friction for those who need access to analytics-ready data. With thousands of datasets from over 140 sources, Crux Informatics will accelerate access to data on Analytics Hub and together provide a more efficient and cost effective solution to deliver datasets in Google Cloud’s ecosystem.”
—Will Freiberg, CEO, Crux Informatics
Next steps for Analytics Hub
This is just the beginning for Analytics Hub. As we get to preview and general availability, we will be adding additional capabilities, including workflows for publishing and subscribing, publishing analytics assets (Looker Blocks, Data Studio reports, Connected Google Sheets) along with the shared data, the ability for data publishers to specify query restrictions on the usage of their data, and making it easy for data publishers to create sandbox environments for subscribers to work with their data, even if they are not yet on Google Cloud. We will provide features in Analytics Hub for monetization of data, including managing subscriptions, data entitlements, and billing.
Please sign up for the preview, which is scheduled to be available in the third quarter of 2021. In the meantime, you can learn more about BigQuery and how to leverage its built-in data sharing capabilities. Please go to g.co/cloud/analytics-hub to register your interest in Analytics Hub.
Transforming Software Development Education with CourseMatix

1469
Of your peers have already read this article.
3:00 Minutes
The most insightful time you'll spend today!
As the world increasingly relies on software, businesses have struggled to find enough developer talent to build and maintain their applications. IDC estimates the global shortage of software developers reached 1.4 million in 2021 and expects that number to balloon to 4 million by 2025.
Higher education is a great starting point to solve the software development skills shortage. One institution — Spokane Community College — has made strides in enhancing student learning and serving more students with the right mix of software development and IT education while saving educators time.
Building a modern IT education platform
As a first step to improve computer science education and scale the number of students it could teach, Spokane Community College needed a platform that could help instructors more efficiently manage the teaching process. That’s where CourseMatix came in.
CourseMatix is an education platform that delivers the required tools, platforms, and frameworks such as automated grading, assignment tracking, and testing to save teachers time and enhance students’ learning.
CourseMatix is entirely made up of microservices, with significant compute demands because it creates and runs a unique dedicated environment for each student. The platform is complex by nature as it supports a range of technologies that computer science professors need to teach varying coursework. This led to issues with scalability, reliability, and uptime when running on legacy infrastructure.
“We really wanted to no longer manage our infrastructure, leaving us to focus entirely on our platform,” says Aleks Korn, chief executive officer of CourseMatix. “We engaged Google Cloud partner CDW to see how we could simplify and improve our IT environment. The decision was quickly made to migrate to Google Kubernetes Engine (GKE).”
GKE provides CourseMatix with automatic horizontal and vertical scaling to minimize costs and downtime, while removing management and maintenance requirements. This enables CourseMatix to expand the reach of its platform at the lowest possible price and maintain a lean team. CDW helped CourseMatix make this decision to migrate to GKE, managed the migration, and provided guidance on a storage solution.
Because CourseMatix has high data storage volume requirements (given the size of software development assignments) and needs to be fully reliable to ensure work is not lost, it also chose to work with NetApp. NetApp Cloud Volumes Service for Google Cloud perfectly complements GKE in its highly expandable, reliable, and user-friendly capabilities. The platform was now ready for its U.S. launch at Spokane Community College.
Transforming software development education
Spokane Community College needed a solution to address the challenges facing its professors, particularly with respect to time management.
“Each software development assignment can take an hour to grade,” says Bret Dickey, professor of software development at Spokane Community College. “When you have 100 students, you’re talking weeks of turnaround time to grade those projects. CourseMatix provides immediate feedback, which is a game changer for us as professors and our students.”
Students now complete and submit their assignments with real-world tools, using source control, creating branches to complete their work, and merging those branches to push up to the server where pipelines run the applications.
“It’s making our teaching better overall, including using real-world concepts to enhance teaching and outcomes,” says Dickey.
CourseMatix also provides the tooling to upskill on various programming languages and software packages required for coursework, helping Spokane Community College manage server-side frameworks and client-side languages that each have their own tools.
“Students can access their cloud-based coding environment and all the tools they may need for an assignment are ready to go,” says Karmen Blake, another software development professor at Spokane Community College. “Having a central system for tooling within CourseMatix has been a huge time saver, meaning more time for learning and practice that prepares students for careers as professional software developers.”
Karmen and Dickey have seen marked improvements in their ability to teach and in student learning by using CourseMatix. For example, the platform provides automated hints and varying error messages based on the number of attempts a student has made to solve a problem to help each student along without making the assignment too easy or too difficult.
As a cloud-based platform, CourseMatix also empowers students from a wide range of socioeconomic backgrounds to learn computer science.
“As long as students can access the internet on their laptops, they have everything to complete their assignments,” says Karmen. “The cloud-based CourseMatix offering improves efficiency and equity across all students in our computer science programs.”
With a more fluid experience for students and immense amounts of time saved on grading, Spokane Community College is in a better position to increase enrollment in software development classes.
“Now that we have automated our grading and optimized our assignment processes, I am beginning to take on more students and teach more classes,” says Dickey. “I could not have imagined this outcome only a couple of years ago, and it’s all possible thanks to CourseMatix.”
To learn more about how partners help organizations make the most of Google Cloud, you can visit our partner page.
BigQuery Admin Reference Guide Series: How to Optimize Data in Your Native Storage

3721
Of your peers have already read this article.
4:00 Minutes
The most insightful time you'll spend today!
So far on the BigQuery Admin Reference Guide series, we’ve talked about the different logical resources available inside of BigQuery. Now, we’re going to begin talking about BigQuery’s architecture. In this post we’re diving into how BigQuery stores your data in native storage, and what levers you can pull to optimize how your data is stored.
Columnar storage format
BigQuery offers fully managed storage, meaning you don’t have to provision servers. Sizing is done automatically and you only pay for what you use. Because BigQuery was designed for large scale data analytics data is stored in columnar format.
Traditional relational databases, like Postgres and MySQL, store data row-by-row in record-oriented storage. This makes them great for transactional updates and OLTP (Online Transaction Processing) use cases because they only need to open up a single row to read or write data. However, if you want to perform an aggregation like a sum of an entire column, you would need to read the entire table into memory.
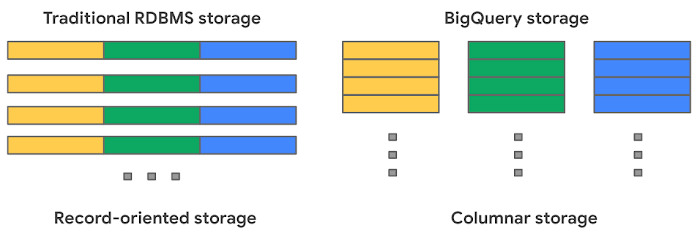
BigQuery uses columnar storage where each column is stored in a separate file block. This makes BigQuery an ideal solution for OLAP (Online Analytical Processing) use cases. When you want to perform aggregations you only need to read the column that you are aggregating over.
Optimized storage format
Internally, BigQuery stores data in a proprietary columnar format called Capacitor. We know Capacitor is a column-oriented format as discussed above. This means that the values of each field, or column, are stored separately so the overhead of reading the file is proportional to the number of fields you actually read. This doesn’t necessarily mean that each column is in its own file, it just means that each column is stored in a file block, which is actually compressed independently for increased optimization.
What’s really cool is that Capacitor builds an approximation model that takes in relevant factors like the type of data (e.g. a really long string vs. an integer) and usage of the data (e.g. some columns are more likely to be used as filters in WHERE clauses) in order to reshuffle rows and encode columns. While every column is being encoded, BigQuery also collects various statistics about the data — which are persisted and used later during query execution.
If you want to learn more about Capacitor, check out this blog post from Google’s own Chief BigQuery Officer.
Encryption and managed durability
Now that we understand how the data is saved in specific files, we can talk about where these files actually live. BigQuery’s persistence layer is provided by Google’s distributed file system, Colossus, where data is automatically compressed, encrypted, replicated, and distributed.
There are many levels of defense against unauthorized access in Google Cloud Platform, one of them being that 100% of data is encrypted at rest. Plus, if you want to control encryption yourself, you can use customer-managed encryption keys.
Colossus also ensures durability by using something called erasure encoding – which breaks data into fragments and saves redundant pieces across a set of different disks. However, to ensure the data is both durable and available, the data is also replicated to another availability zone within the same region that was designated when you created your dataset.
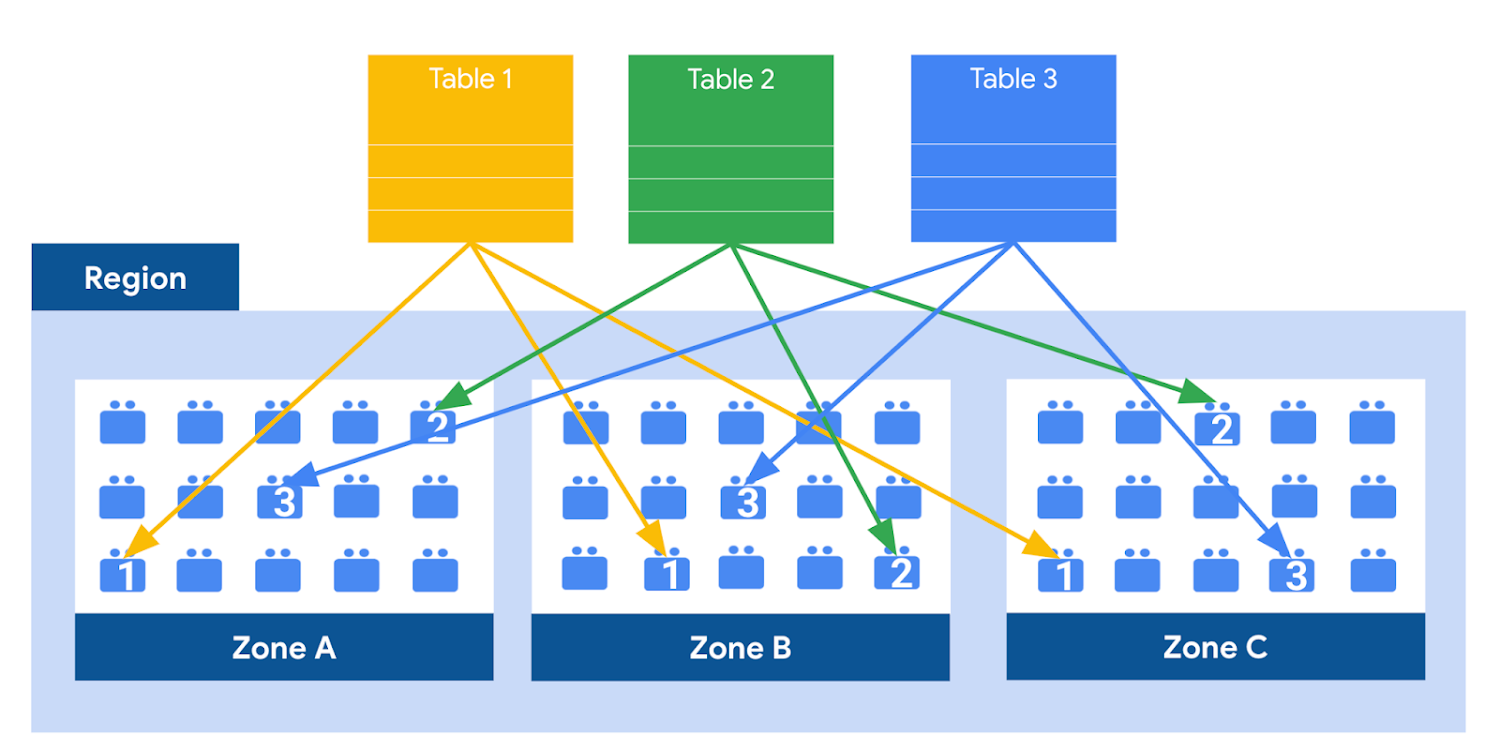
This means data is saved in a different building that has a different power system and network. The chances of multiple availability zones going offline at once is very small. But if you use “Multi-Region” locations – like the US or EU – BigQuery stores another copy of the data in an off-region replica. That way, the data is recoverable in the event of a major disaster.
This is all accomplished without impacting the compute resources available for your queries. Plus encoding, encryption and replication are included in the price of BigQuery storage – no hidden costs!
Optimizing storage for query performance
BigQuery has a built-in storage optimizer that helps arrange data into the optimal shape for querying, by periodically rewriting files. Files may be written first in a format that is fast to write but later BigQuery will format them in a way that is fast to query. Aside from the optimization happening behind the scenes, there are also a few things you can do to further enhance storage.
Partitioning
A partitioned table is a special table that is divided into segments, called partitions. BigQuery leverages partitioning to minimize the amount of data that workers read from disk. Queries that contain filters on the partitioning column can dramatically reduce the overall data scanned, which can yield improved performance and reduced query cost for on-demand queries. New data written to a partitioned table is automatically delivered to the appropriate partition.
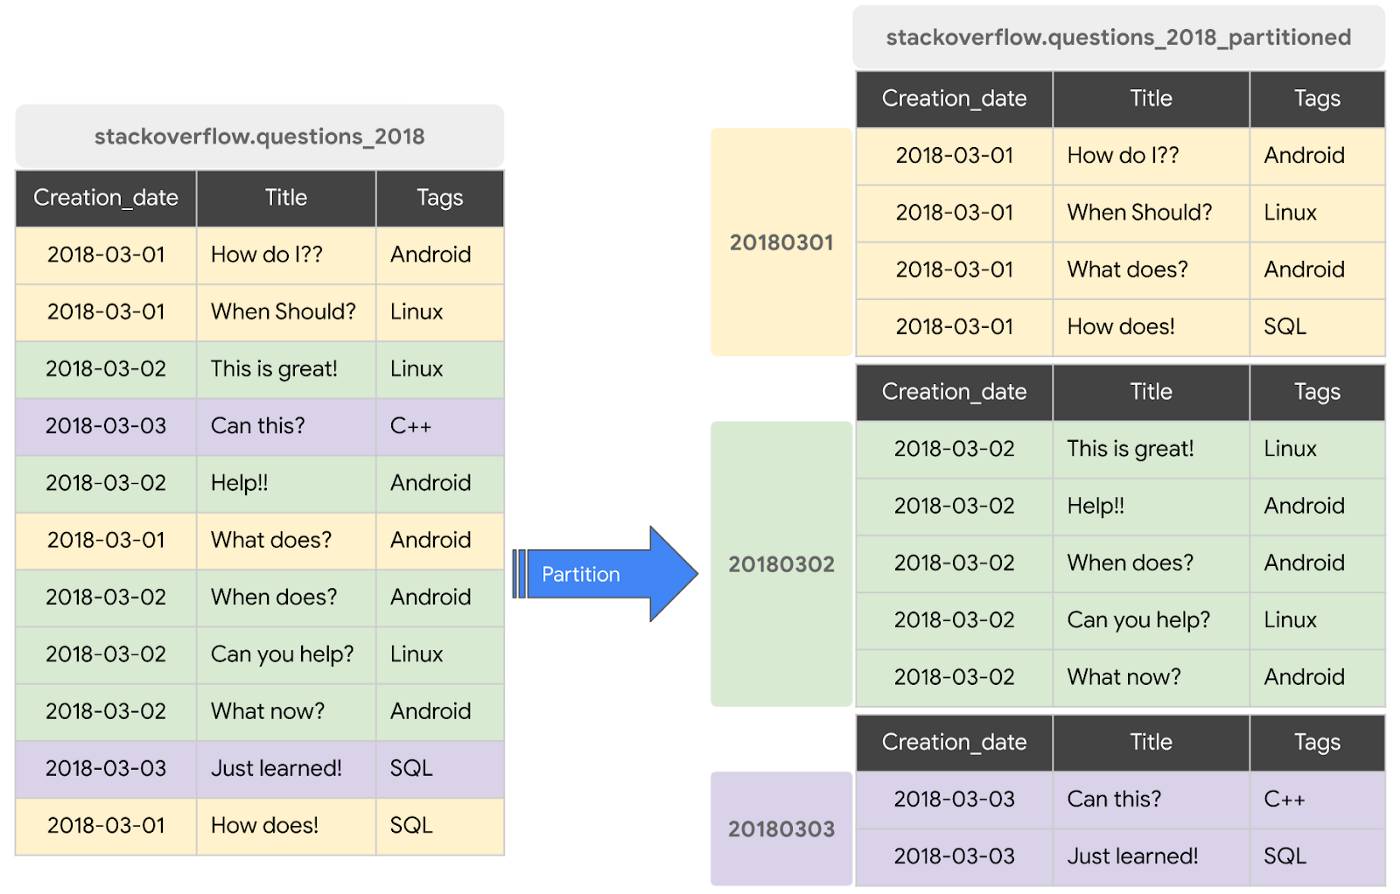
BigQuery supports the following ways to create partitioned tables:
- Ingestion time partitioned tables: daily partitions reflecting the time the data was ingested into BigQuery. This option is useful if you’ll be filtering data based on when new data was added. For example, the new Google Trends Dataset is refreshed each day, you might only be interested in the latest trends.
- Time-unit column partitioned tables: BigQuery routes data to the appropriate partition based on date value in the partitioning column. You can create partitions with granularity starting from hourly partitioning. This option is useful if you’ll be filtering data based on the date value in the table, for example looking at the most recent transactions by including a WHERE clause for transaction_created_date
- INTEGER range partitioned tables: Partitioned based on an integer column that can be bucketed. This option is useful if you’ll be filtering data based on an integer column in the table, for example focusing on specific customers using customer_id. You can bucket the integer values to create appropriately sized partitions, like having all customers with IDs from 0-100 in the same partition.
Partitioning is a great way to optimize query performance, especially for large tables that are often filtered down during analytics. When deciding on the appropriate partition key, make sure to consider how everyone in your organization is leveraging the table. For large tables that could cause some expensive queries, you might want to require partitions to be used.
Partitions are designed for places where there is a large amount of data and a low number of distinct values. A good rule of thumb is making sure partitions are greater than 1 GB. If you over partition your tables, you’ll create a lot of metadata – which means that reading in lots of partitions may actually slow down your query.
Clustering
When a table is clustered in BigQuery, the data is automatically sorted based on the contents of one or more columns (up to 4, that you specify). Usually high cardinality and non-temporal columns are preferred for clustering, as opposed to partitioning which is better for fields with lower cardinality. You’re not limited to choosing just one, you can have a single table that is both partitioned and clustered!
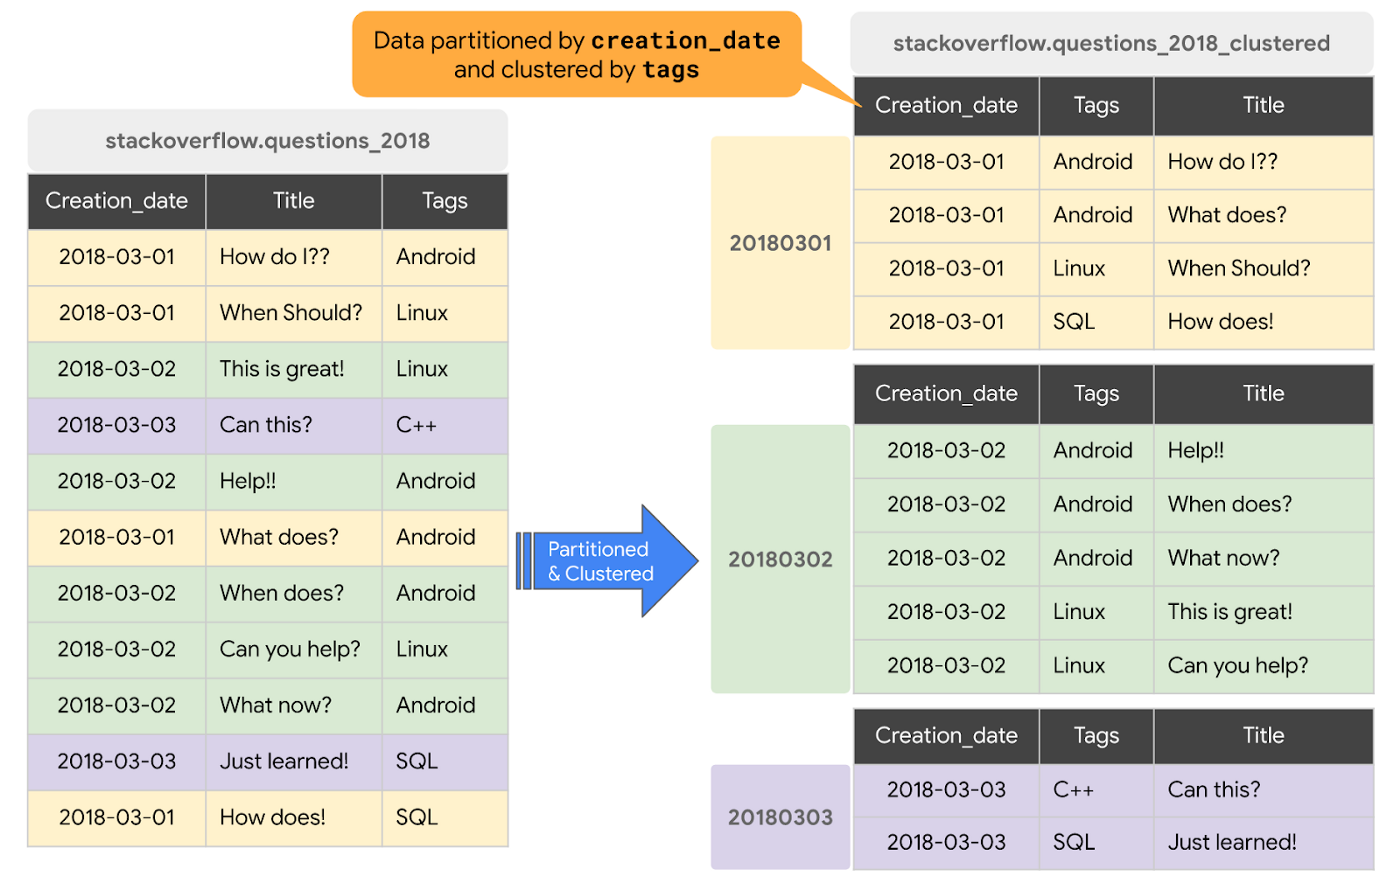
The order of clustered columns determines the sort order of the data. When new data is added to a table or a specific partition, BigQuery performs free, automatic re-clustering in the background. Specifically, clustering can improve the performance for queries:
- Containing where clauses with a clustered column: BigQuery uses the sorted blocks to eliminate scans of unnecessary data. The order of the filters in the where clause matters, so use filters that leverage clustering first
- That aggregate data based on values in a clustered column: performance is improved because the sorted blocks collocate rows with similar values
- With joins where the join key is used to cluster the table: less data is scanned, for some queries this offers a performance boost over partitioning!
Looking for some more information and example queries? Check out this blog post!
Denormalizing
If you come from a traditional database background, you’re probably used to creating normalized schemas – where you optimize your structure so that data is not repeated. This is important for OLTP workloads (as we discussed earlier) because you’re often making updates to the data. If your customer’s address is stored every place they have made a purchase, then it might be cumbersome to update their address if it changes.
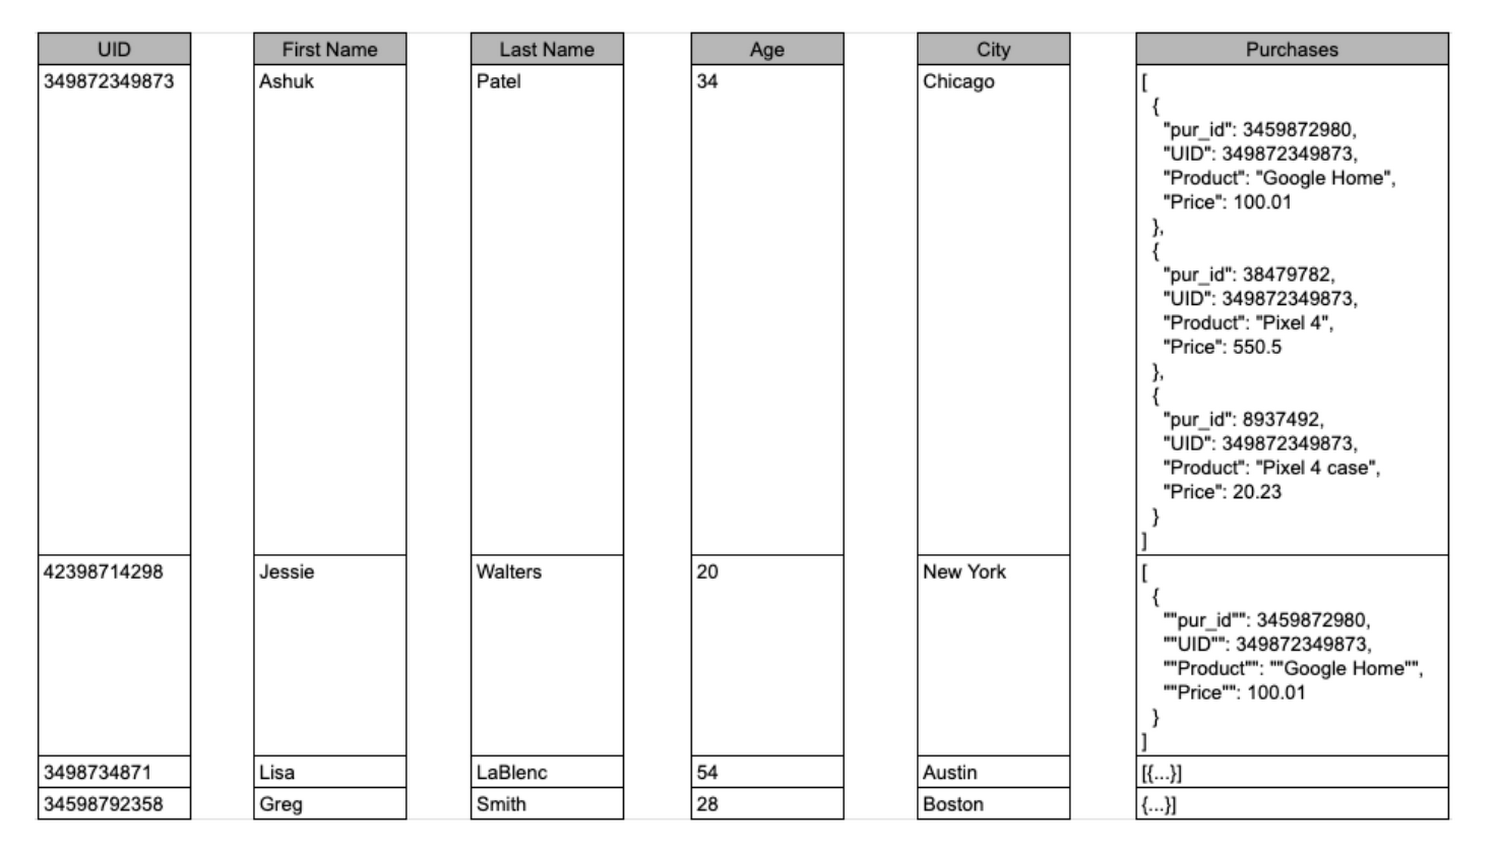
However, when performing analytical operations on normalized schemas, usually multiple tables need to be joined together. If we instead denormalize our data, so that information (like the customer address) is repeated and stored in the same table, then we can eliminate the need to have a JOIN in our query. For BigQuery specifically, we can also take advantage of support for nested and repeated structures. Expressing records using STRUCTs and ARRAYs can not only provide a more natural representation of the underlying data, but in some cases it can also eliminate the need to use a GROUP BY statement. For example, using ARRAY_LENGTH instead of COUNT.
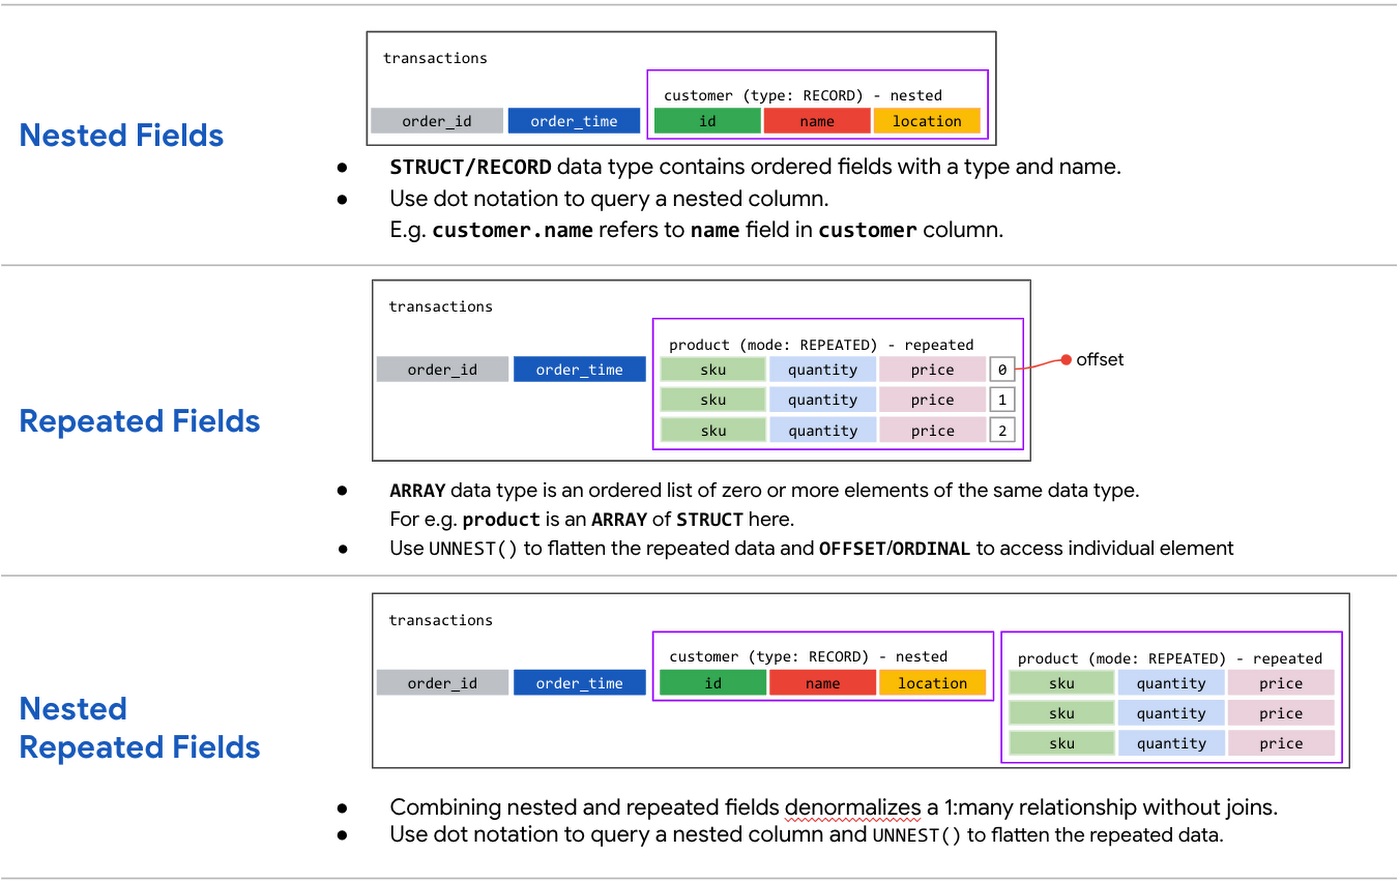
Keep in mind that denormalization has some disadvantages. First off, they aren’t storage-optimal. Although, many times the low cost of BigQuery storage addresses this concern. Second, maintaining data integrity can require increased machine time and sometimes human time for testing and verification. We recommend that you prioritize partitioning and clustering before denormalization, and then focus on data that rarely requires updates.
Optimizing for storage costs
When it comes to optimizing storage costs in BigQuery, you may want to focus on removing unneeded tables and partitions. You can configure the default table expiration for your datasets, configure the expiration time for your tables, and configure the partition expiration for partitioned tables. This can be especially useful if you’re creating materialized views or tables for ad-hoc workflows, or if you only need access to the most recent data.
Additionally, you can take advantage of BigQuery’s long term storage. If you have a table that is not used for 90 consecutive days, the price of storage for that table automatically drops by 50 percent to $0.01 per GB, per month. This is the same cost as Cloud Storage Nearline, so it might make sense to keep older, unused data in BigQuery as opposed to exporting it to Cloud Storage.Thanks for tuning in this week! Next week, we’re talking about query processing – a precursor to some query optimization techniques that will help you troubleshoot and cut costs. Be sure to stay up-to-date on this series by following me on LinkedIn and Twitter!
What Swiggy and You Can Learn From This Company’s Use of ML to Engage Customers

9623
Of your peers have already read this article.
1:45 Minutes
The most insightful time you'll spend today!
The app economy has enabled a huge range of unique business models to flourish. One such model is online food ordering and delivery services, in which apps leverage geo-location data to aggregate local food choices and offer personalized options to consumers.
A leading company in this space is Just Eat. Launched in the UK in 2001 with a vision of ‘serving the world’s greatest menu. Brilliantly.’ The company has capitalized on the popularity of online food delivery and grown its presence across 12 markets.
Just Eat acts as an intermediary between take-out food outlets and hungry customers, giving local restaurants access to a broader base of potential diners, while providing consumers with an easy and secure way to order and pay for food from their favourite restaurants.
Today the company helps 27 million customers find food from more than 112,000 restaurants—everything from homemade Italian pasta, to Chinese noodle bowls, to fish-and-chips.
Data is the fuel of Just Eat’s rapid growth, but it wasn’t always looked at that way. In its early days, Just Eat struggled with the deluge of information and faced fragmentation across its systems. In fact, the company realized its legacy data vendor wasn’t capable of ingesting 90 percent of the data produced by its food platform. This was incredibly frustrating for Just Eat’s analysts and data scientists, who had to waste time cleaning up sources instead of leveraging the data to create a better user experience.
Just Eat turned to Google Cloud, and now uses machine learning (ML) to power sophisticated consumer recommendations on both its app and website. It also makes heavy use of features offered by Google Cloud Platform, including BigQuery for running analytics on its customer data set and Cloud Pub/Sub for messaging app users with relevant offers in real-time.
Having all of Just Eat’s data in one platform has translated into real value for its customers. With Google Cloud tools, Just Eat has created its own proprietary Customer Ontology framework, which today contains 5.5 billion features that better understand consumers’ behavior and food habits, and provides insights into previous visits.
Just Eat recently created an “Adventurous Index” to map its customers according to their ordering habits, enabling them to tailor their marketing and user experiences. For example, mid-adventurous customers are shown a choice of restaurants that serve their most ordered cuisine, while adventurous customers can choose from restaurants that serve a wider variety. This not only has prompted consumers to be more adventurous with their choices, but also has led to more business at a more diverse set of restaurants.
Matt Cresswell, Director of Customer Platforms at Just Eat said that Google Cloud has become integral to its product delivery: “Consumer food choice is a hugely nuanced topic. We know that individuals have their own unique journeys when they use Just Eat. We’ve sought to create a truly one-to-one relationship with every customer. The changes we’ve made to the platform mean they can access the dishes they enjoy at the touch of a fingertip, and find inspiration to discover new dishes they’ll love. We’re grateful to Google Cloud for helping us support our customers on their culinary explorations.”
Migrating From Oracle OLTP System to Cloud Spanner

3970
Of your peers have already read this article.
8:30 Minutes
The most insightful time you'll spend today!
Spanner uses certain concepts differently from other enterprise database management tools, so you might need to adjust your application to take full advantage of its capabilities. You might also need to supplement Spanner with other services from Google Cloud to meet your needs.
Migration constraints
When you migrate your application to Spanner, you must take into account the different features available. You probably need to redesign your application architecture to fit with Spanner’s feature set and to integrate with additional Google Cloud services.
Stored procedures and triggers
Spanner does not support running user code in the database level, so as part of the migration, you must move business logic implemented by database-level stored procedures and triggers into the application.
Sequences
Spanner does not implement a sequence generator, and as explained below, using monotonically increasing numbers as primary keys is an anti-pattern in Spanner. An alternative way to generate a unique primary key is to use a random UUID.
If sequences are required for external reasons, then you must implement them in the application layer.
Access controls
Spanner supports only database-level access controls using IAM access permissions and roles. Predefined roles can give read-write or read-only access to the database.
If you require finer grained permissions, you must implement them at the application layer. In a normal scenario, only the application should be allowed to read and write to the database.
If you need to expose your database to users for reporting, and want to use fine-grained security permissions (such as table- and view-level permissions), you should export your database to BigQuery.
Read the full article for more, including
- Data validation constraints
- Supported data types
- Migration process
- Transferring your data from Oracle to Spanner
- Maintaining consistency between both databases
- Verifying data consistency
- and more.
More Relevant Stories for Your Company

Guide for Measuring Cloud Spanner Performance for Your Custom Workload
Database migration to a new database platform or technology can be daunting for various reasons. One of the common concerns is database performance. It is hard to evaluate database performance early in the evaluation cycle without performing actual data migration and application changes. This becomes even more important in the

Choose the Right Google Database Service With This Chart
A growing number of Indian enterprises are leveraging the Google Cloud to run their database workloads. This is because Google Cloud offers fully managed, scalable database services to support all applications today and tomorrow. In fact, Forrester has named Google as a Leader in The Forrester Wave™: Database-as-a-Service, Q2 2019.

Partnering with Google Cloud is the Key Behind Recent Healthcare Innovations
It’s simply amazing to witness how some of our systems integrators employ Google Cloud solutions to drive innovation in ways we at Google may never have considered—especially in healthcare. According to analyst firm MarketsandMarkets, the market for the Cloud in healthcare is projected to grow 43% between 2020 and 2025

Transform ‘Dark Data’ from Documents with Document AI, Cloud Functions and Workflows
At enterprises across industries, documents are at the center of core business processes. Documents store a treasure trove of valuable information whether it's a company's invoices, HR documents, tax forms and much more. However, the unstructured nature of documents make them difficult to work with as a data source. We
