





3505
Of your peers have already downloaded this article
19:30 Minutes
The most insightful time you'll spend today!
Query Insights for Spanner: A blessing for developers and DBAs

3297
Of your peers have already read this article.
1:30 Minutes
The most insightful time you'll spend today!
Today, application development teams are more agile and are shipping features faster than ever before. In addition to these rapid development cycles and the rise of microservices architectures, the end-to-end ownership of feature development (and performance monitoring) has moved to a shared responsibility model between advanced database administrators and full-stack developers. However, most developers don’t have the years of experience or the time needed to debug complex query performance issues and database administrators are now a scarce resource in most organizations. As a result, there is a dire need for tools for developers and DBAs alike to quickly diagnose performance issues.
Introducing Query Insights for Spanner
We are delighted to announce the launch of Query Insights for Spanner, a set of visualization tools that provide an easy way for developers and database administrators to quickly diagnose query performance issues on Spanner. Using Query Insights, users can now troubleshoot query performance in a self-serve way. We’ve designed Query Insights using familiar design patterns with world-class visualizations to provide an intuitive experience for anyone who is debugging issues with query performance on Spanner. Query Insights is available at no additional cost.
By using out-of-the-box visual dashboards and graphs, developers can visualize aberrant behavior like peaks and troughs in various performance metrics over a time-series and quickly identify problematic queries. Time series data provides significant value to organizations because it enables them to analyze important real-time and historical metrics. Data is valuable only if it’s easy to comprehend;. that’s where being able to view intuitive dashboards becomes a force multiplier for organizations looking to expose their time series data across teams.
Follow a visual journey with pre-built dashboards
With Query Insights, developers can seamlessly move from detection of database performance issues to diagnosis of problematic queries using a single interface. Query Insights will help identify query performance issues easily with pre-built dashboards.
The user could do this by following a simple journey where they can quickly confirm, identify and analyze query performance issues. Let’s walk through an example scenario.
Understand database performance
This journey will start by the user setting up an alert on Google Cloud Monitoring for CPU utilization going above a certain threshold. The alert could be configured in a way that if this threshold is crossed, the user will be notified with an email alert, with a link to the “Monitoring” dashboard.
Once the user receives this alert, they would click on the link in the email, and navigate to the “Monitoring” dashboard. If they observe high CPU Utilization and high read latencies, the possible root cause could be expensive queries. A spike in CPU Utilization could be a strong signal that the system is using more compute than it usually would, due to an inefficient query.
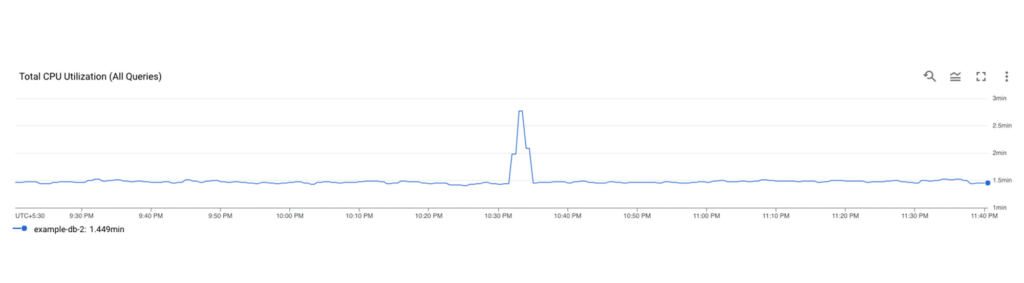
The next step is to identify which query might be the problem, this is where Query Insights comes in. The user can get to this tool by clicking on Query Insights in the left navigation of your Spanner Instance. Here, they can drill down into the CPU usage by query and observe that for a specific database, CPU Utilization (attributed to all queries) is spiking for a particular time window. This confirms that the CPU utilization is due to inefficient queries.
Identifying a problematic query
The user now observes the TopN (Top queries by CPU Utilization) query graph to see the TopN queries by CPU Utilization. From the graph, it is very easy to visualize and identify the top queries which could be causing the spike in CPU Utilization.
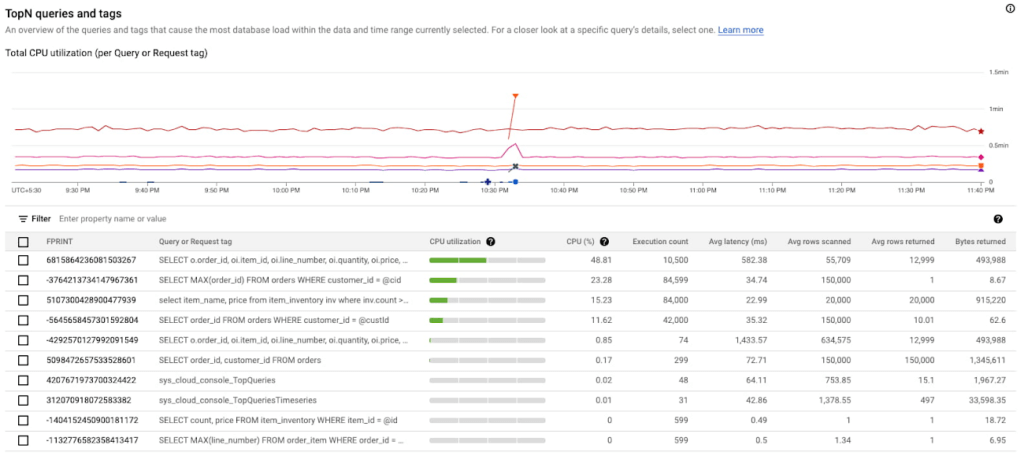
In the above screenshot, we can see that the first query in the table is showing a clear spike at 10:33 PM consuming 48.81% of total CPU. This is a clear indication that this query could be problematic, and the user should investigate further.
Analyzing the query performance
Once they have identified the problematic query, they can now drill down into this query shape to confirm, identify the root cause of the high CPU utilization.
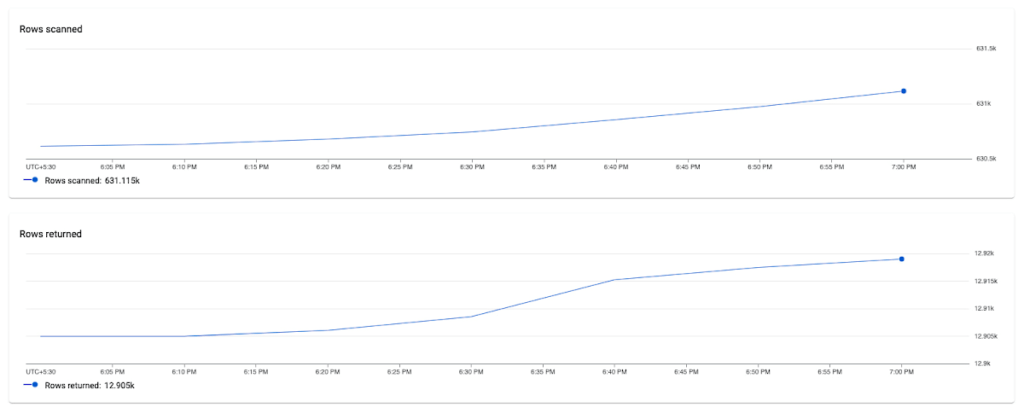
They can do this by clicking on the Fingerprint ID for the specific query from the topN table, and navigating to the Query Details page where they will be able to see a list of metrics (Latency, CPU Utilization, Execution count, Rows Scanned / Rows Returned) over a time series for that specific query.
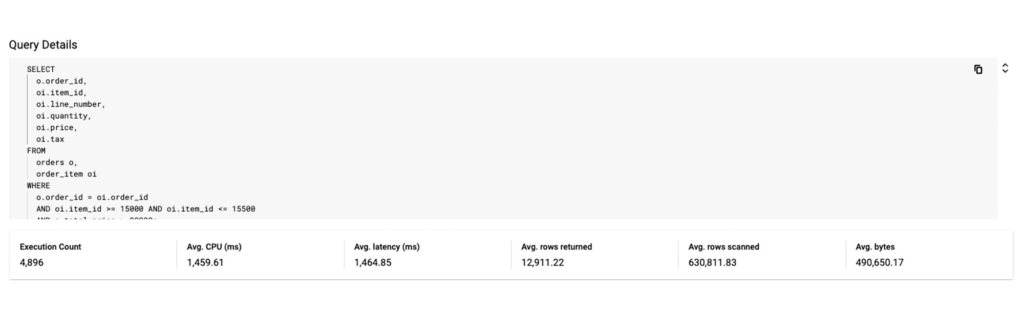
In this example, we notice that the average number of rows scanned for this specific query are very high (~ 600k rows scanned to return ~ 12k rows), which could point to a poor query design, resulting in an inefficient query. We can also observe that latency is high (1.4s) for this query.
Fixing the issue
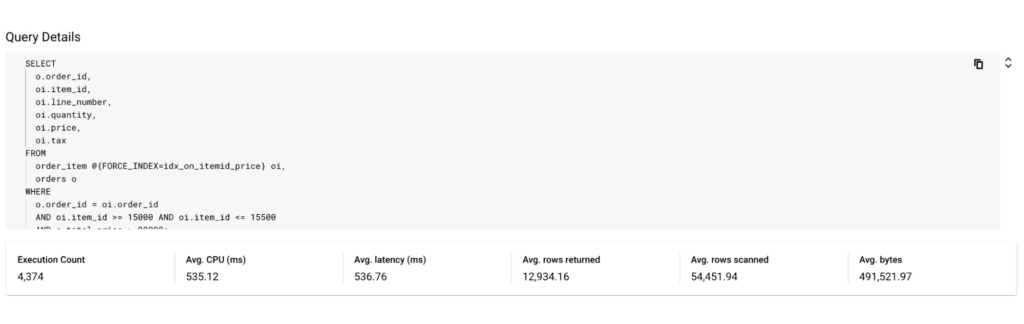
To fix the problem in this scenario, the user could optimize this query by specifying a secondary index in the query using a FORCE_INDEX query hint to provide an index directive. This would provide more consistent performance, make the query more efficient, and lower CPU utilization for this query.
In the screenshot below, you can see that after specifying the index in the query, the query performance dramatically increases in terms of CPU, rows scanned (54K vs 630k) and also in terms of query latency (536 ns vs 1.4 s).
Unoptimized Query:
Optimized Query:
By following this simple visual journey, the user can easily detect, diagnose and debug inefficient queries on Spanner.
Get started with Query Insights today
To learn more about Query Insights, review the documentation here. Query Insights is enabled by default. In the Spanner console, you can click on Query Insights in the left navigation and start visualizing your query performance metrics!
New to Spanner? Get started in minutes with a new database.
Google Cloud Helps Northwell Health to Boost Caregiver Productivity and Access to Right Care Using AI

7974
Of your peers have already read this article.
2:00 Minutes
The most insightful time you'll spend today!
Lung cancer is the leading cause of cancer death in the United States and like any cancer, early detection is crucial to survival. Screening at-risk populations is an important part of reducing mortality, and if concerning nodules are found on imaging, further testing may be required. Today, we’ll share how Northwell Health uses Google Cloud products such as Cloud Healthcare APIs and BigQuery to increase caregiver productivity and deliver better care for patients with findings that indicate potential development of lung cancer.
Northwell is New York’s largest healthcare provider
Northwell Health is New York’s largest healthcare provider with 23 hospitals and nearly 800 outpatient facilities. Northwell’s nearly 4,000 doctors care for millions of patients each year, and at this scale, there is an immense amount of healthcare data to manage. To better manage and leverage this data, Northwell Health partnered with Google Cloud starting in 2018.
Enabling caregivers to spend more time with patients
Nic Lorenzen, the lead developer of Northwell Emerging Technology and Innovation team, has a mission to put together data for caregivers in a way that makes sense. It is no secret that inefficient electronic health records systems have a negative impact on a physician’s ability to deliver quality care. Traditional EHRs have information distributed across many tabs, which forces caregivers to spend considerable time at the computer trying to find information. Moreover, speed of care matters. If care is delayed, patients may have to spend more time in the hospital and may suffer worse health outcomes.
To solve this problem, Nic’s team focused on giving caregivers the most relevant pieces of data at the right time by developing an intelligent clinician rounding app. The data needed to derive these insights can depend on the caregiver’s role–a nurse cares about different things than a cardiologist. This system aggregates multiple data sources, and provides patient-specific insights to caregivers.
This system would not have been possible before with traditional EHRs and data warehouses that have proprietary data models and rarely sync data in real time. Now with data easily accessible through Google Cloud’s Healthcare solutions, Nic’s team can deliver the right clinical information to the right people instantly. These days, Nic says, “instead of spending 75% of our time dealing with architecting the underlying platforms, we spend 75% of our time focused on higher value use cases for clinicians and patients. Google Cloud’s Healthcare solutions have greatly improved our developer productivity and time to value.”
Caregivers have found this new system to be a game changer.Before the implementation of this system, caregivers would spend, on average, seven to nine minutes finding the data needed to make medical decisions for one patient. Now, that aggregated information is delivered to a caregiver’s mobile device in less than a second.
Ensuring patients get the right care with the power of AI
There are a number of reasons why patients might not get the care that they need. For example, patients today can go to multiple hospitals and clinics settings, and coordinating care across multiple facilities is complex. Regional hospitals and clinics have their own siloed view of their data, so pertinent information gathered by one clinic might not be seen by another. These gaps in clinical data lead to gaps in patient care.
When a patient gets radiologic imaging, they may have findings unrelated to the reason they initially got the imaging. For example, a chest CT for a car accident might reveal an incidental lung nodule that could be cancerous. Unfortunately, research shows that a large portion of patients do not get follow up for these incidental findings because it isn’t the primary reason why the patient is seeing a doctor. Moreover, social determinants of health are a factor that affects which patients receive follow-up care. Identifying these patients and providing the necessary follow up care prevents adverse events related to delayed detection of cancer.

With Cloud Healthcare solutions, Northwell built an AI model to identify these patients so that oncologists can appropriately follow up with patients who have findings suspicious for lung cancer. The AI model detects incidental pulmonary nodules in radiology reports so that doctors can then contact the patients that need follow-up care. Nic says his team was able to build this system in a week: “Google Cloud did a lot of heavy-lifting for us and allowed us to get to the AI applications much faster. It allowed us to build a platform that just works.”
Healthcare systems can now rapidly generate healthcare insights with one end-to-end solution, Google Cloud Healthcare Data Engine. It builds on and extends the core capabilities of the Google Cloud Healthcare API to make healthcare data more immediately useful by enabling an interoperable, longitudinal record of patient data. Northwell Health uses Google Cloud as the core of their platform, enabling their developers to create solutions to the most pressing healthcare problems.
Special thanks to Kalyan Pamarthy, Product Management Lead on Cloud Healthcare and Natural Language APIs for contributing to this blog post.
Unlocking the Potential of Advanced Analytics with BigQuery and Connected Vehicle Data

2876
Of your peers have already read this article.
2:30 Minutes
The most insightful time you'll spend today!
As software-defined vehicles continue to advance and the quantity of digital services grows to meet consumer demand, the data required to provide these services continue to grow as well. This makes automotive manufacturers and suppliers look for capabilities to log and analyze data, update applications, and extend commands to in-vehicle software.
The challenges the automotive sector faces can be quantified. A modern vehicle contains upwards of 70 electronic control units (ECUs), most of which are connected to one or more sensors. Not only is it now possible to exactly measure many aspects of vehicle performance, but new options become available. Using LIDAR (light detection and ranging), for example, vehicles are achieving higher levels of autonomy; this leads to a data stream from such demanding applications that may reach 25 GB per hour. For the in-vehicle processing of data, 100 million lines of software code may be present — more than a fighter jet. This in-vehicle code will have to be maintained with updates and new functionalities.
Access to the data will allow manufacturers to gain valuable insights into operational details of their vehicles. The use of this data can help to reduce costs and risks, increase ROI, support ESG initiatives, and provide valuable insights to develop innovative solutions and shorten the time to value for Electric Vehicle innovations.
Sibros’ Deep Connected Platform (DCP) makes it possible for these manufacturers to build and launch new connected vehicle use cases from production to post-sale at scale by connecting and managing all software and data throughout every life cycle stage. A key component of this platform is the Sibros Deep Logger that provides capabilities like the following:
- Full configurability of what to record, when to record it, and how fast to record it.
- High resolution timestamps of all Controller Area Network (CAN) messages.
- Dynamic application of live log configurations to receive new data points without deploying new software.
For example, properly analyzed engine data enables true predictive maintenance for the first time, which creates the option to repair or replace components before failure happens. Another example would be the evaluation of data regarding the use of certain in-car features with the goal to redesign its interior.
Two other components of the DCP are software updates and remote commands to ECUs. The DCP on Google Cloud enables seamless integration with any vehicle architecture and provides OEMs and suppliers with the platform to manage connected vehicle data at rest and in transit using a proven and secure way on a global scale.
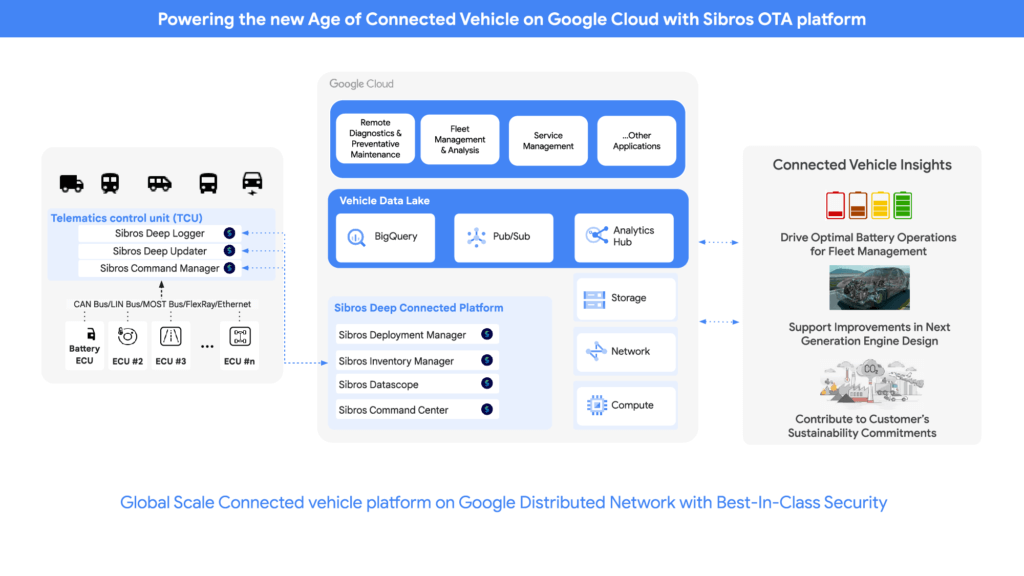
OEMs can pull data through APIs provided by Sibros into Google Data Cloud (including BigQuery) to gain access to the rich information data sets provided by the DCP within their environment and blend this data with their first party data sets to provide value insights for their business. Some of the Connected Vehicle insights that DCP information enables are:
- Damage prevention, improved operation, or development of the next generation of engines with insights from complex analyses that could consider parameters like model, engine type, mileage, overall speed, temperature, air pressure, load, services, and more.
- The combination of electric vehicle battery usage data like charging cycles, engine performance, and battery age with contributing factors as the use of the air conditioning to determine if such factors contribute to hazardous battery conditions and for improved battery development.
- Cross-organization collaboration in R&D by the provision of information on all these metrics and more from real-world driving, like engine knock data and even tire pressure.
- Google Cloud’s unified data cloud offering provides a complete platform for building data-driven applications like those from Sibros — from simplified data ingestion, processing, and storage to powerful analytics, AI, ML, and data sharing capabilities — integrated with Google Cloud. With a diverse partner ecosystem and support for multi-cloud, open-source tools and APIs, Google Cloud provides Sibros the portability and the extensibility they need to avoid data lock-in.
“Software has an ever increasing importance in the automotive world, even more so with electric vehicles and new mobility services. Google Cloud is partnering with Sibros to bring their award winning Deep Connected Platform to deliver high frequency, low latency over-the-air software updates, data logging & diagnostics capabilities to our automotive customers, leveraging the security and scale of Google Cloud. This is revolutionizing everything from development cycles to business models and customer relationships.” — Matthias Breunig, Director, Global Automotive Solutions, Google Cloud
Through Built with BigQuery, Google Cloud is helping tech companies like Sibros build innovative applications on Google’s Data Cloud with simplified access to technology, helpful and dedicated engineering support, and joint go-to-market programs.
“Sibros is looking forward to partnering with Google Cloud, which will enable vehicle manufacturers and suppliers to reach the next level in their use of data. Sibros solutions for Deep Data Logging and Updating on the Google Data Cloud, combined with Google BigQuery, will help them to mitigate risks, reduce costs, add innovative products, and introduce value-added use cases.” — Xiaojian Huang, Chief Digital Officer, Software, Sibros
Sibros and Google Cloud are driving Connected Mobility transformation to help our customers accelerate R&D innovation, power efficient operations, and unlock software-defined vehicle use cases with a full stack connected vehicle platform. Click here to learn more about Sibros on Google Cloud.
Quantum Metric Increases Business 10-fold

9268
Of your peers have already read this article.
5:30 Minutes
The most insightful time you'll spend today!
At Quantum Metric, we’re in the business of bringing our customers business insights that are based on customer experience data and analytics for mid-market and Fortune 500 companies.
Our software, powered by big data, machine intelligence, and Google Cloud, helps our customers identify, quantify, prioritize and measure opportunities to improve digital experiences.
As companies move to a more agile product lifecycle, including continuous deployment and continuous integration, they’re finding that it’s critical to receive perpetual quantified feedback and insights from their data in real time to understand where the largest opportunities exist.
Each year, billions of customer interactions are captured through browsers or mobile apps on PCs, tablets, and mobile devices. This data, fed into the Quantum Metric platform, can show if a customer had a password problem they couldn’t solve or struggled when trying to purchase something and abandoned their cart.
It also can show if the customer tried in vain to complete an online change to their service provider’s subscription, to reach tech support, or couldn’t find the size or color they were looking for while shopping online.
Most importantly, the Quantum Metric platform quantifies the business value of the issue, helping organizations prioritize where they can make the largest impact to their business.
Success overwhelms our initial architecture
Initially, the Quantum Metric experience analytics software ran on a MySQL open source relational database management system (RDBMS). The MySQL RDBMS worked great for simple queries, when there was a specific question to ask of the data.
Soon, though, we knew we needed to offer more advanced data science capabilities. Our bigger customers wanted to ask questions across very large data sets—days, weeks, months, and years worth of data. They wanted to pose iterative questions using complex filters to answer their most challenging business questions.
With more complex queries across more data, response times from our RDBMS went from 100 to 500 milliseconds to as long as 20 minutes.
That delay was slowing down our ability and time to insights, which also reduced the value we could provide to our customers, since iterative exploration and analysis requires real-time query responses. Because of the need for real-time responses, there were certain questions that we just weren’t able to ask of the data. It became clear that we needed a much more robust data warehouse solution.
There were also operational challenges with MySQL and massive-scale data ingestion. We spent a lot of time into the wee hours of the night and morning handling errors and recovering databases.
We tried to address these challenges by sharding, partitioning, and indexing the data to optimize for the types of questions customers were asking. But the problems were escalating and happening more often, from once a month across the customer base to monthly for at least 20 different customers.
We could tune the platform for today and tomorrow’s workload, with good guesses at where indexes could be used, but we simply couldn’t continue to horizontally scale MySQL in a cost-efficient and operationally efficient manner.
Speed breeds innovation
Once we started exploring options that could better scale with our business, we looked at NoSQL technologies like Cassandra (a partitioned row-store database), MySQL’s Column Store (a columnar store database), and Vertica (a columnar store database)—each with unique ways of handling data storage and accessibility.
But with high volumes of complex queries across large data stores, all of these solutions began to fail, bogged down with multiple, simultaneous users. We could have solved the problems with more raw compute and storage, but it would have been prohibitively expensive to run and require a large team to operate.
We then decided to try BigQuery, and it was transformative.
We connected our front end to BigQuery via APIs. Once data is 15 minutes old, it is automatically extracted, loaded, and transformed (ETL) to BigQuery.
We continuously update the legacy MySQL RDBMS so its data is integrated with BigQuery data when queries require real-time data. Most query response times are within 100-200 milliseconds, matching what we initially experienced with MySQL.
When traffic from our customers scales up, we can now scale on-demand to accommodate it, thanks to BigQuery’s hundreds of thousands of CPUs. Our customers no longer run into slow response times, and we’ve gained confidence that we can offer them—and their users—advanced insights and better experiences without delay.
More importantly, with this scale of query power, we were able to build data science algorithms into the platform, which iteratively query BigQuery based on the results, and help quantify the impact of a specific issue to a specific segment of users. Adding these capabilities was possible because of the massive scale of BigQuery.
In addition to new insights and fast response times, we wanted our customers to be able to ask complex questions using very simple language.
For example: “Show me high-loyalty customers, located in specific geographic areas, who visited the web site at least five times, based on specific campaigns, and never booked a seat on a flight.”
This was exactly the kind of query that was used by a major U.S. airline to understand the multi-million dollar impact of a failure affecting their most valuable customers: their high-loyalty members.
And this was all done while maintaining the highest standard of care of customer data and privacy by default, using multiple layers of encryption of data in transit, at rest, and a unique military-grade encryption approach. This approach encrypts PII, including even session cookies, with a RSA-2048 key available only to a select few and used for use cases such as fraud analysis.
It’s no exaggeration to say that BigQuery has totally transformed our business. It provides the petabyte scale and speed we were missing, in addition to taking care of operational maintenance, a task that was burying our team with MySQL.
We’re now able to support some of the largest companies in the world that require real-time, petabyte-scale analytics. That lets them serve more customers faster with higher quality, and take advantage of BigQuery’s power and scale to innovate.
There are other cloud solutions that can address petabyte analytics, but the most unique value proposition of BigQuery was its on-demand scaling and operational management, with extremely cost-effective pay-as-you-go billing. While today we are at a scale where we have round-the-clock querying needs, our early days had very sporadic query loads where we needed instant scale, then a long lull of nothing. The unique business model of BigQuery’s pay-by-bytes-scanned allowed us to have access to a massive-scale querying platform without breaking the bank.
Using BigQuery powers better customer experience and reduces purchasing friction
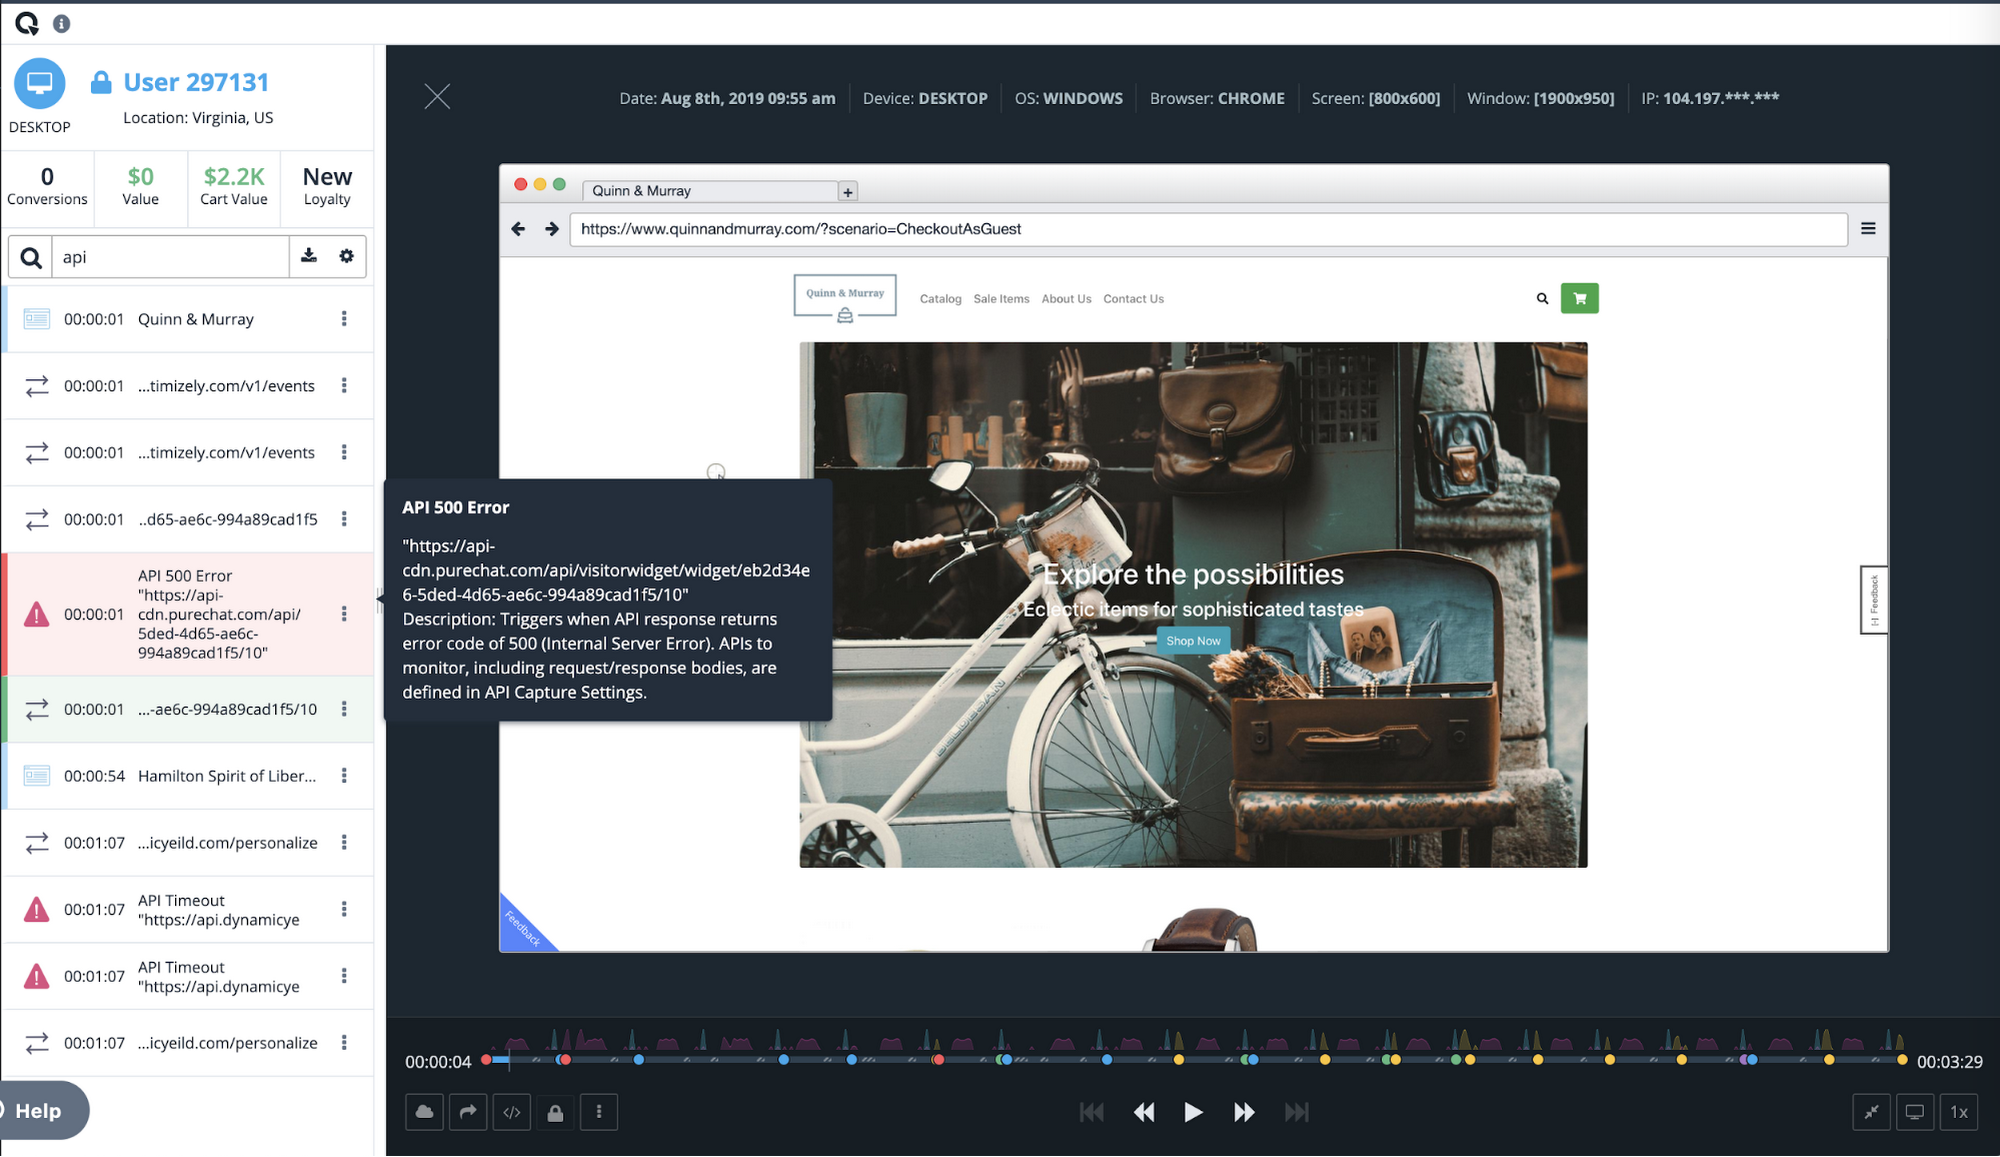
Among the many features of Quantum Metric is the ability to replay online customer sessions. In the example below from a mobile e-commerce site, each action is displayed chronologically. Why did this customer’s transaction fail?
Diving deeper, the session replay shows that the user tried to change the item quantity in the checkout cart, which resulted in a failed API call. Powered by BigQuery, Quantum Metric can then show how many other end users had this issue, with a simple click of “Show More Errors Like This.”
With BigQuery’s massive scale, Quantum Metric will then quantify the impact of that issue, so companies can prioritize which issues need attention immediately. If this is the issue that’s impacting the business the most, our customer can use a single click to open a Jira ticket, forwarding the discovery to their product and engineering teams. Those teams can then re-engineer the experience in near-real time, addressing the failed API call and cutting out the frustrating time it takes for engineers to reproduce the issue.
Once we had a powerful back end in BigQuery, we realized that Quantum Metric’s platform could be used to ask complex questions from vast datasets. We built some of the processes that data scientists use to formulate those queries right into our product.
For example, we added one series of processes to our platform to help customers understand whether a suspect issue is really impacting end-user experience. Is it something that should be prioritized and fixed? Does this really affect the user experience? Does it have financial impact? These and other questions can be pre-defined as a complex query in Quantum Metric to let our customer quickly gain insight on how an issue is impacting the business. Customers were blown away when they heard this was possible. It was the holy grail for what they were looking for in data science. It really sets us apart from our competition.
Today, with every company heavily dependent on data, those companies that can uncover and act on insights fastest are the ones that will succeed. BigQuery gives us the data warehouse platform we need to provide our customers with fast, reliable technology tools. It frees us from having to deal with the minutiae of technology infrastructure operations, so we can focus on finding and extracting the magic in customer data. With the power and scale of BigQuery, combined with the real-time capture of every user experience with 100% fidelity, we’re able to offer a self-service analytics platform that provides insights into digital journey friction points and acts as the indisputable arbitrator of truth.
Ahead of the Curve: 5 Data and AI Trends Set to Shape 2023

2266
Of your peers have already read this article.
4:00 Minutes
The most insightful time you'll spend today!
How will your organization manage this year’s data growth and business requirements? Your actions and strategies involving data and AI will improve or undermine your organization’s competitiveness in the months and years to come. Our teams at Google Cloud have an eye on the future as we evolve our strategies to protect technology choice, simplify data integration, increase AI adoption, deliver needed information on demand, and meet security requirements.
Google Cloud worked with* IDC on multiple studies involving global organizations across industries in order to explore how data leaders are successfully addressing key data and AI challenges. We compiled the results in our 2023 Data and AI Trends report. In it, you’ll find the metrics-rich research behind the top five data and AI trends, along with tips and customer examples for incorporating them into your plans.

1: Show data silos the door
Given the increasing volumes of data we’re all managing, it’s no surprise that siloed transactional databases and warehousing strategies can’t meet modern demands. Organizations want to improve how they store, manage, analyze, and govern all their data, while reducing costs. They also want to eliminate conflicting insights from replicated data and empower everyone with fresh data.
A unified data cloud enables the integration of data and insights into transformative digital experiences and better decision making.
Andi Gutmans, GM and VP of Engineering for Databases, Google Cloud
In the report, you can learn how to adopt a unified data cloud that supports every stage of the data lifecycle so that you can improve data usage, accessibility, and governance. Inform your strategy by drawing on organizations’ examples such as a data fabric that improves customer experiences by connecting more than 80 data silos, as well as other unified data clouds that save money and simplify growth.

2: Usher in the age of the open data ecosystem
Data is the key to unlocking AI, speeding up development cycles, and increasing ROI. To protect against data and technology lock-in, more organizations are adopting open source software and open APIs.
Tweet this quote
Understand how you can simplify data integration, facilitate multicloud analytics, and use the technologies you want with an open data ecosystem, as described in the report. Learn from metrics about global open source adoption and public dataset usage. And explore how global companies adopted open data ecosystems to improve patient outcomes, increase website traffic by 25%, and cut operating costs by 90%.

3: Embrace the AI tipping point
Pulling useful information out of data is easier with AI and ML. Not only can you identify patterns and answer questions faster but the technologies also make it easier to solve problems at scale.
We’ve reached the AI tipping point. Whether people realize it or not, we’re already using applications powered by AI—every day. Social media platforms, voice assistants, and driving services are easy examples.
June Yang, VP, Cloud AI and Industry Solutions, Google Cloud
Organizations share how they’re reaching their goals using AI and ML by empowering “citizen data scientists” and having them focus on small wins first. Gain tips from Yang and other experts for developing your AI strategy. And read how organizations achieve outcomes such as a reduction of 7,400 tons per year in carbon emissions and a more than 200% increase in ROI from ad spend by using pattern recognition and other AI capabilities.

4: Infuse insights everywhere
Yesterday’s BI solutions have led to outdated insights and user fatigue with the status quo, based on generic metrics and old information. Research shows that as new tools come online, expectations for BI are changing, with companies revising their strategies to improve decision making, speed up the development of new revenue streams, and increase customer acquisition and retention by providing individuals with needed information on demand.
Organizations are equipping business decision-makers with the tools they need to incorporate required insights into their everyday workflows.
Kate Wright, Senior Director, Product Management, Google Cloud
In the report, you’ll discover why and how data leaders are rethinking their BI analytics strategies and applications to improve users’ trust and use of data in automated workflows, customizable dashboards, and on-demand reports. Global companies also share how they improve decision making with self-service BI, customer experiences with IoT analysis, and threat mitigation with embedded analytics.

5: Get to know your unknown data
Increasing data volumes can make it harder to know where and what data they store, which may create risk. Case in point: If a customer unexpectedly shares personally identifiable information during a recorded customer support call or chat session, that data might require specialized governance, which the standardized storage process may not provide.
If you don’t know what data you have, you cannot know that it’s accurately secured. You also don’t know what security risks you are incurring, or what security measures you need to take.
Anton Chuvakin, Senior Staff Security Consultant, Google Cloud
Check out the report to learn about data security risks that are often overlooked and how to develop proactive governance strategies for your sensitive data. You can also read how global organizations have increased customer trust and productivity by improving how they discover, classify, and manage their structured and unstructured data.
Be ready for what’s next
What’s exciting about these trends is that they’re enabling organizations across industries to realize very different goals using their choice of technologies. And although all the trends depend on each other, research shows you can realize measurable benefits whether you adopt one or all five.
Review the report yourself and learn how you can refine your organization’s data and AI strategies by drawing on the collective insights, experiences, and successes of more than 800 global organizations.
More Relevant Stories for Your Company
Google Cloud Helped Digitec Galaxus Personalize Over 2 Million Newsletters in a Week
Digitec Galaxus AG is the biggest online retailer in Switzerland, operating two online stores: Digitec, Switzerland's online market leader for consumer electronics and media products, and Galaxus, the largest Swiss online shop with a steadily growing range of consistently low-priced products for almost all daily needs. Known for its efficient, personalized shopping experiences,

What Drives Your Organization to be Data-driven?
Every organization has its own unique data culture and capabilities. Yet each is expected to use technology trends and solutions in the same way as everyone else. Your organization may be built on years of legacy applications, you may have developed a considerable amount of expertise and knowledge, yet you

How TapClicks’ Google Cloud Migration Makes Life Easy for Marketers
Editor’s note: In this blog post we learn how TapClicks migrated to Google Cloud to offer their marketing customers a unified platform for data management, operations, insights, and analysis. TapClicks is a smart marketing cloud, powered by data, that unifies our customer’s marketing. By choosing to migrate our core applications last
Memorystore for Redis Read Replicas to Scale App Read Requests by 6X
Modern applications need to process large-scale data at millisecond latency to provide experiences like instant gaming leaderboards, fast analysis of streaming data from millions of IoT sensors, or real-time threat detection of malicious websites. In-memory datastores are a critical component to deliver the scale, performance, and availability required by these
