





Choose the Right Google Database Service With This Chart

4758
Of your peers have already read this article.
2:30 Minutes
The most insightful time you'll spend today!
A growing number of Indian enterprises are leveraging the Google Cloud to run their database workloads.
This is because Google Cloud offers fully managed, scalable database services to support all applications today and tomorrow.
In fact, Forrester has named Google as a Leader in The Forrester Wave™: Database-as-a-Service, Q2 2019.
The first question many {$persona}s ask is: Which database type is best for my specific workload or use case? Here are two tables that will help you get that answer. Click on the images.
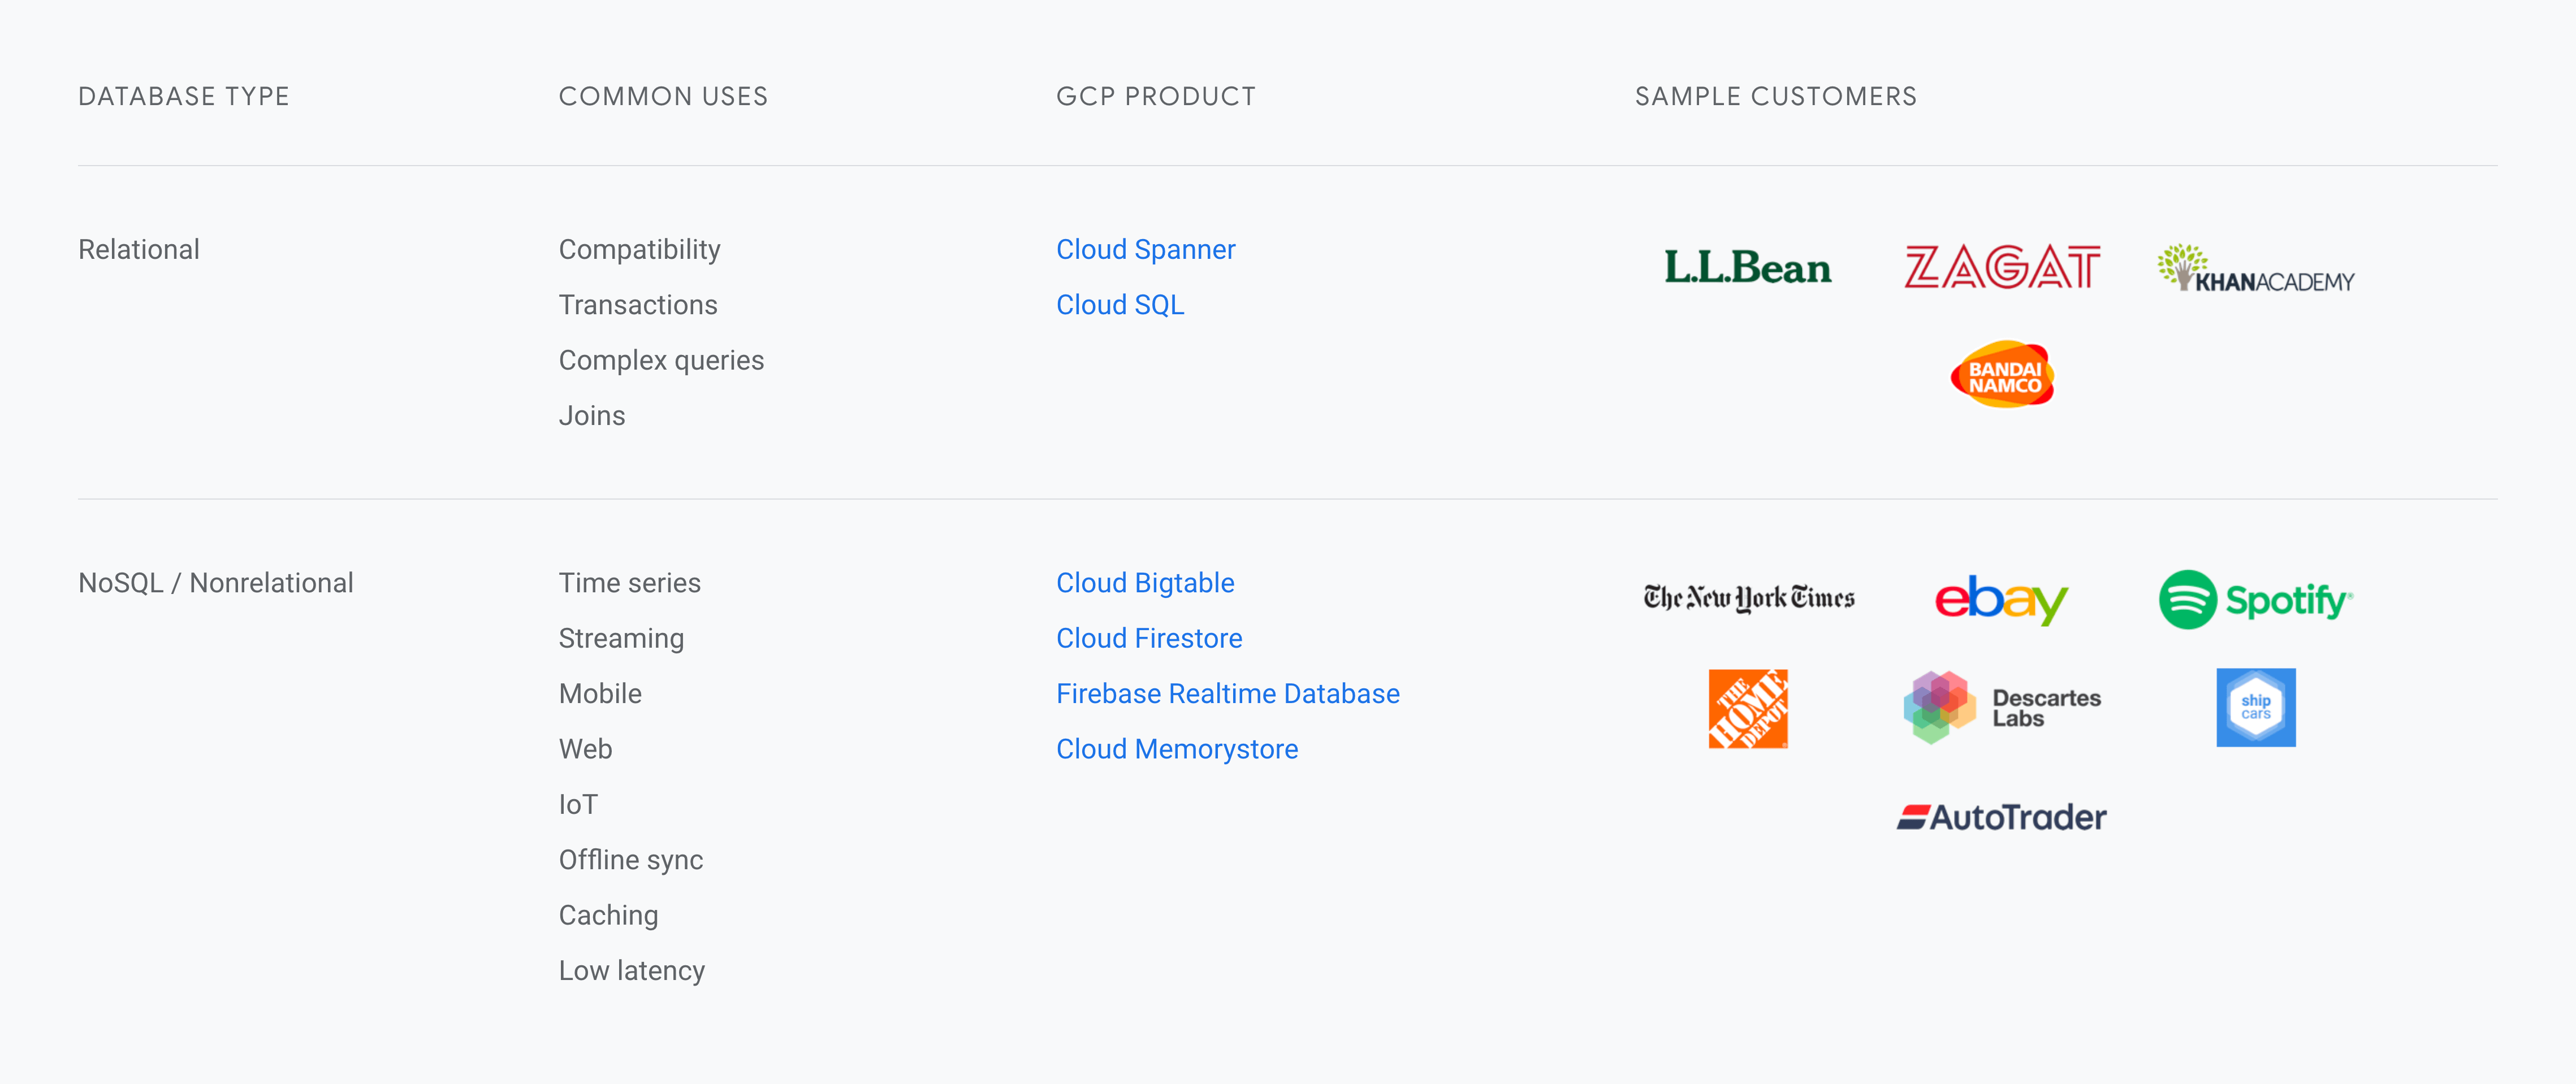
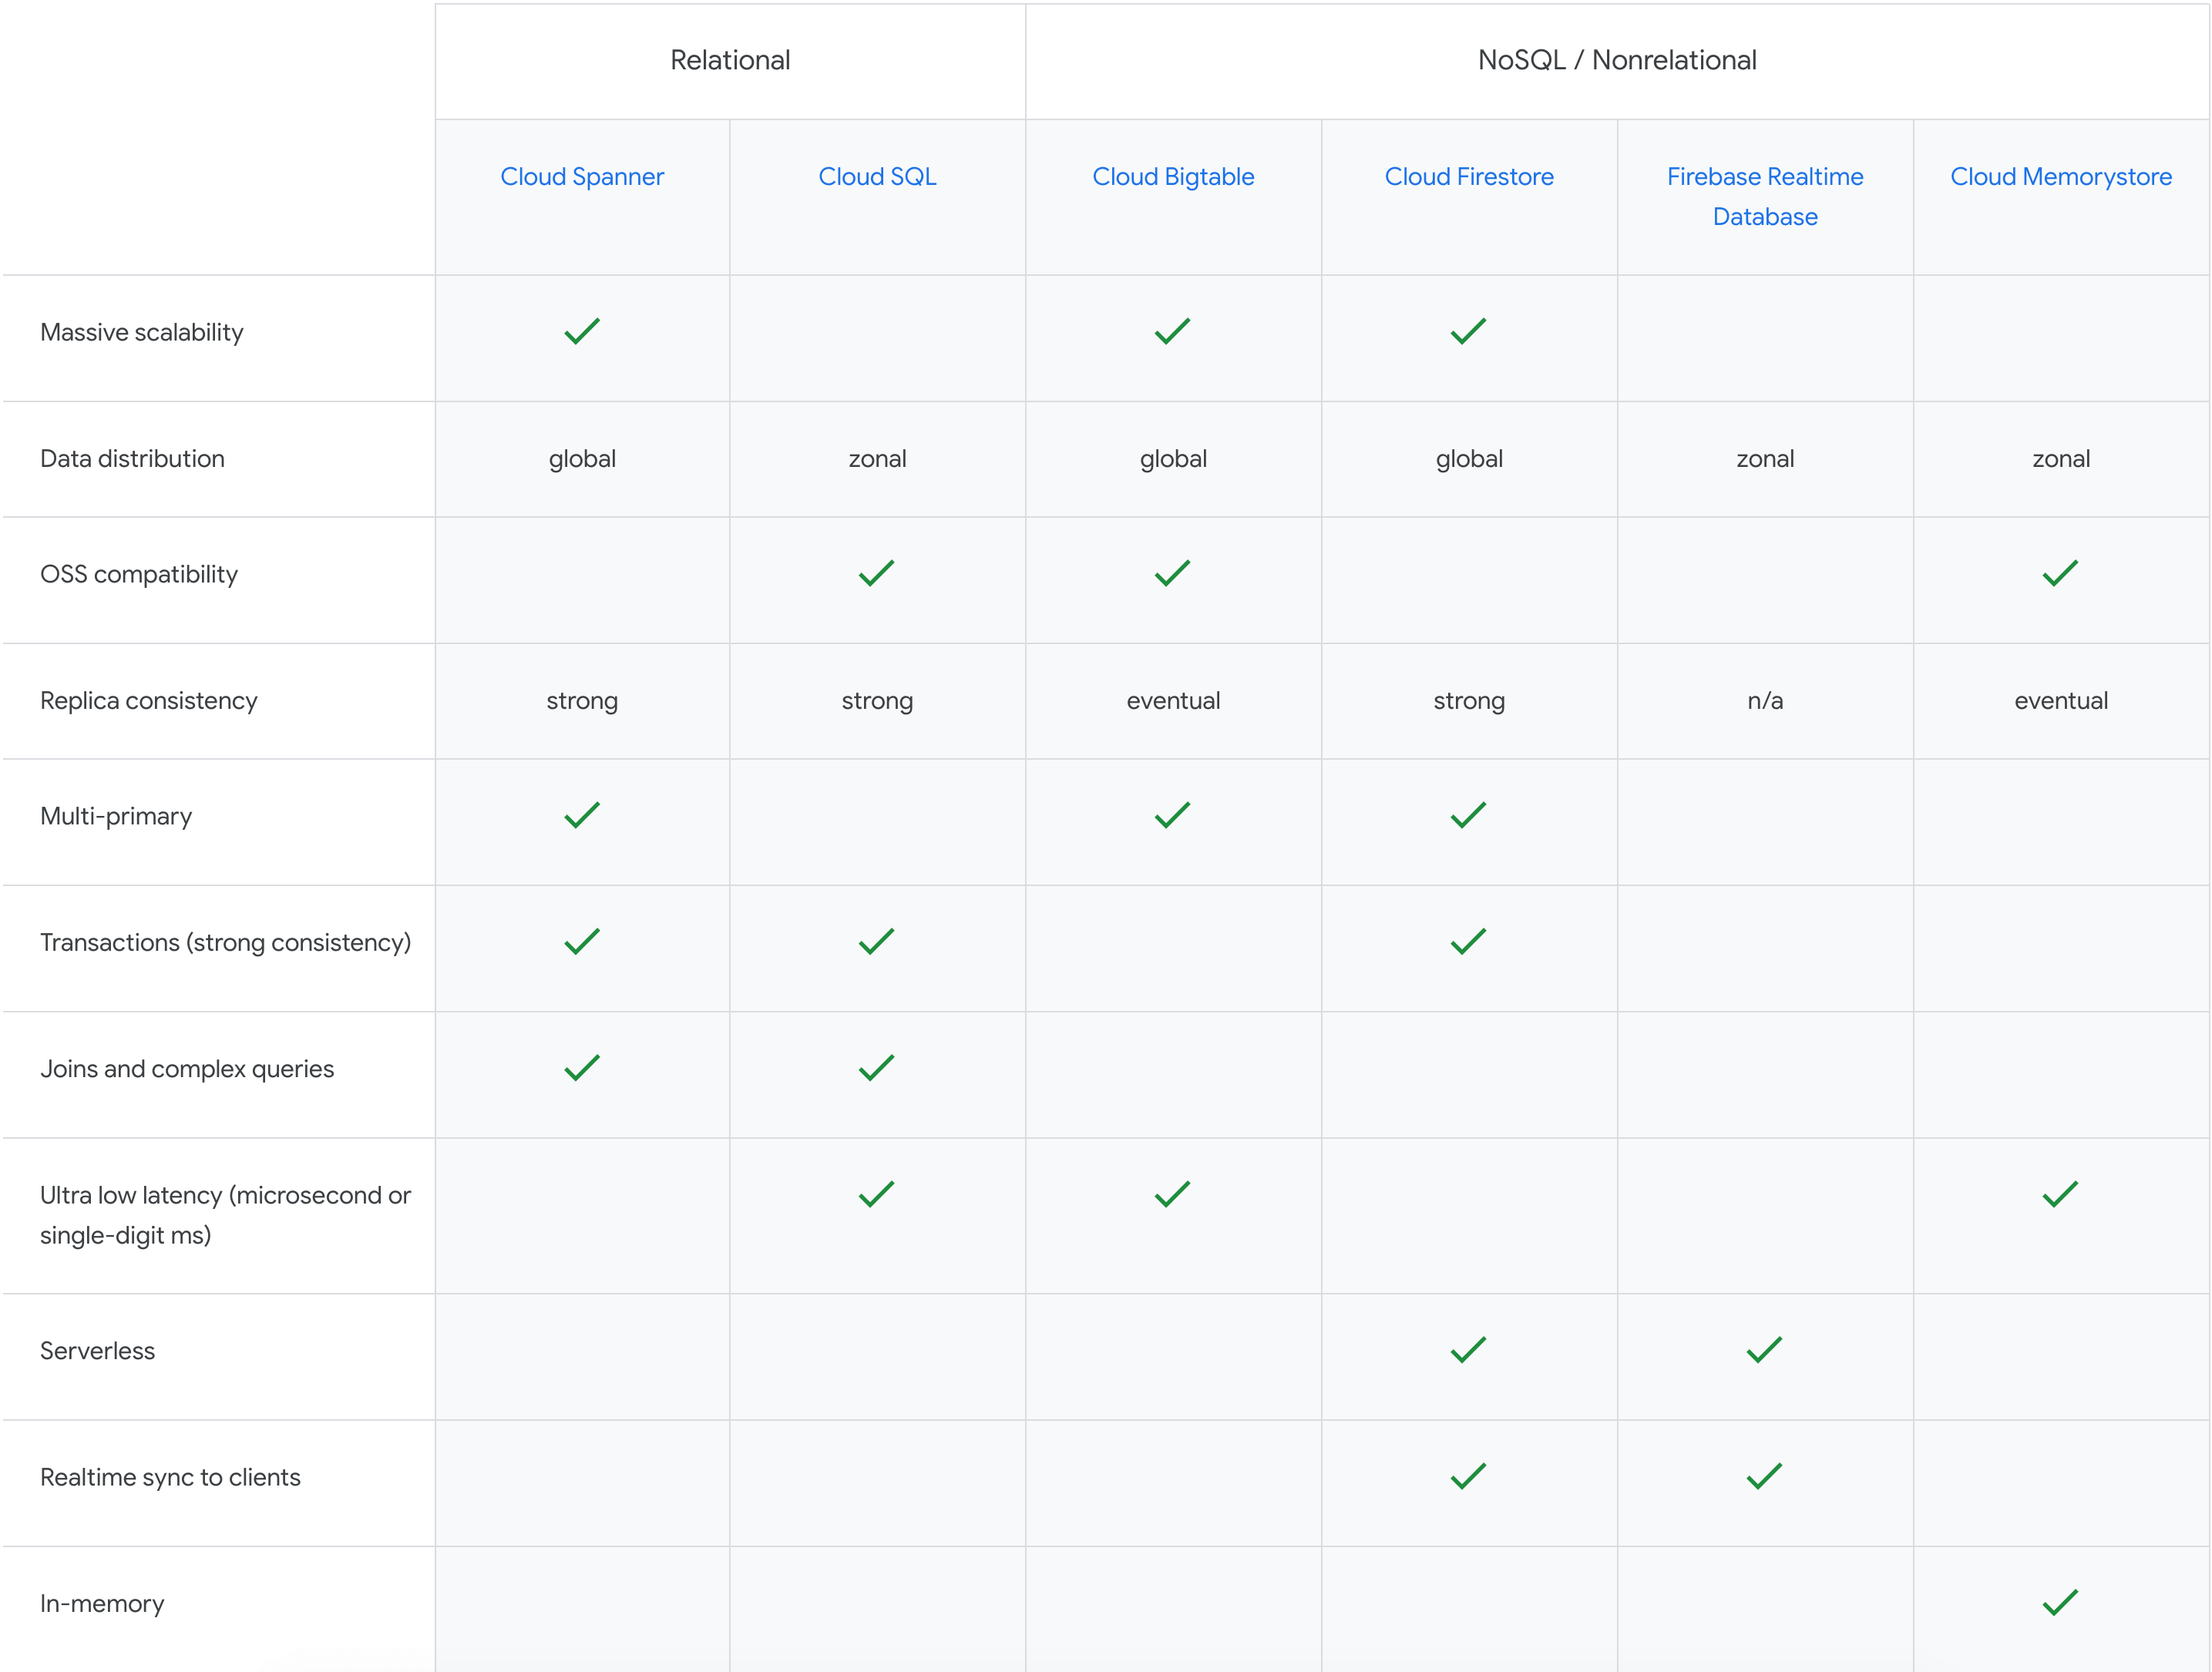
With Google Cloud database services, you can supercharge your applications, accelerate adoption with broad open-source database compatibility, and do more with your data through integrations with analytics and ML/AI.
Boost Database Performance with AlloyDB Index Advisor: The Ultimate Optimization Tool

1386
Of your peers have already read this article.
4:00 Minutes
The most insightful time you'll spend today!
Intro
One of the time consuming tasks for DBAs is to maximize query performance. To optimize slow-running queries, they often have to do detailed analysis, understand optimizer plans, and go through a lot of trial and error before getting to the best set of indexes that help with improved query performance. However, even with expert knowledge of a database’s internals, it is challenging to choose an effective set of indexes, especially when workloads change over time. The complexity of queries including several joins, filters, and subqueries make the process of identifying the right set of indexes very challenging for DBAs. Also, the effect of an index on the query plan needs to be taken into account when considering further indexes. Creating an index may cause the query optimizer to select completely different join orders and join/scan methods. This effect is hard to predict and quantify for DBAs.
Imagine if the database itself is intelligent enough to identify such queries, and recommends creating specific B-tree indexes?
Google Cloud’s AlloyDB for PostgreSQL is a fully-managed and fully PostgreSQL-compatible database for demanding transactional and analytical workloads that provides enterprise-grade performance and availability. AlloyDB offers Index Advisor, a built-in feature that helps alleviate the guesswork of tuning query performance with deep analysis of the different parts of a query including subqueries, joins, and filters. It periodically analyzes the database workload, identifies queries that can benefit from indexes, and recommends new indexes that can increase query performance.
How the AlloyDB Index Advisor works
First, let’s review a few AlloyDB terms relevant to the Index Advisor’s work.
- PostgreSQL’s system catalog has schema metadata, such as information about tables and columns, and internal bookkeeping information.
- HypoPG is an open source PostgreSQL extension that helps with hypothetical indexes without actually creating them to see if the index helps with query execution.
- Query Optimizer generates optimal execution plan.
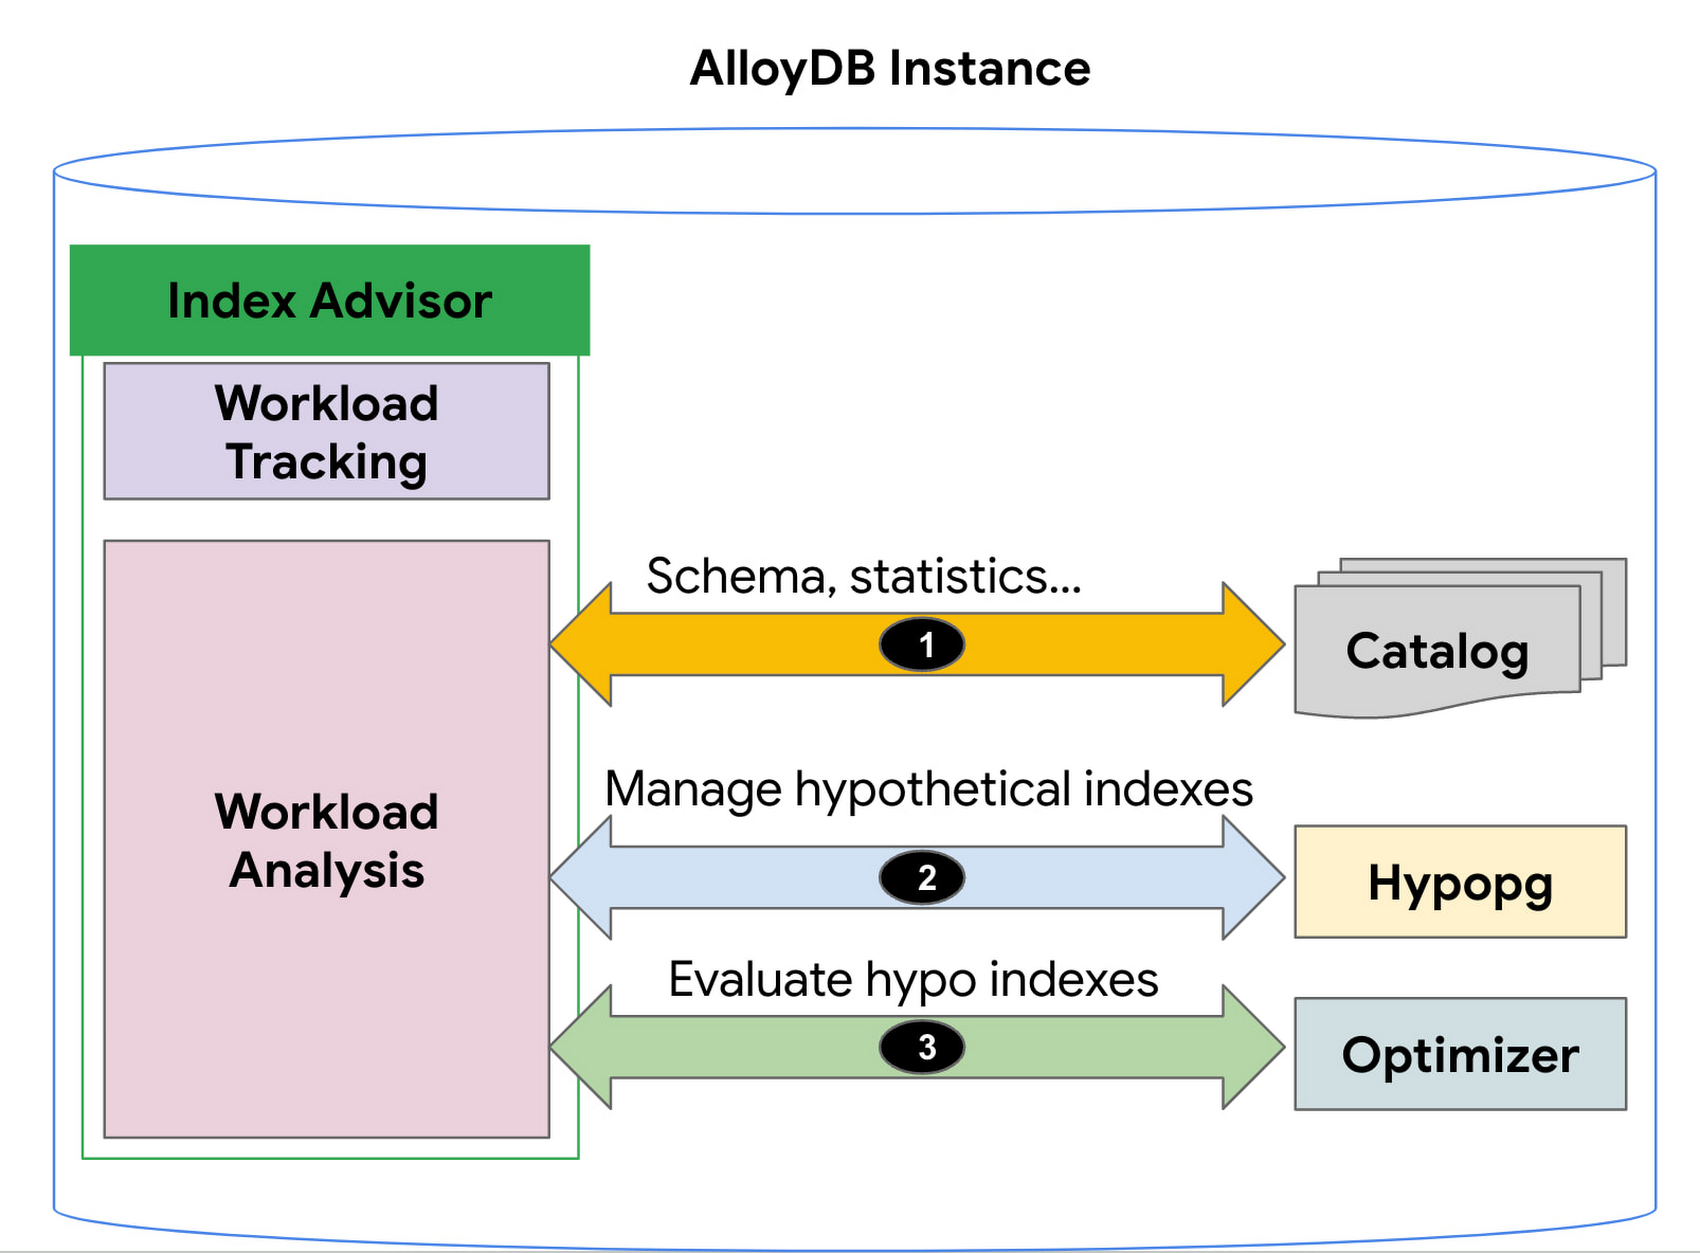
1. AlloyDB’s Index Advisor tracks the user query workload and analyzes it using statistics from the system catalog; it then identifies queries that could be improved significantly and potential candidate indexes for those cases. Note that there could be a large number of candidate indexes.
2. The Index Advisor evaluates each of these queries using hypothetical indexes based on the HypoPG, an open source extension and AlloyDB’s Query Optimizer.
3. The results of this evaluation are used to intelligently select the best set of indexes for the workload and to generate recommendations.
You can then simply copy and run the suggested index creation SQL commands. The Index Advisor consumes minimal resources and analyzes queries at a frequency that you define. It can also be constrained to have a user-specified maximum storage budget for the new indexes it recommends.
How to use the Index Advisor
1. Index Advisor is enabled by default. Its recommendation engine analyzes your workload at the specified frequency (every 24 hours by default) to capture any potential new index recommendations.
2. Run your queries that are representative of your workload to the instance. Index advisor tracks these queries automatically.
3. To request an index recommendation immediately, you can use the google_db_advisor_recommend_indexes() function. This function performs on-demand analysis and recommends indexes for the top 100 queries. SELECT * FROM google_db_advisor_recommend_indexes();
4. To view the recommended indexes and the queries based on periodic analysis, use the following query (also see the Usage Example section). SELECT DISTINCT recommended_indexes, queryFROM google_db_advisor_workload_report r JOIN google_db_advisor_workload_statements sON r.query_id = s.query_id;
Note that Index advisor analyzes queries issued by the connected user. For the user with the pg_read_all_stats role, it analyzes all tracked queries.
Currently, Index advisor only recommends new indexes. In future, the Index Advisor could be used to report unused indexes as well; dropping these can reduce index maintenance overhead for your transactional workload.
Evaluation
We will discuss two cases in this section.
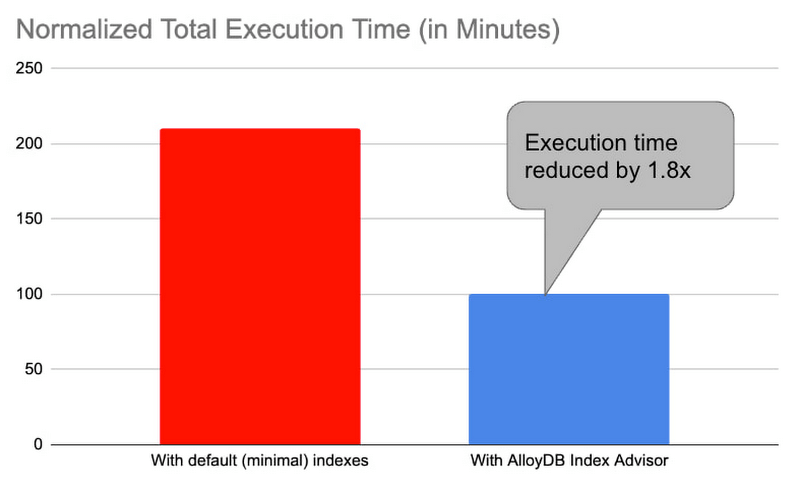
1. Decision support benchmark: We used a sample internal benchmark that modeled a decision support system. The benchmark dataset contained 450+ columns across 24 tables. The result quantified the performance of 100+ complex analytical queries. The benchmark initially had a minimal number of indexes and the normalized total query execution time was around 200+ minutes. We then enabled the AlloyDB Index Advisor and it recommended an additional 17 indexes. Creating those indexes and re-running the queries reduced the total execution time by half to ~100 minutes (1.8x).
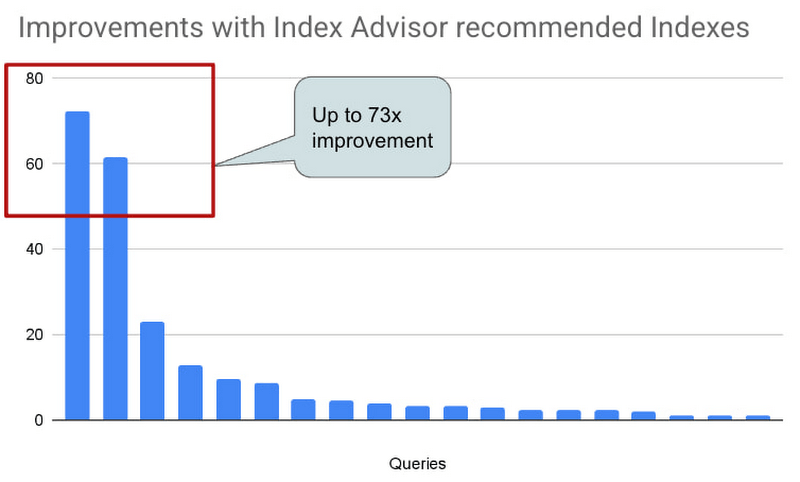
2. Real-world AlloyDB customer workload: This is a real-world workload from a large financial customer. They have a portfolio of complex analytical queries and business insights demand fast response times. Before using Index Advisor, DBAs had already created a few indexes that they considered to be useful to speed up these queries. Many of their queries joined 30+ tables, had 10+ filters and multiple subqueries. Those made it complex for DBAs to correctly identify the most beneficial indexes to create. AlloyDB Index Advisor analyzed these complex structures and identified four additional indexes. By adding the suggested indexes, performance of 17 queries were up by 5x – 73x. The response time of these queries dropped from seconds to milliseconds.
Usage Example
An example: We use the following example to demonstrate the use of Index Advisor. The example simulates a retail application performing analytics on its orders table.
1. Create a sample orders table.
CREATE TABLE orders (
    o_orderkey bigint NOT NULL,
    o_custkey int NOT NULL,
    o_orderstatus "char" NOT NULL,
    o_totalprice numeric(13,2) NOT NULL,
    o_orderdate date NOT NULL,
    o_orderpriority character varying(15) NOT NULL,
    o_clerk character varying(15) NOT NULL,
    o_shippriority int NOT NULL,
    o_comment character varying(79) NOT NULL
);
2. Insert 100K random orders into the table.
INSERT INTO orders
SELECT col, col, substr(md5(random()::text), 1, 1), random(), date '2023-01-01' + col * interval '1 hour', substr(md5(random()::text), 1, 1), concat('clerk', col), col%10, concat('comment', col)
 FROM generate_series(1,1000000) g(col);
3. Analyze the table to populate statistics.
ANALYZE orders;4. Run a query that counts the number of orders in the second week of Jan. You can run the query with timing on so that you can see how long it takes to run the query before and after the index is created.
\timing
SELECT COUNT(*) FROM ORDERS WHERE o_orderdate >= '2023-01-09' and o_orderdate <= '2023-01-15';

Time: 42.196 ms
5. Manually request an index recommendation.
SELECT * FROM google_db_advisor_recommend_indexes();
                      index                       | estimated_storage_size_in_mb
--------------------------------------------------+------------------------------
 CREATE INDEX ON "public"."orders"("o_orderdate") |                           25
(1 row)
6. View recommended indexes for tracked queries.
SELECT DISTINCT recommended_indexes, query
FROM google_db_advisor_workload_report r, google_db_advisor_workload_statements s
WHERE r.query_id = s.query_id AND recommended_indexes != '';
               recommended_indexes                |                                             query
--------------------------------------------------+------------------------------------------------------------------------------------------------
 CREATE INDEX ON "public"."orders"("o_orderdate") | SELECT COUNT(*) FROM ORDERS WHERE o_orderdate >= '2023-01-09' and o_orderdate <= '2023-01-15';
(1 row)
6. View recommended indexes for tracked queries.
SELECT DISTINCT recommended_indexes, query
FROM google_db_advisor_workload_report r, google_db_advisor_workload_statements s
WHERE r.query_id = s.query_id AND recommended_indexes != ”;
recommended_indexes | query
————————————————–+————————————————————————————————
CREATE INDEX ON “public”.”orders”(“o_orderdate”) | SELECT COUNT(*) FROM ORDERS WHERE o_orderdate >= ‘2023-01-09’ and o_orderdate <= ‘2023-01-15’;
(1 row)
7. Add the recommended index.
CREATE INDEX ON "public"."orders"("o_orderdate");8. Re-run the query.
\timing
SELECT COUNT(*) FROM ORDERS WHERE o_orderdate >= '2023-01-09' and o_orderdate <= '2023-01-15';

Time: 1.403 ms  (compared to 42.196ms before the index)
Learn more
- To learn more about AlloyDB’s Index Advisor, see Enable and use the index advisor | AlloyDB for PostgreSQL | Google Cloud
- To learn about AlloyDB, read AlloyDB for PostgreSQL intelligent scalable storage | Google Cloud Blog
- Start building on Google Cloud with $300 in free credits and 20+ always free products. https://cloud.google.com/free
Google Cloud’s Transfer Services Helps Move Nuro’s Petabytes of Data from Edge to the Cloud

5167
Of your peers have already read this article.
3:00 Minutes
The most insightful time you'll spend today!
Engineers that build last-mile delivery services belong to an elite order, a hallowed subcategory. Delivery customers are incredibly demanding when it comes to speed and convenience, and the services they use must take variables like increased traffic, road conditions, human error, and even driver availability into account every day.
Nuro is a company with a new approach to delivery services. Nuro has a fleet of autonomous vehicles designed to address many of the problems related to last-mile delivery. And every day, these vehicles — and their sensors — generate a lot of data before parking for the night. For Nuro engineers, that data can help them understand the impact of new on-road features, make improvements to their vehicles’ software, and ensure even better deliveries for their customers.
For Nuro, the key challenge is how to move petabytes of data as quickly, securely, and easily as possible from their edge environments, like vehicle depots, to Google’s Cloud Storage. For this delivery effort, Nuro selected Google’s Transfer Appliance with its new online transfer capability, now generally available.
Helping Nuro to speed up data delivery from the edge to the cloud
Like many Google Cloud customers, Nuro collects data from remote environments, like vehicle depots, that have different networking and storage capabilities when compared to a traditional data center. For a transfer solution to be effective moving unstructured data from these environments to the cloud, the solution needs to be easy to deploy and automate, while still providing similar performance as a more complicated alternative.
The Transfer Appliance was built for this use case. It arrives to customers as a physical appliance with a preconfigured version of Google’s Storage Transfer Service software already installed. Customers can move files to the appliance by using SFTP or SCP, or, alternately, can mount the appliance as an NFS share and copy target. Data can be stored locally on the appliance or transferred over the network, and secure encryption — at-rest and in-flight — is enabled by default.
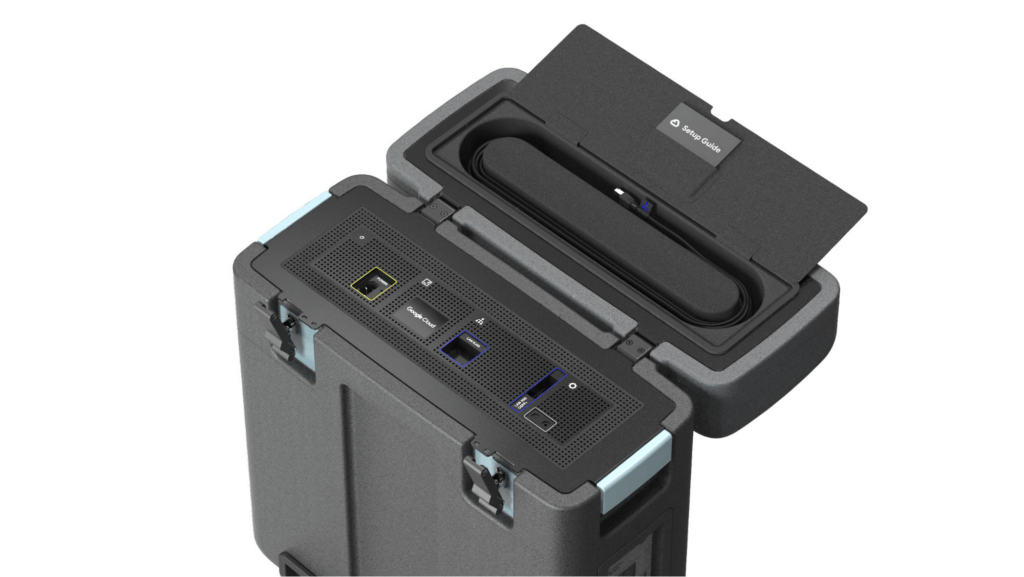
With these new appliances, Nuro will be able to automate much of their storage transfer needs. When their autonomous vehicles return to the depot, they can move data like software logs, LIDAR data, and sensor data — all ideal fits for Google’s Cloud Storage — from parked vehicles to the Transfer Appliance. Online transfers can then be performed throughout the day, ensuring a steady stream of valuable data in the cloud for developers to analyze and use in their nightly builds. All of this will help Nuro’s engineering leaders like Jie Pan to run more productive development teams with less operational overhead.
“Our autonomous vehicles generate a tremendous amount of useful data, and our goal is to get that data to our engineers as soon as possible,” said Jie Pan, Engineering Manager at Nuro. “When vehicles return to the depot, we can move data hourly into Cloud Storage over the network. We also have the flexibility to return the Transfer Appliance back to Google Cloud. Most importantly, this rapid transfer architecture gives a meaningful boost to engineering productivity and development velocity.”
Going the extra mile
Engineering and infrastructure leaders understand the value of delivering the right data to the right teams, as fast as possible. By adding preconfigured, over-the-network transfer into a turnkey Transfer Appliance, Google Cloud customers can more easily automate these data deliveries by scheduling regular migrations of on-premises files, objects, and other unstructured data to our Cloud Storage.
As Nuro continues to grow their manufacturing and testing footprint, they plan to use Transfer Appliances to further scale and simplify their data migration from on-premises to Google Cloud. Cutting the time to migrate their data by more than half will make for happier, more productive developers, and that will help Nuro bring us all the future of delivery a little faster.
If you’d like to learn more about Transfer Appliance and its new online transfer capability, click here or reach out to your Google Cloud account team.
3507
Of your peers have already downloaded this article
19:30 Minutes
The most insightful time you'll spend today!
While data has influenced major business decisions throughout the ages, the term “data warehouse” isn’t even half a century old. But it’s an important concept; by centralizing data from many disparate sources, analysts can make more informed decisions. Traditionally, this has meant collecting data in on-premises infrastructure. But as data volumes have grown, these legacy systems have not been able to keep up with changing demands: They are difficult to scale, offer no support for machine learning and artificial intelligence initiatives, and are simply too expensive to maintain.
With increased advances in technology, the introduction of more cost-effective compute and storage options have changed the data warehouse landscape. Now more than ever, businesses need an agile and efficient analytics infrastructure that allows them to derive insights at a fraction of the cost of legacy systems. Modern data warehouses can give organizations the competitive edge, offering customers fast and easy access to business intelligence while seamlessly scaling to meet increased demands.
In this ebook, based on the keynote presentation featuring Forrester Analyst Michele Goetz at the 2019 Future of Your Data Warehouse digital conference, we’ll look at the evolution of data warehousing and how a cloud infrastructure can offer immense benefits for the future.
How Vertex AI Helps Coca-Cola Bottlers Japan Analyze Billions of Data Records

6220
Of your peers have already read this article.
4:00 Minutes
The most insightful time you'll spend today!
Japan is home to millions of vending machines installed on streets and in buildings, sports stadiums and other facilities. Vending machine owners and operators, including beverage manufacturers, stock these machines with different product combinations depending on location and demand. For example, they primarily display coffee and energy drinks in machines placed in offices and sports drinks and mineral water in machines at sports facilities. The combinations also vary by season: for example, owners and operators may display cold beverages in summer and hot beverages in winter.
Traditionally, vending machine operators have relied on the intuition and experience of sales managers to determine the optimum product mix for each vending machine. However, in recent years, manufacturers such as Coca-Cola Bottlers Japan (CCBJ) have turned to data to analyze and make strategic decisions about when and where to locate products in machines.
CCBJ is the number one Coca-Cola bottler in Asia and vending machines comprise the bulk of its business. The organization operates about 700,000 machines across Tokyo, Osaka, Kyoto, and 35 prefectures. Minori Matsuda, Google Developer Expert and also Data Science Manager at CCBJ, says “The billions of data records collected from 700,000 physical devices are a great asset and a treasure trove we can take advantage of.”
Minori points out that when considering the mix of products in vending machines in sporting facilities, the managers naturally assume sports drinks would generally sell well. However, analysis of purchase data – including hot drinks and hot drinks plus sports drinks – found many parents purchased sweet drinks such as milk tea when they attended games or sessions involving their children. “Analyzing data gives us new discoveries and, by using catchy storytelling techniques from exploratory data analysis, we are instilling a data culture within our company,” he says. “It’s worth creating by looking at facts rather than making assumptions!”
Minori believes that to analyze the vast amount of data collected from more than 700,000 vending machines, the business needs a powerful analytical platform. However, until recently, CCBJ had to extract data for analysis from its core systems, load this data into a warehouse it created and perform the required analyses. The billions of records of data generated across the fleet – including transaction data – exposed some challenges for traditional analysis platforms. They could not efficiently process data at a considerable scale: it could take a day to return results and required extensive maintenance due to the size.
CCBJ considered building a machine learning (ML) platform as a layer on top of existing systems in August 2020 and opted for Google Cloud the following month. “I feel that Google Cloud has an edge in all products and is very well thought out,“ says Minori, noting the scalability and cost of the platform allow the business to take a ‘trial and error’ approach to achieve the best outcomes from ML. Google Cloud also delivered the required visibility and flexibility to help the business deliver change every day against key performance indicators.
MLOps platform streamlines ML pipeline development
CCBJ built its analysis platform using Vertex AI (formerly AI Platform) centered on a BigQuery analytics data warehouse, and partly using AutoML for tabular data. “We have created a prediction model of where to place vending machines, what products are lined up in the machines and at what price, how much they will sell, and implemented a mechanism that can be analyzed on a map,” says Minori, adding that building the platform with Google Cloud was not difficult. “We were able to realize it in a short period of time with a sense of speed, from platform examination to introduction, prediction model training, on-site proof of concept to rollout.”
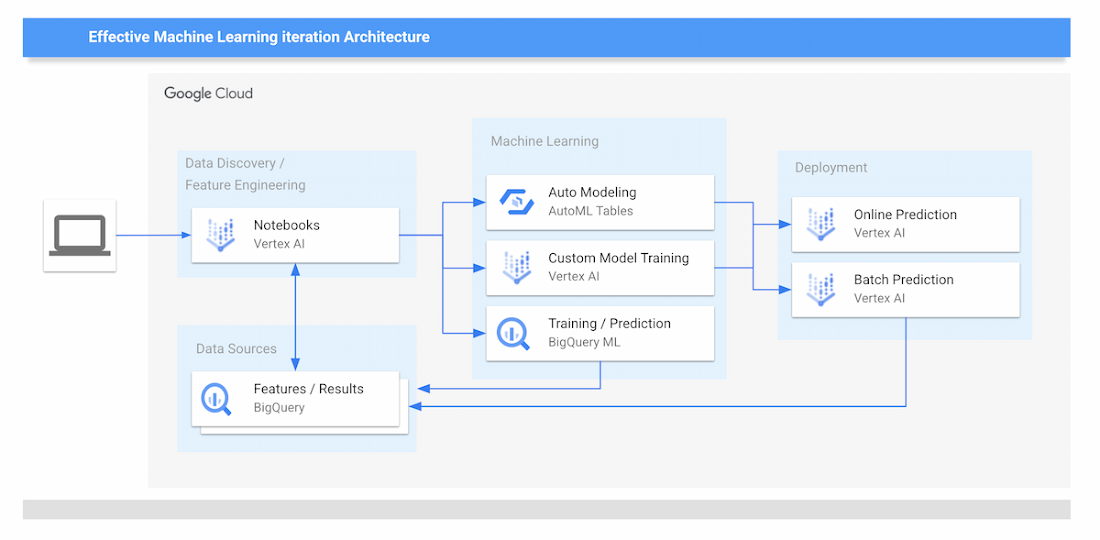
The new data analytics platform of CCBJ consists of the following parts:
Data Sources
- The data collected from the vending machines are all stored on BigQuery.
Data Discovery and Feature Engineering
- Minori and other data scientists at CCBJ are using Vertex Notebooks, where they access the data on BigQuery by executing SQL queries directly from the Notebooks. This environment is used for the data discovery process and feature engineering.
ML Training
- For ML training, CCBJ uses AutoML for Tabular data, Custom model training on Vertex AI, and BigQuery ML. AutoML gives model performance with AUC curves and also feature importance graphs.
ML Prediction and Serving
- For ML prediction, CCBJ uses Online Prediction for AutoML models and Online Prediction for custom models for real-time prediction when the salesperson finds the interesting point
- Batch Prediction is used for generating a large prediction map that covers the whole country
- The prediction results are distributed to sales managers’ tablets
CCBJ started constructing the platform in September 2020, and completed it within a month. The business has conducted proofs of concept at its base in Kyoto since February 2021, and since April, has rolled out the platform to sales managers in 35 prefectures in one metropolitan area. “Data analysis is built into the day-to-day routines of sales managers with 100% utilization,” says Minori. “They can utilize the prediction results on tablets that were able to achieve pretty high accuracy from the start.”
The hardest part was the education of sales managers in the field; having them understand the reasoning behind the ML prediction results for particular outcomes, so they could be convinced to make use of the results. “For example, regarding a new installation location predicted by the model, it seemed that there was no effective information for installation from the map information, but when I actually went there, there was a motorcycle shop and it was a place where young people who like motorcycles gathered,” says Minori. “Or there is a small meeting place where the elderly in the neighborhood are active.
“In many cases, new discoveries that cannot be understood from map information alone can be derived from the data.”
Minori also points to a phenomenon whereby humans pursued and confirmed factors inferred by the model – meaning that once they experienced analysis and it worked effectively, they asked why the same type of analysis or prediction could not be undertaken next time. The resulting cycle of more inquiries generated, more information gathered and more data captured for analysis meant the accuracy of results was improved.
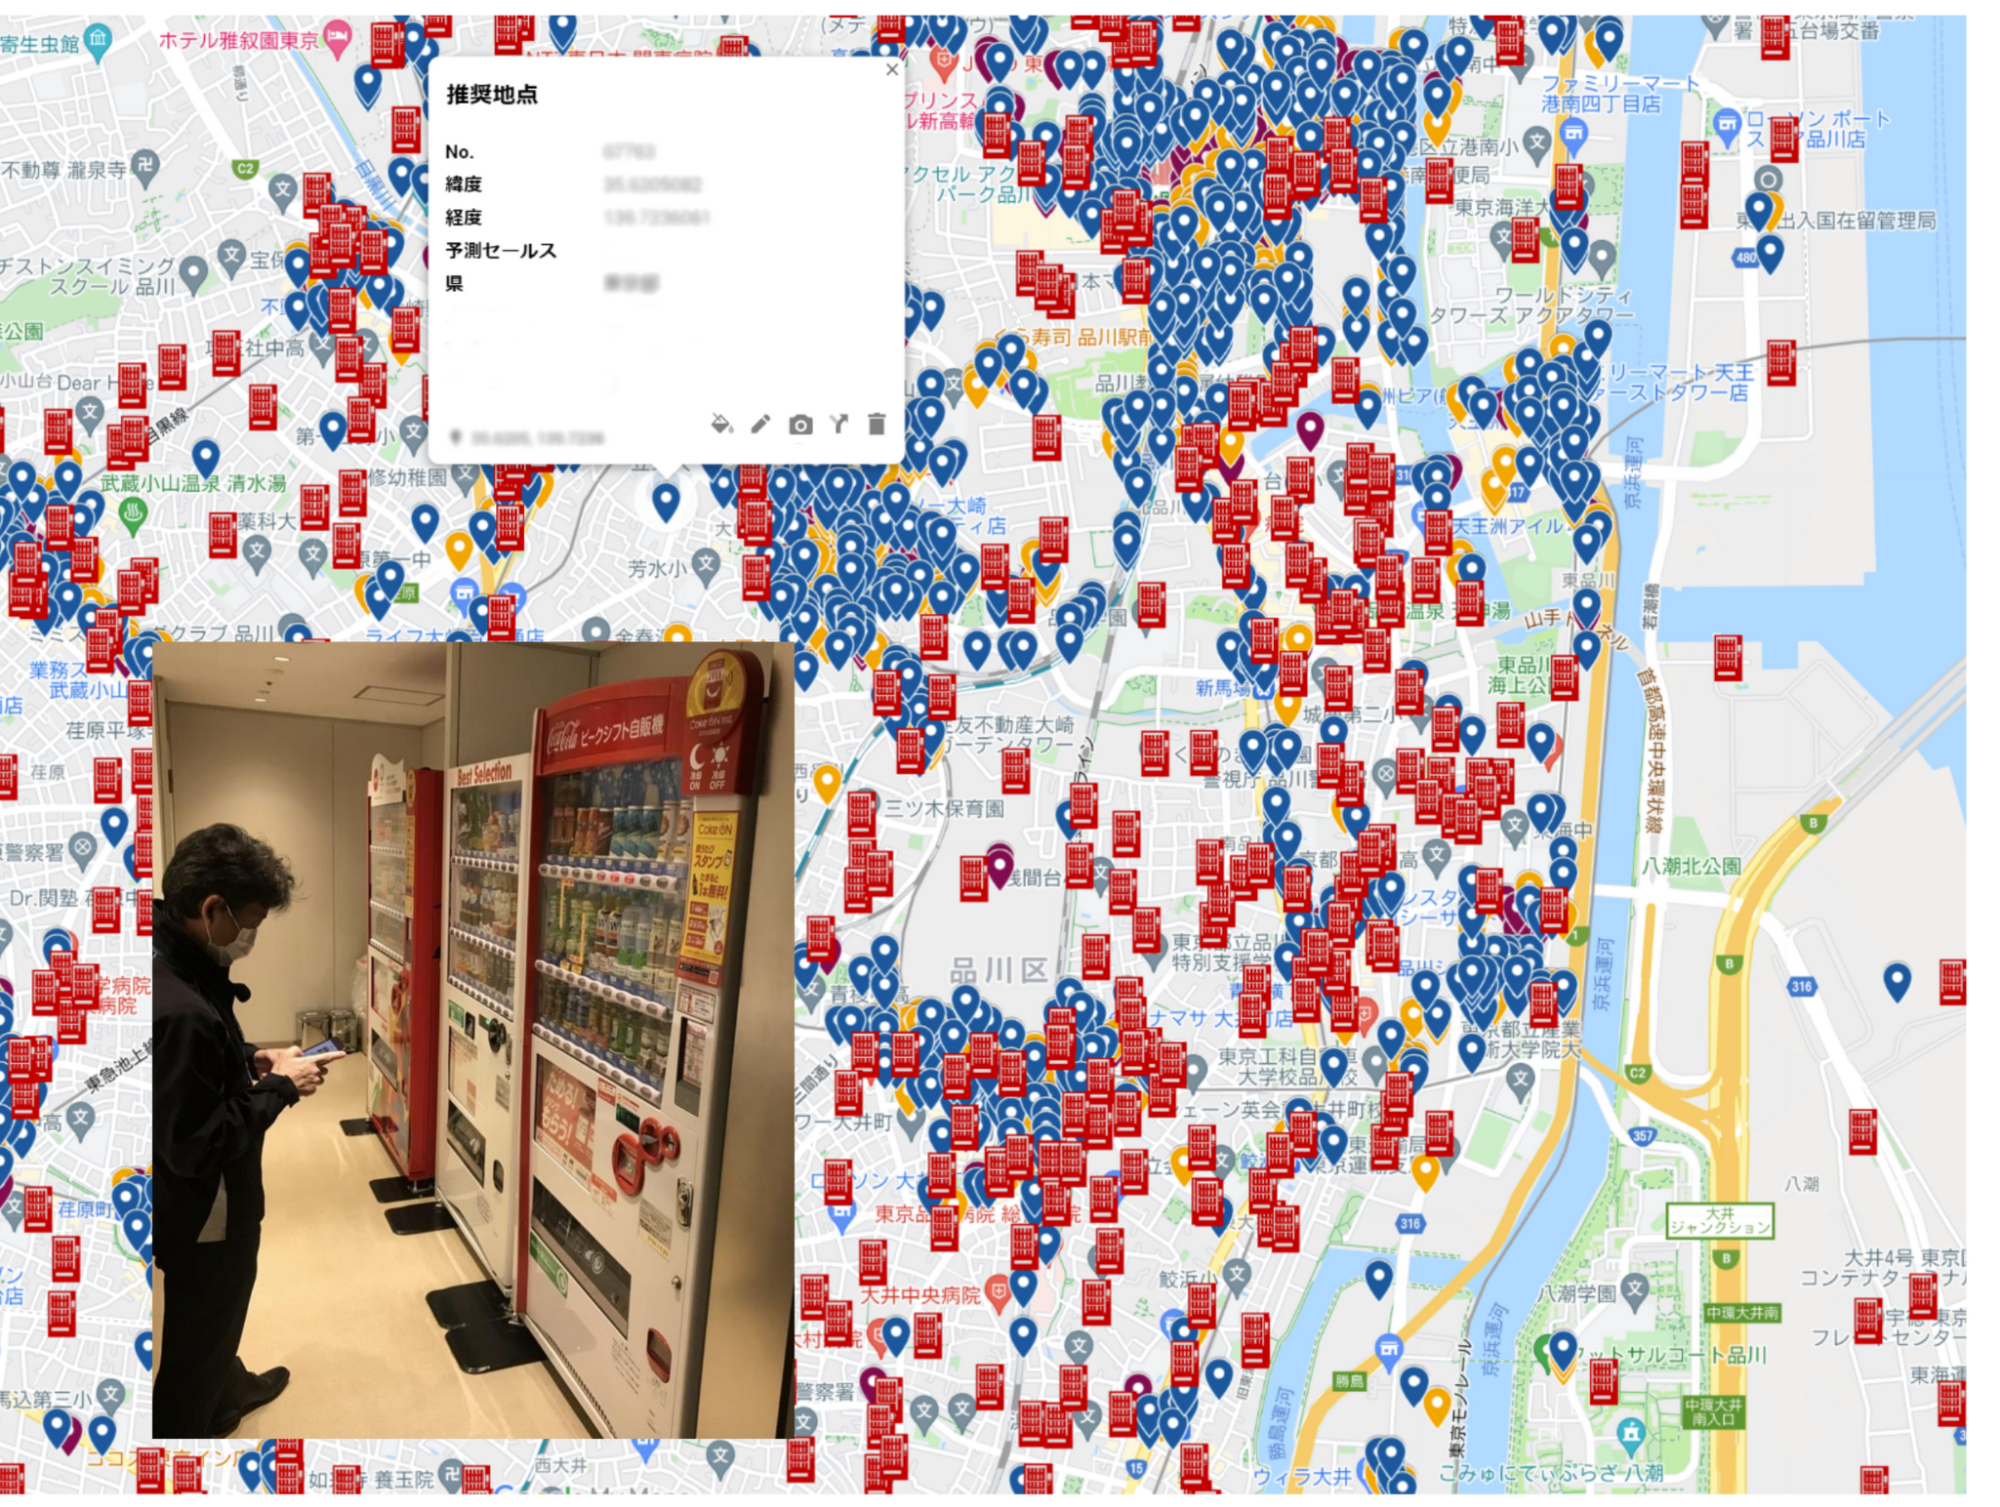
Minori describes Vertex AI as having a number of strengths in helping CCBJ build a ML data analysis platform. “One of the major merits of Vertex AI was that we were able to realize MLOps that streamlines the entire development life cycle from construction of the ML pipeline to its execution,” he says.
With near real-time data analysis through Google Cloud, CCBJ teams can spend time developing strategies rather than waiting for data requested from the IT systems department. Exploratory data analysis is also considerably easier as repeated trial and error has greatly improved the accuracy of analyses. Before we used Machine Learning, most machine placement processes were done by human senses, by looking at a map to find the suggestion points. By using Machine Learning to generate a massive number of placement point suggestions, the efficiency of routing of salespeople has been dramatically improved.
In the future, CCBJ aims to automate the continuous training pipeline with Vertex AI. “CCBJ is a tech company that operates in the food industry,” says Minori. With the organization operating a vending machine network of 700,000 units, it would like to create new businesses based on utilization and analyzing data. Some of these businesses may be based on Sustainable Development Goals (SDGs) initiatives such as the utilization of recycled PET bottles, measures to prevent food loss and ways of using vending machines to contribute to local communities, which we have been working on for some time. It would be interesting if we could collaborate with Google Cloud on these in the future.”

Google Cloud Tools Help U.S. Forest Department Generate Years of Insights into Earth’s Natural Resources

5027
Of your peers have already read this article.
3:00 Minutes
The most insightful time you'll spend today!
For 117 years, the U.S. Department of Agriculture’s Forest Service has been a steward of America’s forests, grasslands, and waterways. It directly manages 193 million acres and supports sustainable management on a total of 500 million acres of private, state, and tribal lands. Its impact reaches far beyond even that, offering its research and learning freely to the world.
At Google, we’re big admirers of the Forest Service’s mission. So we were thrilled to learn in 2011 that its scientists were using Google Earth Engine, our planetary-scale platform for Earth Science data and analysis, to aid its research, understanding, and effectiveness. In the years since, Google has worked with the Forest Service to meet its unique requirements for visual information about the planet. Using both historical and current data, the Forest Service built new products, workflows, and tools that help more effectively and sustainably manage our natural resources. The Forest Service also uses Earth Engine and Google Cloud to study the effects of climate change, forest fires, insects and disease, helping them create new insights and strategies.
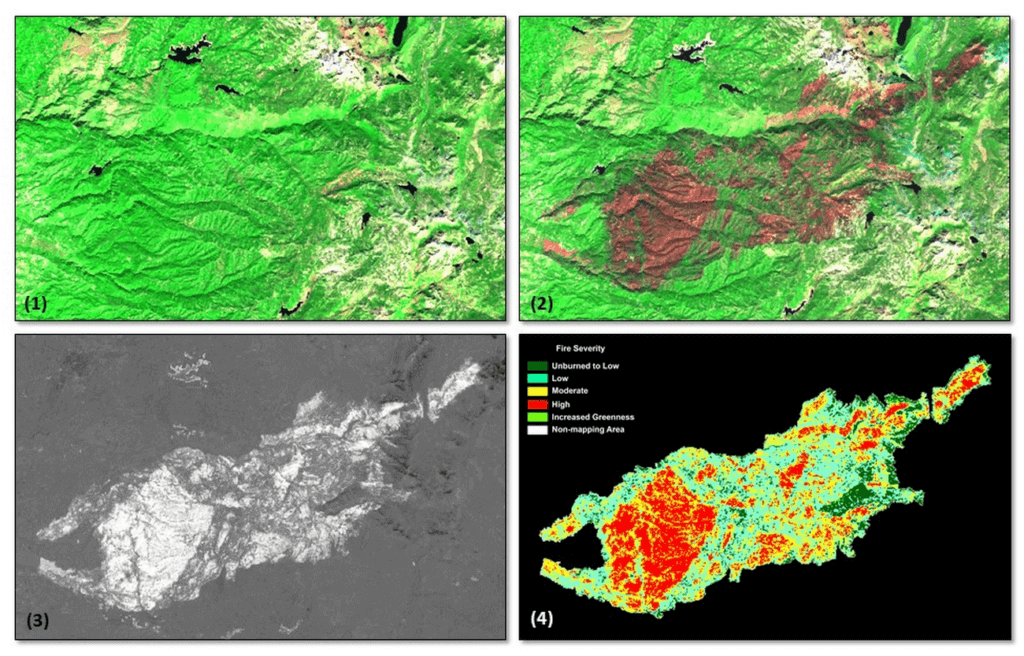
Besides gaining newfound depths of insight, the Forest Service has also sped up its research dramatically, enabling everyone to do more. Using Google Cloud and Earth Engine, the Forest Service reduced the time it took to analyze 10 years worth of land-cover changes from three months to just one hour, using just 100 lines of code. The agency built new models for coping with change, then mapped these changes over time, in its Landscape Change Monitoring System (LCMS) project.
Emergency responders can now work better on new threats that arise after wildfires, hurricanes, and other natural disasters. Forest health specialists can detect and monitor the impacts of invasive insects, diseases, and drought. More Forest Service personnel can use new tools and products within Earth Engine, thanks to numerous training and outreach sessions within the Forest Service.
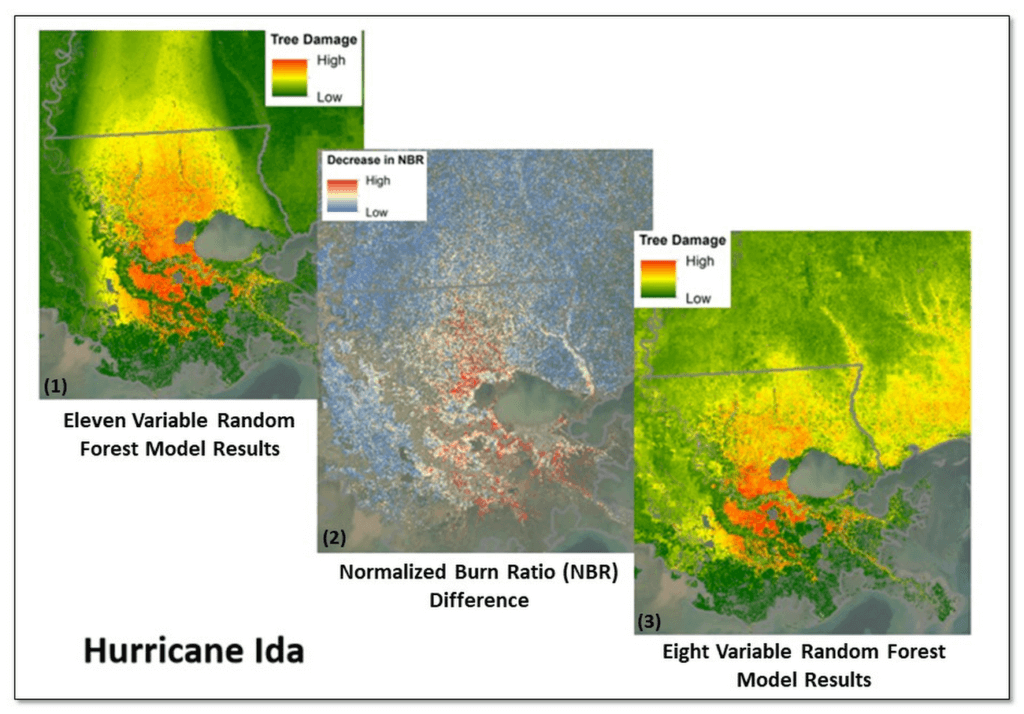
Researchers elsewhere also benefited when the Forest Service created new toolkits, and posted them to GitHub for public use. For example, there’s geeViz, a repository of Google Earth Engine Python code modules useful for general data processing, analysis, and visualization.
This is only the start. Recently, the Forest Service started using Google Cloud’s processing and analysis tools for projects like California’s Wildfire and Forest Resilience Action Plan. Forest Service researchers also use Google Cloud to better understand ecological conditions across landscapes in projects like Fuelcast, which provides actionable intelligence for rangeland managers, fire specialists, and growers, and the Scenario Investment Planning Platform for modeling local and national land management scenarios.
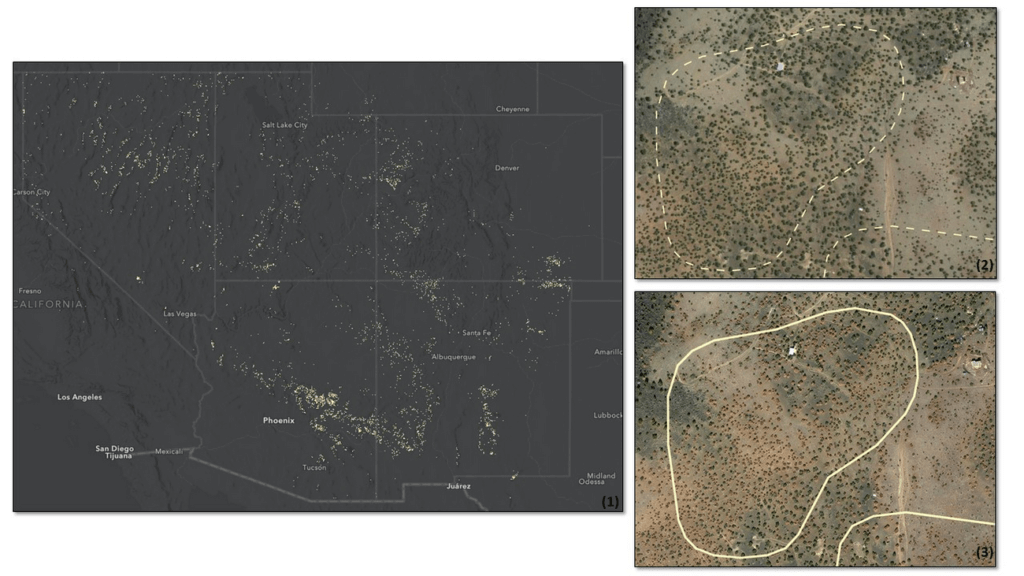
The Forest Service is a pioneer in building technology to help us better understand and care for our planet. With more frequent imaging, rich satellite data sets, and sophisticated database and computation systems, we can view and model the Earth as a large-scale dynamic system.
We are honored and excited to respond to the unique set of requirements of the scientists, engineers, rangers, and firefighters of the USFS, and look forward to years of learning about — and better caring for — our most precious resources.
*Image 1: The USDA Forest Service (USFS) Geospatial Technology and Applications Center (GTAC) uses science-based remote sensing methods to characterize vegetation and soil condition after wildland fire events. The results are used to facilitate emergency assessments to support hazard mitigation, to inform post-fire restoration planning, and to support the monitoring of national fire policy effectiveness. GTAC currently conducts these mapping efforts using long-established geospatial workflows. However, GTAC has adapted its post-fire mapping and assessment workflows to work within Google Earth Engine (GEE) to accommodate the needs of other users in the USFS. The spatially and temporally comprehensive coverage of moderate resolution multispectral data sources (e.g., Landsat, Sentinel 2) and analytical power provided by GEE allows users to create geospatial burn severity products quickly and easily. Box 1 shows a pre-fire Sentinel-2 false color composite image. Box 2 shows a post-fire Sentinel-2 false color composite image with the fire scar apparent in reddish brown. Box 3 shows a differenced Normalized Burn Ratio (dNBR) image showing the change between the pre- and post-fire images in Boxes 1 and 2. Box 4 shows a thresholded dNBR image of the burned area with four classes of burn severity (unburned to high severity), which is the final output delivered to forest managers.
*Image 2: Leveraging Google Earth Engine (GEE), the USDA Forest Service (USFS) Geospatial Technology and Applications Center (GTAC) and USFS Region 8, developed the Tree Structure Damage Impact Predictive (TreeS-DIP) modeling approach to predict wind damage to trees resulting from large hurricane events and produce spatial products across the landscape. TreeS-DIP results become available within 48 hours following landfall of a large storm event to allow allocation of ground resources to the field for strategic planning and management. Boxes 1 and 3 above show TreeS-DIP modeled outputs with varying data inputs and parameters. Box 2 shows changes in greenness (Normalized Burn Ratio; NBR) that was measured with GEE during the recovery from Hurricane Ida and is shown as a visual comparison to the rapidly available products from TreeS-DIP.
*Image 3: Severe drought conditions across the American West prompted concern about the health and status of pinyon-juniper woodlands, a vast and unique ecosystem. In a cooperative project between the USDA Forest Service (USFS) Geospatial Technology and Applications Center (GTAC) and Forest Health Protection (FHP), Google Earth Engine (GEE) was used to map pinyon pine and juniper mortality across 10 Western US States. The outputs are now being used to plan for future work including on-the-ground efforts, high-resolution imagery acquisitions, aerial surveys, in-depth mortality modeling, and planning for 2022 field season work.
Box 1 contains remote sensing change detection outputs (in white) generated with GEE, showing pinyon-juniper decline across the Southwestern US. Box 2 shows NAIP imagery from 2017 with, with box 3 showing NAIP imagery from 2021. NAIP imagery from these years shows trees changing from healthy and green in 2017 to brown and dying in 2021. In addition, box 2 and box 3 show change detection outputs from Box 1 for a location outside of Flagstaff, AZ converted to polygons (in white). The polygon in box 2 is displayed as a dashed line to serve as a reference, while the solid line in box 3 shows the measured change in 2021. Converting rasters to polygons allows the data to be easily used on tablet computers, as well as the ability to add information and photographs from field visits.
More Relevant Stories for Your Company

Enhancing Data Governance through Automation with Dataplex and BigLake
Unlocking the full potential of data requires breaking down the silo between open-source data formats and data warehouses. At the same time, it is critical to enable data governance team to apply policies regardless of where the data happens, whether - on file or columnar storage. Today, data governance teams
Predictive Model Built on Google Cloud Helps You Get a 7-day Mosquito Forecast Report!
Mosquitoes aren’t just the peskiest creatures on Earth; they infect more than 700 million people a year with dangerous diseases like Zika, Malaria, Dengue Fever, and Yellow Fever. Prevention is the best protection, and stopping mosquito bites before they happen is a critical step. SC Johnson—a leading developer and manufacturer

HarbourBridge Schema Assistant Allows Quick, Bulk Migration to Cloud Spanner
Today we’re announcing the HarbourBridge Schema Assistant, which provides a guided schema-design workflow for migrating from MySQL or PostgreSQL to Spanner. HarbourBridge imports dump files (from mysqldump or pg_dump) or directly connects to your source database, and converts the source database schema to an equivalent Spanner schema. The new Schema Assistant

Cloud Bigtable Helps Fraud-detection Company Meet Scalability Demands and Secure Customer Data
Editor’s note: Today we are hearing from Jono MacDougall , Principal Software Engineer at Ravelin. Ravelin delivers market-leading online fraud detection and payment acceptance solutions for online retailers. To help us meet the scaling, throughput, and latency demands of our growing roster of large-scale clients, we migrated to Google Cloud and its
