





Transform ‘Dark Data’ from Documents with Document AI, Cloud Functions and Workflows

8184
Of your peers have already read this article.
2:00 Minutes
The most insightful time you'll spend today!
At enterprises across industries, documents are at the center of core business processes. Documents store a treasure trove of valuable information whether it’s a company’s invoices, HR documents, tax forms and much more. However, the unstructured nature of documents make them difficult to work with as a data source. We call this “dark data” or unstructured data that businesses collect, process and store but do not utilize for purposes such as analytics, monetization, etc. These documents in pdf or image formats, often trigger complex processes that have historically relied on fragmented technology and manual steps. With compute solutions on Google Cloud and Document AI, you can create seamless integrations and easy to use applications for your users. Document AI is a platform and a family of solutions that help businesses to transform documents into structured data backed by machine learning. In this blog post we’ll walk you through how to use Serverless technology to process documents with Cloud Functions, and with workflows of business processes orchestrating microservices, API calls, and functions, thanks to Workflows.
At Cloud Next 2021, we presented how to build easy AI-powered applications with Google Cloud. We introduced a sample application for handling incoming expense reports, analyzing expense receipts with Procurement Document AI, a DocAI solution for automating procurement data capture from forms including invoices, utility statements and more. Then organizing the logic of a report approval process with Workflows, and used Cloud Functions as glue to invoke the workflow, and do analysis of the parsed document.
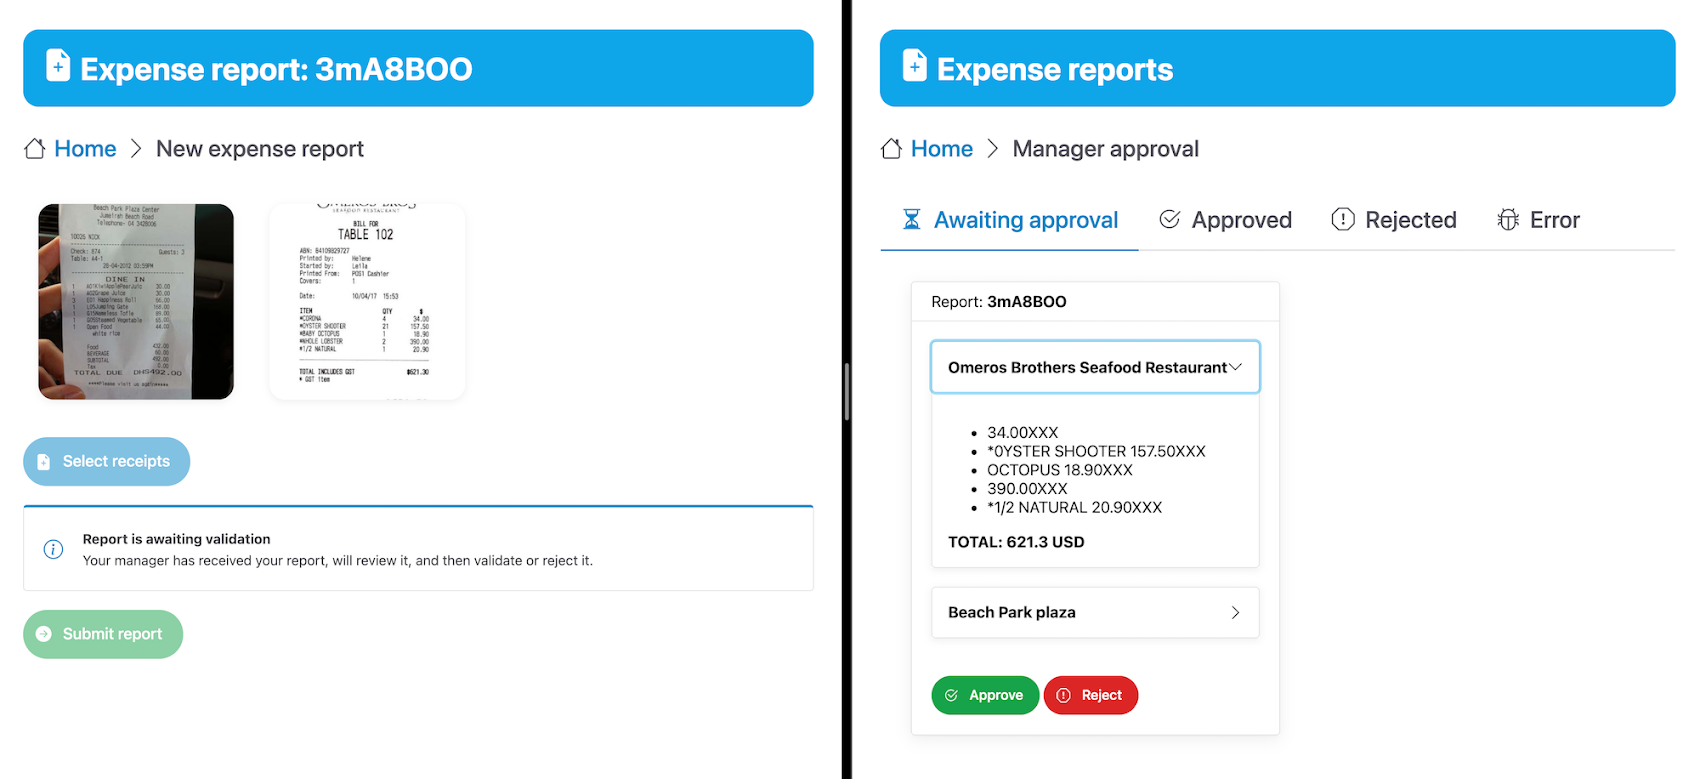
We also open sourced the code on this Github repository, if you’re interested in learning more about this application.
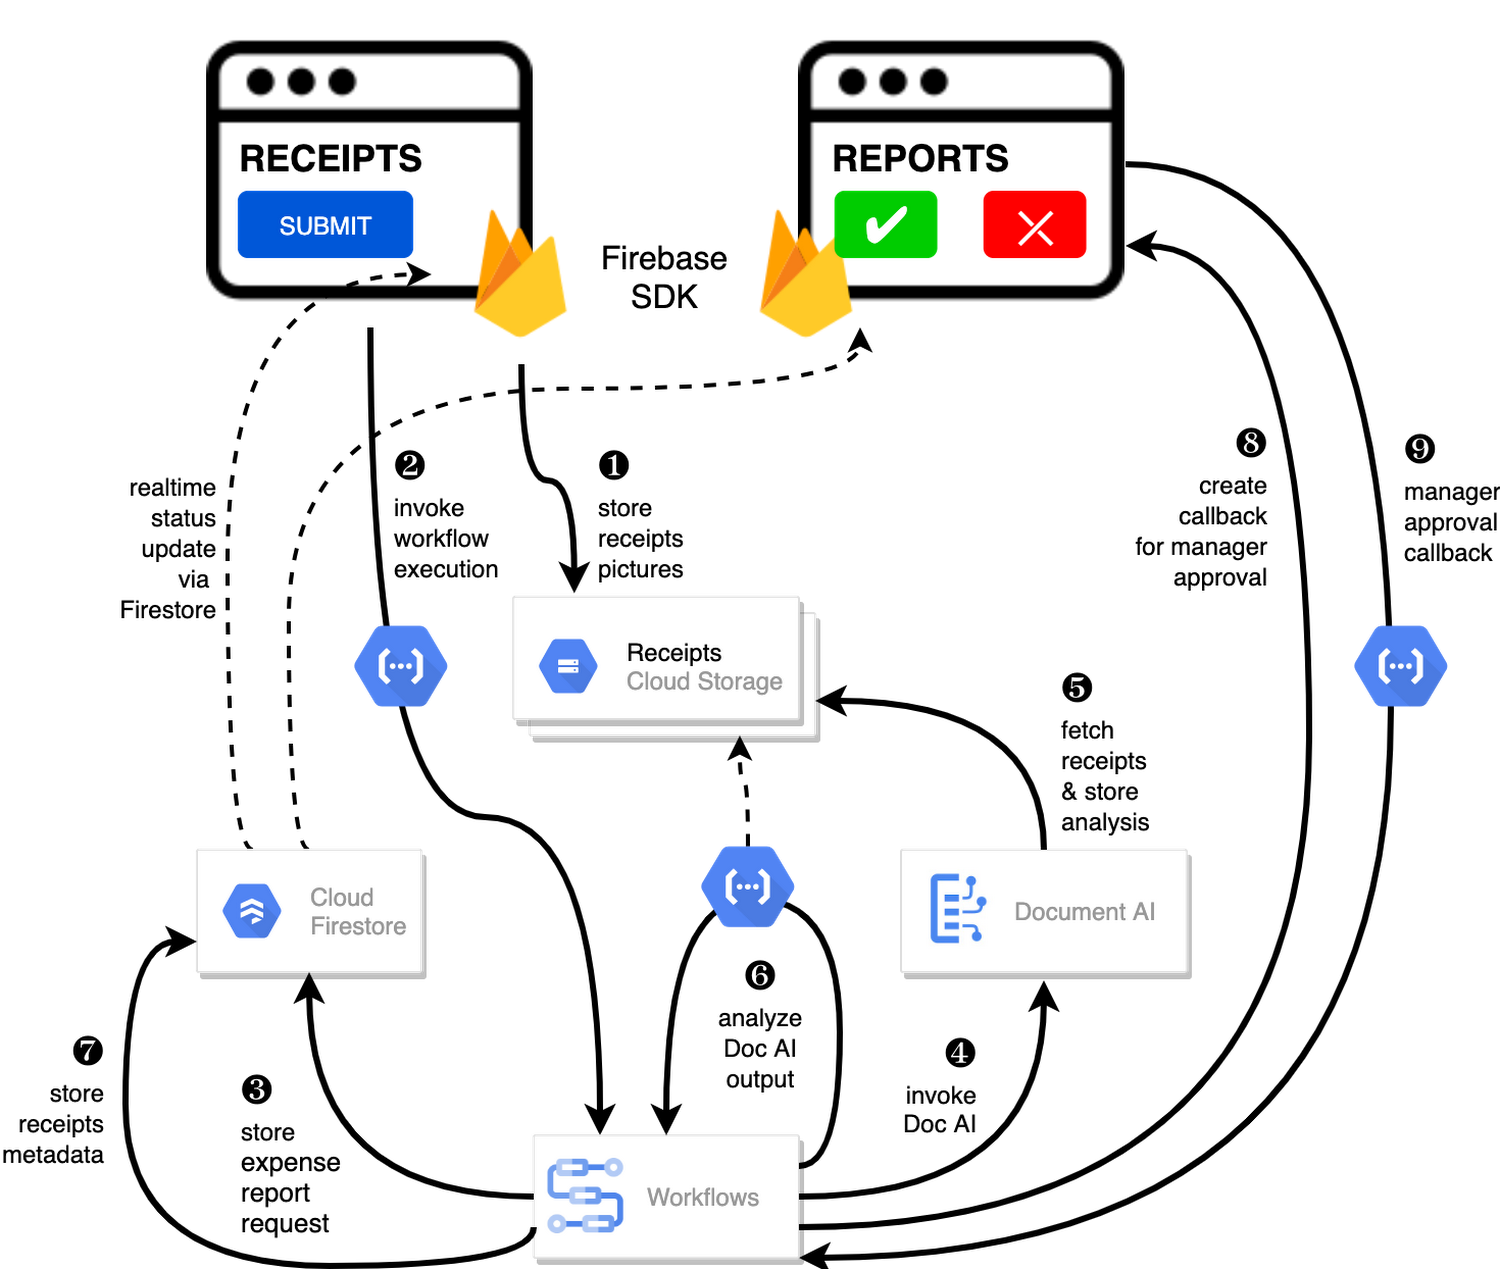
In the above diagram, there are two user journeys: the employee submitting an expense report where multiple receipts are processed at once, and the manager validating or rejecting the expense report.
First, the employee goes to the website, powered by Vue.js for the frontend progressive JavaScript framework and Shoelace for the library of web components. The website is hosted via Firebase Hosting. The frontend invokes an HTTP function that triggers the execution of our business workflow, defined using the Workflows YAML syntax.
Workflows is able to handle long-running operations without any additional code required, in our case we are asynchronously processing a set receipt files. Here, the Document AI connector directly calls the batch processing endpoint for service. This API returns a long-running operation: if you poll the API, the operation state will be “RUNNING” until it has reached a “SUCCEEDED” or “FAILED” state. You would have to wait for its completion. However, Workflows’ connectors handle such long-running operations, without you having to poll the API multiple times till the state changes. Here’s how we call the batch processing operation of the Document AI connector:
- invoke_document_ai:call: googleapis.documentai.v1.projects.locations.processors.batchProcessargs:name: ${"projects/" + project + "/locations/eu/processors/" + processorId}location: "eu"body:inputDocuments:gcsPrefix:gcsUriPrefix: ${bucket_input + report_id}documentOutputConfig:gcsOutputConfig:gcsUri: ${bucket_output + report_id}skipHumanReview: trueresult: document_ai_response
Machine learning uses state of the art Vision and Natural Language Processing models to intelligently extract schematized data from documents with Document AI. As a developer, you don’t have to figure out how to fine tune or reframe the receipt pictures, or how to find the relevant field and information in the receipt. It’s Document AI’s job to help you here: it will return a JSON document whose fields are: line_item, currency, supplier_name, total_amount, etc. Document AI is capable of understanding standardized papers and forms, including invoices, lending documents, pay slips, driver licenses, and more.
A cloud function retrieves all the relevant fields of the receipts, and makes its own tallies, before submitting the expense report for approval to the manager. Another useful feature of Workflows is put to good use: Callbacks, that we introduced last year. In the workflow definition we create a callback endpoint, and the workflow execution will wait for the callback to be called to continue its flow, thanks to those two instructions:
- create_callback:call: events.create_callback_endpointargs:http_callback_method: "POST"result: callback_details...- await_callback:try:call: events.await_callbackargs:callback: ${callback_details}timeout: 3600result: callback_requestexcept:as: esteps:- update_status_to_error:...
In this example application, we combined the intelligent capabilities of Document AI to transform complex image documents into usable structured data, with Cloud Functions for data transformation, process triggering, and callback handling logic, and Workflows enabled us to orchestrate the underlying business process and its service call logic.
Going further
If you’re looking to make sense of your documents, turning dark data into structured information, be sure to check out what Document AI offers. You can also get your hands on a codelab to get started quickly, in which you’ll get a chance at processing handwritten forms. If you want to explore Workflows, quickstarts are available to guide you through your first steps, and likewise, another codelab explores the basics of Workflows. As mentioned earlier, for a concrete example, the source code of our smart expense application is available on Github. Don’t hesitate to reach out to us at @glaforge and @asrivas_dev to discuss smart scalable apps with us.
Wayfair Writes its Success Story with BigQuery for Internal Analytics

4923
Of your peers have already read this article.
4:00 Minutes
The most insightful time you'll spend today!
Editor’s note: Home-goods and furniture giant Wayfair first partnered up with Google Cloud to transform and scale its storefront—work that proved its value many times over during the unprecedented surge in ecommerce traffic during 2020. Today, we hear how BigQuery’s performance and cost optimization have transformed the company’s internal analytics to create an environment of “yes”.
At Wayfair, we have several unique challenges relating to the scale of our product catalog, our global delivery network, and our position in a multi-sided marketplace that supports both our customers and suppliers. To give you a sense of our scale we have a team of more than 3,000 engineers with tens of millions of customers. We supply more than 20 Million items using more than 16,000 supplier partners.
Serving those constituents generates a lot of analytics work. Wayfair runs over a billion ‘analytic’ database queries a year, from both humans and systems, against multi-petabyte datasets. Scaling our previous environment to meet these challenges required us to maintain dozens of copies of data for different use cases and manage complex data synchronization routines to move trillions of records each day, resulting in long development times and high support costs for our analytics projects.
Centralizing our data using Cloud Storage and BigQuery enabled us to break down existing silos and build unified pipelines for our batch and real-time operations. BigQuery shines by letting us decouple our compute and storage resources and flexibly ingest structured data in streaming and batch modes. We also benefit from the same decoupling for more complicated machine learning (ML) workflows in Dataproc and Cloud Storage. In particular, BigQuery is extremely low maintenance. From ML and easy data integrations to the integrated query cache, many out-of-the-box features have proven valuable for multiple use cases.
Beyond storage and compute, Google Cloud offers multiple tools to maximize the value of our data. For example, we can easily connect Data Studio to BigQuery for lightning-fast dashboarding of enterprise KPI reporting. When we need to dive deeper into a metric, Looker provides an interface and semantic model that empowers more business users to answer important questions — without understanding SQL or our vast dataset and table structure.
The combination of all of Google Cloud’s tools enables every Wayfairian the opportunity to self-serve their data visualization and analysis needs. We are able to support all of the requirements of our internal and external users, from descriptive analytics to alerting and ML, in a platform that blends Google’s proprietary technology with open-source standards.we have seen a greater than 90% reduction in the number of analytic queries in production that take more than one minute to run
As a result, we have seen a greater than 90% reduction in the number of analytic queries in production that take more than one minute to run, which delights our users and increases adoption of our analytics tools across the business.
Higher performance means saying “Yes” more often
We went into the BigQuery experience expecting very strong performance on large, aggregate queries and excellent scalability — the kind of performance that could enable consistent 5-15 minute processing queries and 5-10 second response times for large analytics queries.
We weren’t disappointed — we saw slightly better than linear performance profiles as record counts went up from millions to trillions for a flat resource allocation. BigQuery had the expected high performance for aggregate queries. This made our large data processing pipelines predictable and straightforward to maintain and optimize.
Below is a plot of gigabytes processed by a query against query run time in seconds; outliers are filtered and the axes are pruned to ranges where we had a large sample size. This focuses on longer-duration queries. As an example of the linear performance, a 2 terabyte query averages 5 minutes — 2.5min/terabyte — and an 18 terabyte query (9 times as much data) averages 25s — only 1.4min/terabyte. This is despite the fact that complex queries [sorting and analytic functions are particularly problematic] are more common with large data sizes. We do see increasing variability at large sizes as slot limits and other resource constraints come into play, but these factors are controllable and ultimately a business optimization decision.
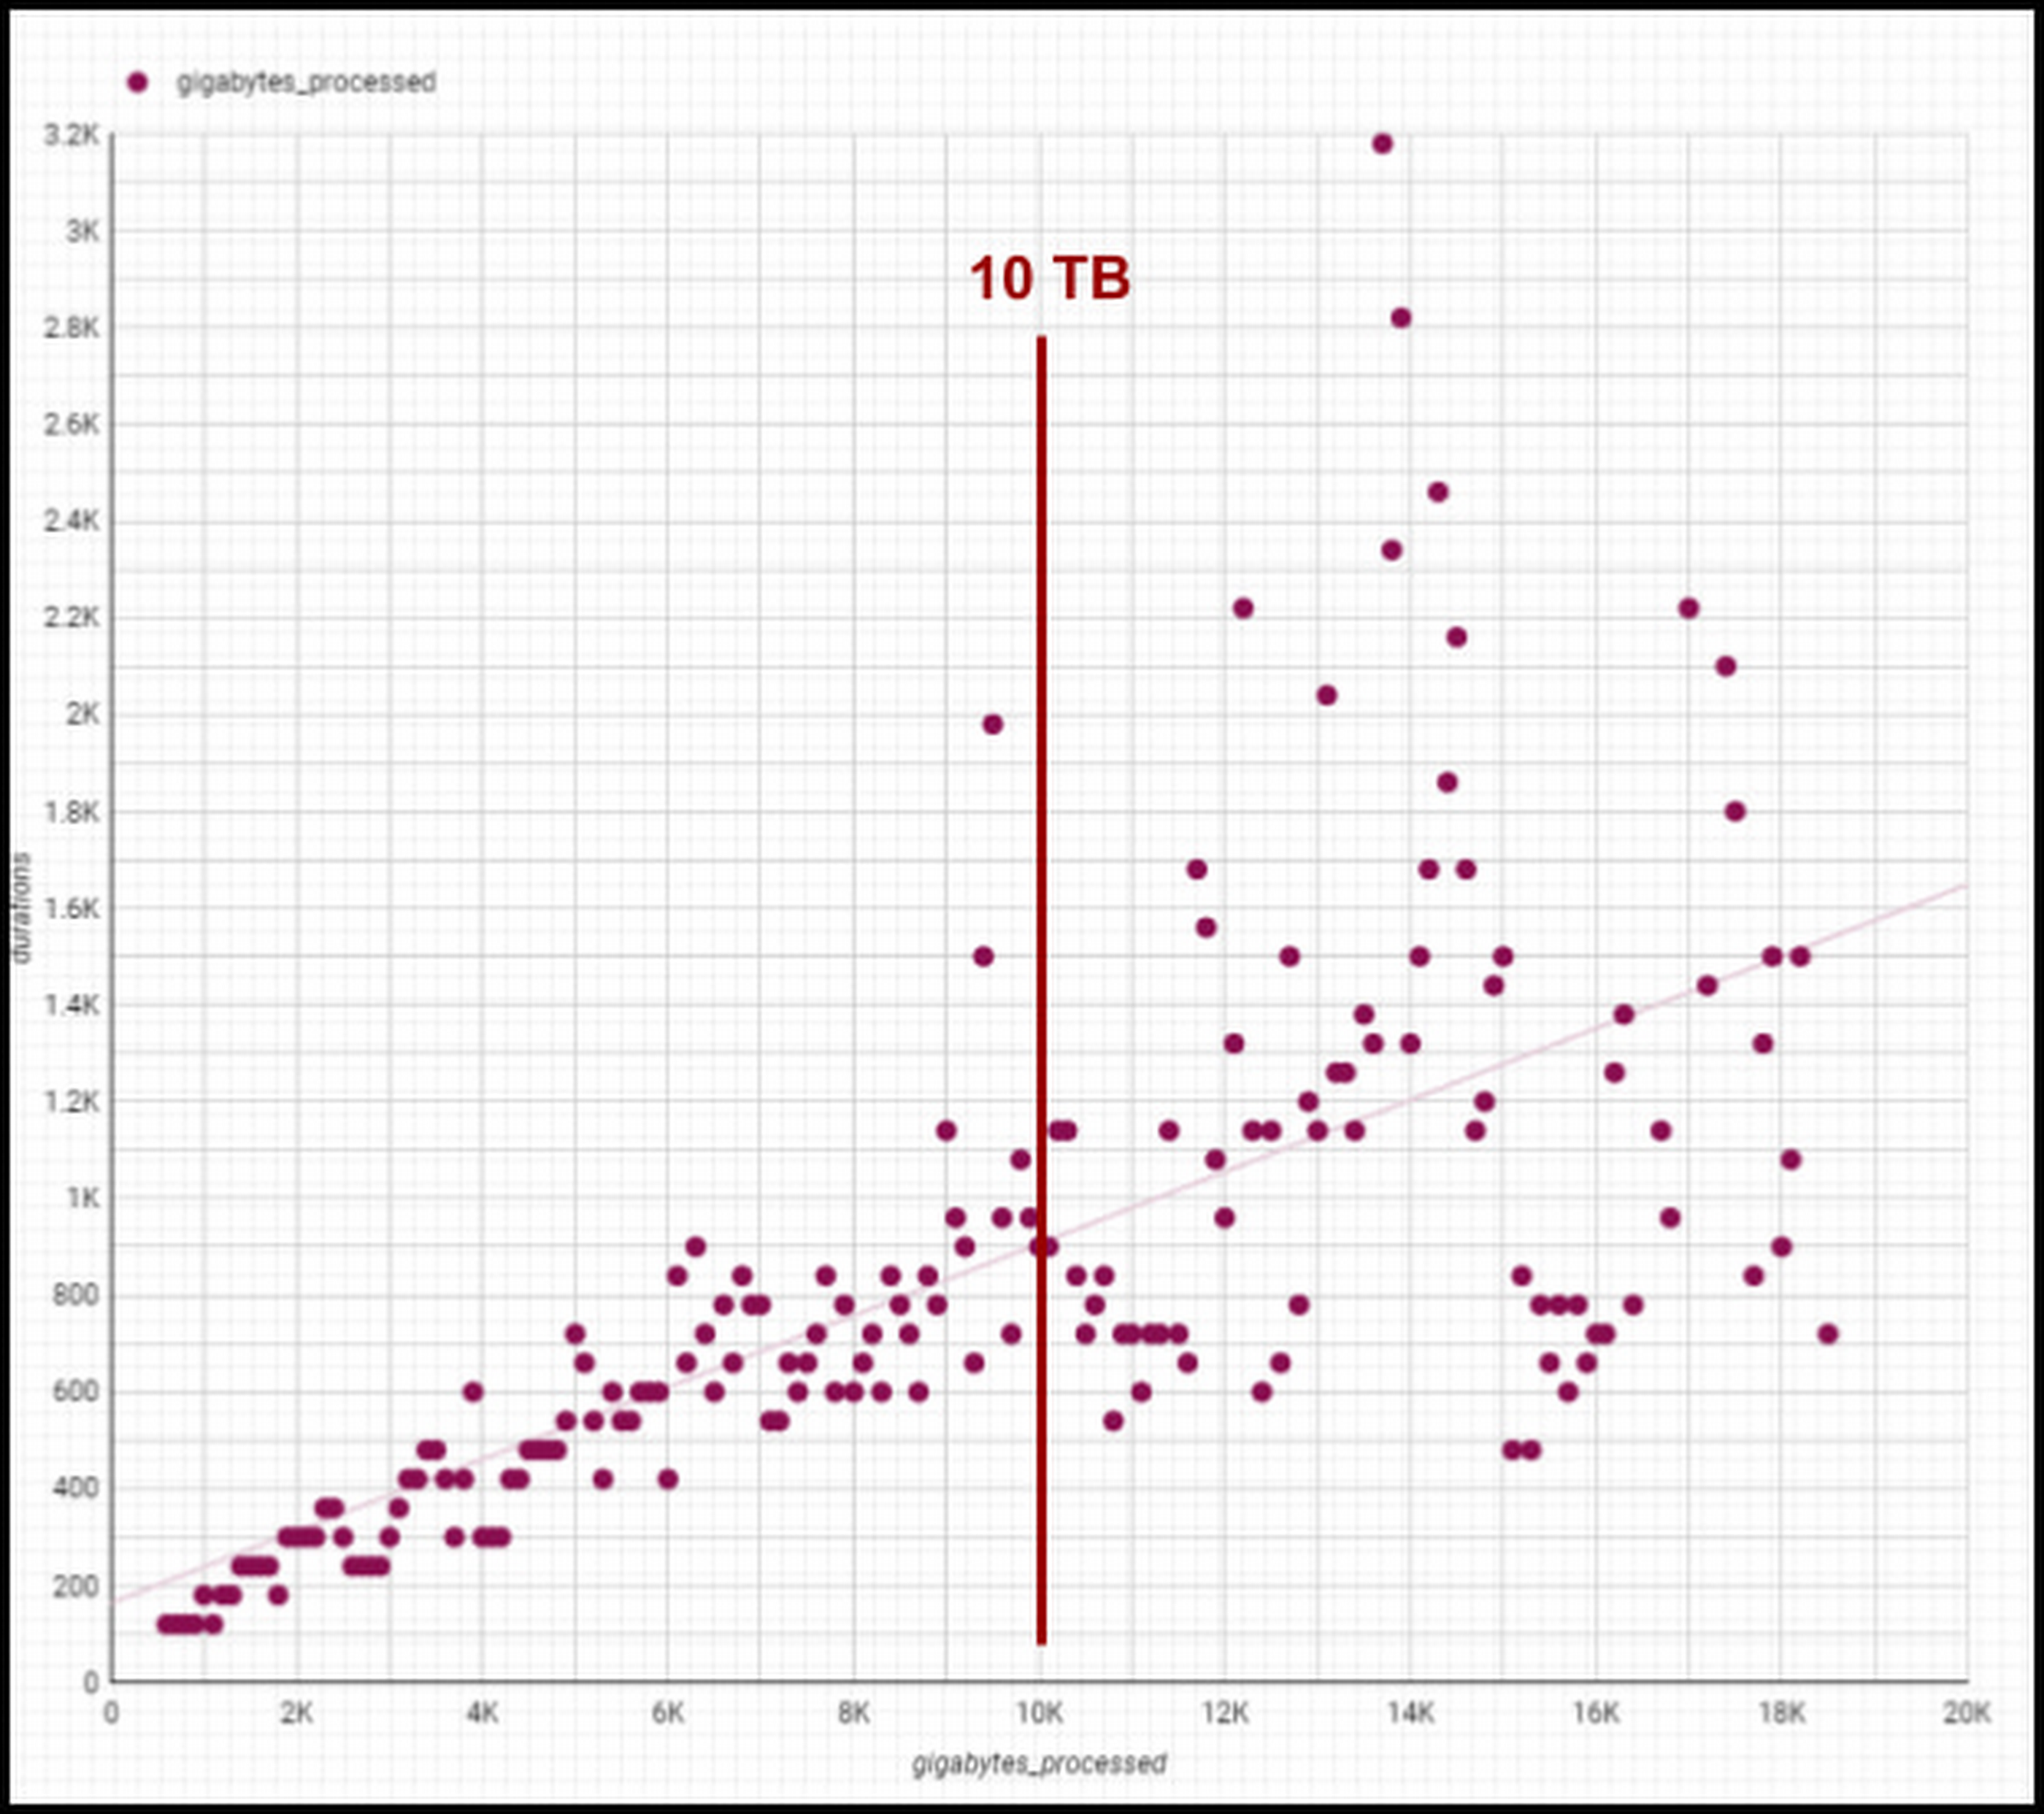
Though individual values vary greatly depending on query complexity [analytic functions/sorting can be computationally expensive], the overall trend line is below 1-1 for bytes versus duration, meaning our BigQuery query runtimes are increasing slower than our data volumes. We are still seeing sub 1:1 threshold runtimes, and we’re already at 100 PB of total data with single queries running on 50PB or more. Going strong!
One unexpected and pleasant surprise has been high performance for smaller queries, such as those required for development, interactive analytics, and internal applications we use for forecasting, segmentation, and other latency-sensitive data workflows. BigQuery’s resource management systems have provided smoother degradation and parallelism profiles than we initially expected for a multi-tenant platform.
We regularly see sub-second p50 query performance for interactive use cases, with p90 performance coming in under 10 seconds for Looker, Data Studio, and AtScale — meeting the threshold we set to avoid analysts losing focus during a business investigation. The chart below shows p50, p90, and p95 timing for core workloads, as well as the number of queries in each bucket and the number of unique users. [Looker and Atscale will use small numbers of service accounts for a large number of users].

This has enabled two important shifts in the way our customers experience analytics services:
- Delivering better user productivity. People no longer have long wait times to get results for a basic query delivering an improved overall user experience.
- Scaling our data transformation. BigQuery has proven, effective data transformation that allows us to embrace the industry shift away towards ELT (extract, load, transform) to transform raw data right within the database.
We no longer have to ask ourselves, “Can we meet the SLA for this data processing task?” The new conversation is, “Of course, we can meet it. What’s the associated cost based on how many resources we assign?” We can make cost and resource trade-offs clear to our users and say “yes” more often to requirements that have measurable business value.
Supporting cost vs. performance decisions
Democratized access to internal analytics is a powerful decision-making tool. With BigQuery’s robust tooling, the decision about how to best allocate computational resources is in the hands of the analytics groups closest to the business decision being made. If they want to spend a sprint optimizing a dashboard, they can show exactly how much money it will save. If they choose not to optimize a report, they can offset the decision with concrete cost savings and other realized value.
Wayfair teams also benefit from visibility into their committed costs by abstracting away the details of the underlying services, including BigQuery slots, the virtual CPUs used to execute SQL queries.
Take a look at this example view consumed by our teams (the metrics for these dashboards are from the BigQuery INFORMATION_SCHEMA (jobs and reservations tables):
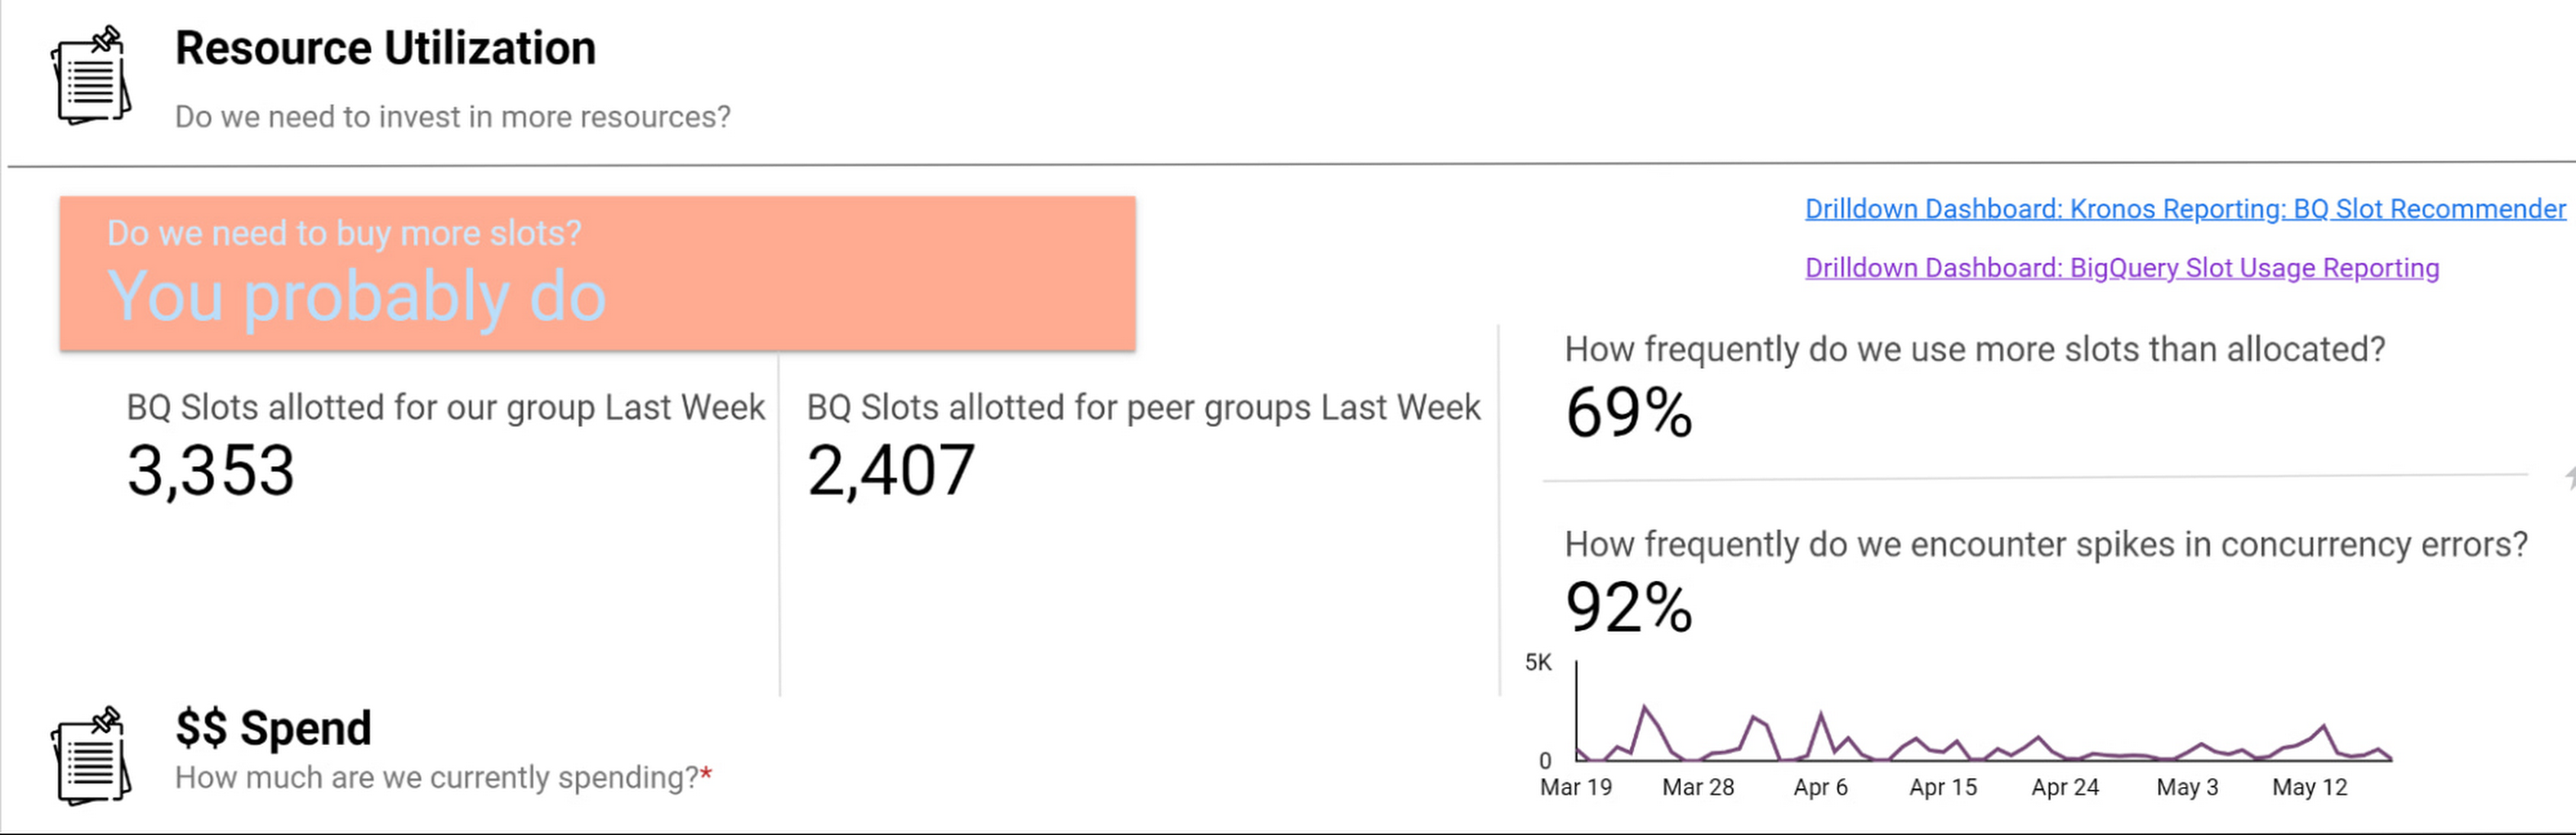
Suppose an organization wants to purchase capacity for a period of time. In that case, we provide an average cost for a slot during that time and charge them based on their slot usage for queries, multiplied by the average price.
Teams can see whether their consumption matches their reservations with a consistent, high-level number. We apply the same approach to tools like Dataproc by aggregating up the costs of component services and providing an organizational cost for those services.
How we use performance signals to improve user efficiency
Instead of overcorrecting for occasional performance fluctuations by allocating excessive resources, we try to align incentives so that people make the right choices for the business. Showback doesn’t work in a vacuum — it requires context and integrated insights. Teams need to show the cost of running a dashboard as well as the ROI is in terms of end user engagement and what peer dashboards with equivalent source datasets might cost.
We want to give users the freedom to do things the way they want and need to while also educating them on achieving their goals and using best practices to reduce their costs and improve their performance. The goal is never for all dashboards to load “less than x seconds” — we believe that any dashboard can load in x seconds when it is properly designed and resourced.
For instance, BigQuery allocates slots for a new workload quickly and efficiently, and queries that are optimized and have dedicated resources consistently complete quickly. When users experience a slowdown, it’s typically because they are sharing resources or inefficiently using their resources. Variable performance is a useful signal to help users discover opportunities to optimize queries and work more productively. We value these signals as we like to focus on the aggregate experience of all users interacting with the tool, not individual interaction.
A natural way to improve user efficiency is to reward ideal behaviors and discourage those that do not align with our analytics strategy. Some examples include splitting out high-demand reporting from ad-hoc exploration to reduce concurrency errors or encouraging people to use materialized tables instead of writing complex custom SQL. For instance, a dedicated reporting project might only include an organization’s Data Studio dashboard if it directly references a table or meets other optimization requirements. Using this approach, we give our users a high degree of freedom and experimentation at the entry-level while providing a well-documented path to scale.
Visibility into query performance improves business performance
The detailed tracking information we get from Google Cloud products is critical — Google’s robust analytics performance has enabled us to scale Data Studio to over 15,000 Wayfarians. Of course, a larger user base always comes with concerns that less sophisticated users may not appropriately optimize their queries or make the best use of the infrastructure.
Evaluating the different Data Studio dashboards helps us identify opportunities to use better query optimization practices, such as reducing custom queries, connecting directly to permanent tables, or using the BI Engine to improve dashboard performance. Recently, our team built new billing projects specific for Data Studio reporting. We can scale up a reservation dedicated to reporting about a major sales event in minutes.
Beyond everyday reporting, holidays and sales events may require higher, guaranteed performance. BigQuery’s flexible capacity commitments allow us to decide at a business level whether an urgent need requires us to reprioritize resources immediately or whether we have the time to optimize queries and rebuild dashboards to be performant. These new billing projects let us evaluate if teams need to scale up resourcing, what areas they can optimize in BigQuery, or if a new reservation is needed to resource that team separately.
Recommendations for achieving high performance at low cost
Are you wondering how to allocate BigQuery slots? Teams must see direct, immediate return on their investment in performance and optimization.
Our first rule of thumb is to align resource utilization with ownership as closely as possible. This makes it easier for teams to secure dedicated resources, even if they start out small. We’re comfortable doing this because BigQuery dynamically reassigns capacity between the targeted reservation and other consumers in milliseconds. We always get the total usage of our slots — there is no wasted capacity even when we break assignments down granularly.
Once a team has a reservation, we provide reporting that consumes various BigQuery information schema views, such as query logs and reservation information, and processes it into aggregated reporting. We look for metrics like the average slots available to a query at a point in time, overall query performance, and how long queries took to execute to pinpoint the overall health of a reservation against our business objectives. Flex slots also let us experiment easily with additional capacity, and BigQuery’s performance is so consistent that we can use straightforward models to estimate return on additional slot investment.
Other key cost optimization tips we have found helpful at Wayfair include:
- Optimize for worst-case performance. Given BigQuery’s ability to share slots, we expect teams will often see much better performance, but we find that thinking it’s more effective when teams think about the most pessimistic case when resourcing their jobs.
- Take advantage of BI Engine reservations. We like to think critically about the data and workload. BI Engine reservations are excellent for workloads that query lots of small dimension tables or a few larger tables loaded into memory. In cases like that, such as with OLAP tools using pre-computed aggregates, we’ve seen BI engine investments drive a 25% reduction in average query time—excellent ROI.
- Leverage Looker for large, longitudinal datasets. Since Looker supports a wide range of use cases, we see a broader range of performance — p50 is still under a second, but p95 can get as high as a minute. For these cases, we recommend modeling user patterns [first of month, first day of week] and dynamically allocating more slots for these periods while deprioritizing batch workloads in the key windows.
- Lean in heavily on the BQ cache for broad-based reporting. To avoid a Monday morning reporting lag, We use the BigQuery cache to avoid Monday morning report loading lags. Up to 30% of our Data Studio queries hit the BQ cache, ensuring our Data Studio p95 consistently stays under 10 seconds.
- Use slots-per-job to improve experience. In our reporting, we find that the most valuable view is slots-per-job. We look for dips in slots available for jobs as this situation often correlates strongly with poor user experiences. For example, our reporting showed us that Looker has the highest volumes of queries and users on Mondays and during each month’s first two business days. We used this information to scale up slots to support these periods of highest demand, delivering on performance SLAs to support business users.

- Get a global picture of usage. We manage slots in a central tool. Teams input their requirements into a calendar to indicate when they want higher or lower capacity to inform our flex slot purchases and annual commitments. It might seem like dozens of relatively inconsistent workloads at the team level, but the picture changes when you look at demand across a week (or our entire business). Understanding global usage makes it easy for us to model baseline capacity recommendations for serving year slots versus flexible demands.
Reaping the rewards of BigQuery
From our first initial undertaking with Google Cloud to transform our storefront, we had a lot of confidence in the underlying technology offerings and the teams that ran them and their ability to meet our unique requirements. But our experience using BigQuery for internal analytics at Wayfair has exceeded our already high expectations.
BigQuery’s fast, dynamic allocation of resources and ability to transform data in place are important to our mission of maintaining consistently high performance for our users while closely managing costs. Moreover, our visibility into query and dashboard performance through BigQuery’s DSP views and other performance metrics have helped us make clearer connections between performance goals and the costs required to meet them — and guide our analysts across the company towards attaining high performance on every project.
Canadian Bank’s SAP Workload Moved to BigQuery Helps Unlock New Business Opportunities

7337
Of your peers have already read this article.
2:00 Minutes
The most insightful time you'll spend today!
When ATB Financial decided to migrate its vast SAP landscape to the cloud, the primary goal was to focus on things that matter to customers as opposed to IT infrastructure. Based in Alberta, Canada, ATB Financial serves over 800,000 customers through hundreds of branches as well as digital banking options. To keep pace with competition from large banks and FinTech startups and to meet the increasing 24/7 demands of customers, digital transformation was a must. To support this new mandate, in 2019, ATB migrated its extensive SAP backbone to Google Cloud. In addition to SAP S/4 HANA, ATB runs SAP financial services, core banking, payment engine, CRM and business warehouse on Google Cloud.
In parallel, changes were needed to ATB’s legacy data platform. The platform had stability and reliability issues and also suffered from a lack of historical data governance. Analytics processes were ad hoc and manual. The legacy data environment was also not set up to tackle future business requirements that come with a high dependency on real-time data analysis and insights.
After evaluating several potential solutions, ATB chose BigQuery as a serverless data warehouse and data lake for its next-generation, cloud-native architecture. “BigQuery is a core component of what we call our data exposure enablement platform, or DEEP,” explains Dan Semmens, Head of Data and AI at ATB Financial. According to Semmens, DEEP consists of four pillars, all of which depend on Google Cloud and BigQuery to be successful:
- Real-time data acquisition: ATB uses BigQuery throughout its data pipeline, starting with sourcing, processing, and preparation, moving along to storage and organization, then discovery and access, and finally consumption and servicing. So far, ATB has ingested and classified 80% of its core SAP banking data as well as data from a number of its third-party partners, such as its treasury and cash management platform provider, its credit card provider, and its call center software.
- Data enrichment: Before migrating to Google Cloud, ATB managed a number of disconnected technologies that made data consolidation difficult. The legacy environment could handle only structured data, whereas Google Cloud and BigQuery lets the bank incorporate unstructured data sets, including sensor data, social network activity, voice, text, and images. ATB’s data enrichment program has enabled more than 160 of the bank’s top-priority insights running on BigQuery, including credit health decision models, financial reporting, and forecasting, as well as operational reporting for departments across the organization. Jobs such as marketing campaigns and month-end processes that used to take five to eight hours now run in seconds, saving over CA$2.24 million in productivity.
- Self-service analytics: Data for self-service reporting, dashboarding, and visualization is now available for ATB’s 400+ business users and data analysts. Previously, bringing data and analytics to the business users who needed it while ensuring security was burdensome for IT, fraught with recurrent data preparation and other highly manual elements. Now, ATB automates much of its data protection and governance controls through the entire data lifecycle management process. Data access is not only open to more team members but it is faster and easier to acquire without compromising security. And it’s not just raw data that users can access. ATB uses BigQuery to define its enterprise data models and create what it calls its data service layer to make it easier for team members to visualize their data.
- AI-assisted analytics and automation: Through Google Cloud and BigQuery, ATB has been able to publish data and ML models that provide alerts and notifications via APIs to customer service agents. These real-time recommendations allow customer service agents to provide more tailored service with contextualized advice and suggested new services. So far, the company has deployed more than 40 ML models to generate over 20,000 AI-assisted conversations per month. Thanks to improved customer advocacy and less churn, the bank has realized more than CA$4 million in operating revenue. During the ongoing COVID crisis, the system was also able to predict when business and personal banking customers were experiencing financial distress so that a relationship manager could proactively reach out to offer support, such as payment deferral or loan restructuring. The AI tools provided by BigQuery are also helping ATB detect fraud that previously evaded rules-based fraud detection by using broader sets of timely and accurate data.
Thanks to the speed and ease of moving data from SAP to BigQuery, ATB is using artificial intelligence (AI) and machine learning (ML) to do things it previously hadn’t thought possible, including sophisticated fraud prevention models, product recommendations, and enriched CRM data that improves the customer experience.
Using the power of Google Cloud and BigQuery, ATB Financial has been able to draw more value from its SAP data while lowering cost and improving security and reliability. Speed to provide data sets and insights to internal team members has improved 30%. The bank also has seen a 15x reduction in performance incidents while improving data governance and security. Dan Semmens projects that the digital transformation strategy built on Google Cloud and BigQuery has both saved millions compared to its on-premises environment and has also realized millions in new business opportunities.
Semmens is looking toward the future that includes initiatives like Open Banking and greater ability to provide real time personalized advice for customers to drive revenue growth. “We see our data platform as foundational to ATB’s 10-year strategy,” he says. “The work we’ve undertaken over the past 18 months has enabled critical functionality for that future.”
Learn more about how ATB Financial is leveraging BigQuery to gain more from SAP data. Visit us here to explore how Google Cloud, BigQuery, and other tools can unlock the full value of your SAP enterprise data.
Case Study: When Database Choice Powers New Revenue-driving Product Features

4158
Of your peers have already read this article.
4:30 Minutes
The most insightful time you'll spend today!
Editor’s note: Streak makes a CRM add-on for Gmail, and recently adopted Cloud Spanner to take advantage of its scalability and SQL capabilities to implement a graph data model. Read on to learn about their decision, what they love about the system, and the ways in which it still needs work.]
Streak is a customer relationship management (CRM) tool built directly into Gmail. It is used for sales, marketing, hiring, and just about anything else you can think of.
We built it because out of the box, email is actually a really crummy team sharing system. By adding a layer of organization on top of email, Streak lets you add email threads directly into its spreadsheet view, making it useful as a workflow tool with capabilities including task creation, email template management, and easy data entry.
Streak has been integrated with G Suite (originally Google Apps For Your Domain) since its inception so when choosing a cloud, it made sense to colocate our server stack with Google Cloud.
Likewise, Streak was on Google App Engine from the start, and we slowly added other GCP services as the offerings improved or as our use cases became more complex.
In addition to App Engine, we use Google Kubernetes Engine to run a bunch of our compute workload, including both application servers and our offline processes like indexers and task queue consumers.
We use Cloud Dataflow for both streaming event processing and logs ETL, and BigQuery for all of our analytics queries. We use Cloud Pub/Sub for interacting with the Gmail watch API, as well as Stackdriver (logging, tracing, monitoring, errors) and OpenCensus to dig into any operational issues as they arise.
Then, on the database front, we recently started using Cloud Spanner, Google Cloud’s scalable relational database service. Before that, we stored most of our business data in Cloud Datastore, Google Cloud’s NoSQL document database.
Partially, that was historical, since Cloud Datastore was GCP’s only managed database when we wrote the Streak backend. And we’ve been very happy with how easy Cloud Datastore is to maintain. Between Google App Engine and Cloud Datastore, we’ve never had to have an explicit infrastructure on-call rotation.
But as more users rely on Streak to collaborate with larger and larger teams, we were feeling the pain of not having a fully relational database. We found ourselves having to manually join data in our application, which increased application latency and increased the time developers spent coding workarounds and debugging that complexity.
We found we needed two things out of our database: a scalable relational store and a graph store that could power next-gen Streak features. At the same time, we wanted a single database that could handle both use cases and wouldn’t increase our operational burden. This meant finding a managed service to give us more query flexibility, so we decided to give Cloud Spanner a try.
Of course, we didn’t want to migrate our existing stack to a new data platform without first testing it out (never a smart strategy). But since most of our existing data model required transactional updates with other entities, pulling out a single entity to test was challenging. We did have a feature in our pipeline that necessitated a graph data store and that was removed from our other data: our email metadata indexing system.
How your client software handles email metadata indexing can make or break the useability of a system. Think about how many times somebody forgets to reply-all or that you receive a forwarded thread with thirty emails in reverse-chronological order. Within our own inboxes, we rely on Gmail’s UI to nicely organize email threads, but that organization breaks down when working with a team or across organizational boundaries.
We decided to fix that in the Streak product by organizing metadata (i.e., headers but not message content) from users’ email by using Cloud Spanner as a graph database. Using a graph database lets us answer questions like “What are all the emails on this thread in the inboxes of everybody on my team?” and “Who on my team has previously talked with the organization that this prospect works at?”
In our model, the nodes of the graph are either an email message, a person (email address) or a company (a domain). Then we have four different types of “edges”— properties by which nodes in a graph connect to one another:
- Message to message (thread): messages that are on the same thread have an edge between them. The reason we do this is because we want to show users a list of threads to answer their questions, not messages, so we need to be able to get the spanning set of messages.
- Message to message (same RFC id): A core value proposition of Streak is being able to see the “unified” version of a thread that shows each person on a team’s version of the email thread. To make sure we are getting each user’s version of a thread when we issue a query, there needs to be an edge between a message in the queryer’s inbox and the same message in their team’s inbox. In case you’re curious, Streak uses the RFC message id to determine that two messages across inboxes are actually the same.
- Email address to message: a message has an edge to an email address if it was either the from, to, cc, or bcc on the message. This edge is crucial for queries that start with: “Show me all threads between this person and our team.”
Domain to message: a message has an edge to a domain if the domain is present in any of the from, to, cc, or bcc addresses on the message. This edge is similarly used for queries that start with “Show me all threads between this company and our team.”
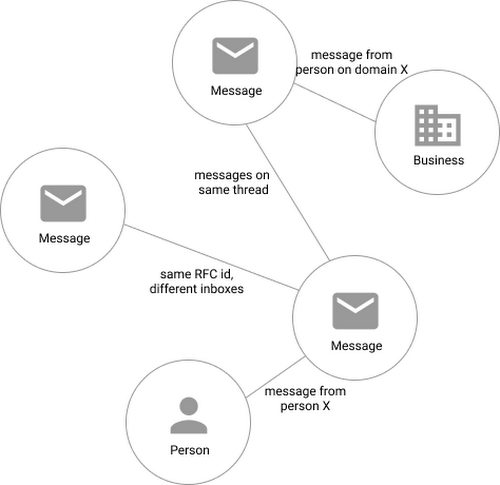
Using Cloud Spanner’s distributed SQL capabilities and scalability to build a graph database also let us answer the important follow-up question: “Which threads have I been granted permission to view?” And while a lot of these questions could be answered per-user by a traditional relational database, scale limitations have to be taken into consideration, especially as we plan for 10x or more data volume growth as both our user base grows and as their inboxes accumulate more emails. A graph database model is simply a better fit for Streak’s collaboration model with many-to-many mappings between users and teams, and will allow us to query the data in any number of configurations, without worrying about scale limitations or having to manually shard a relational database. Cloud Spanner gives us queryability and scalability.
Taking the Cloud Spanner plunge
With so many advantages to it, we went ahead and began building out our metadata system with Cloud Spanner as a back-end.
Adopting Cloud Spanner has been great. Here are some of the high points:
- The fast distributed queries and transactions are absolutely real. We have global indexes across our entire dataset and we haven’t had to spend very much time at all thinking about co-locating data. In particular, we only use interleaved tables for values that would be repeated fields in Cloud Datastore, and that hasn’t been a problem for us yet.
- We haven’t had any reliability problems whatsoever, despite averaging 20K writes/sec in steady state.
- Once we optimized our queries on realistic data, Cloud Spanner scaled up in a surprisingly predictable way. You need to run queries after you’ve populated data, do the explain to figure out how the query planner is executing the query, and add indexes/modify queries to make sure they’re performant.
- Compared to the hoops some traditional relational databases make you jump through, Cloud Spanner’s online schema changes and index builds are magical. There is no downtime for these operations.
Overall, the experience has been encouraging, and we’re planning to move 20 TB of existing data in Cloud Datastore to Cloud Spanner as well. We built out an ORM library for Java on top of Cloud Spanner called Ratchet and are testing a framework for dual-writing entities to both Cloud Datastore and Cloud Spanner to support the rest of the migration. We now store about 40 TB of email metadata in Cloud Spanner, which makes us a large user of Cloud Spanner.
In short, if you’re starting to outgrow your NoSQL database, and want to move to a managed SQL database, give Cloud Spanner a try. You definitely want to model out your costs and try out a proof of concept, both to see how it works on your workload and to get familiar with the quirks of the system. But you don’t need to spend much time worrying about the reliability of the product: it’s there.
Developers and Practitioners’ Guide for Moving On-prem Data Warehouse to BigQuery

5405
Of your peers have already read this article.
3:00 Minutes
The most insightful time you'll spend today!
Data teams across companies have continuous challenges of consolidating data, processing it and making it useful. They deal with challenges such as a mixture of multiple ETL jobs, long ETL windows capacity-bound on-premise data warehouses and ever-increasing demands from users. They also need to make sure that the downstream requirements of ML, reporting and analytics are met with the data processing. And, they need to plan for the future – how will more data be handled and how new downstream teams will be supported?
Checkout how Independence Health Group is addressing their enterprise data warehouse (EDW) migration in the video above.
Why BigQuery?
On-premises data warehouses become difficult to scale so most companies’ biggest goal is to create a forward looking system to store data that is secure, scalable and cost effective. GCP’s BigQuery is serverless, highly scalable, and cost-effective and is a great technical fit for the EDW use-case. It’s a multicloud data warehouse designed for business agility. But, migrating a large, highly-integrated data warehouse from on-premise to BigQuery is not a flip-a-switch kinda migration. You need to make sure your downstream systems dont break due to inconsistent results in migrating datasets, both during and after the migration. So..you have to plan your migration.
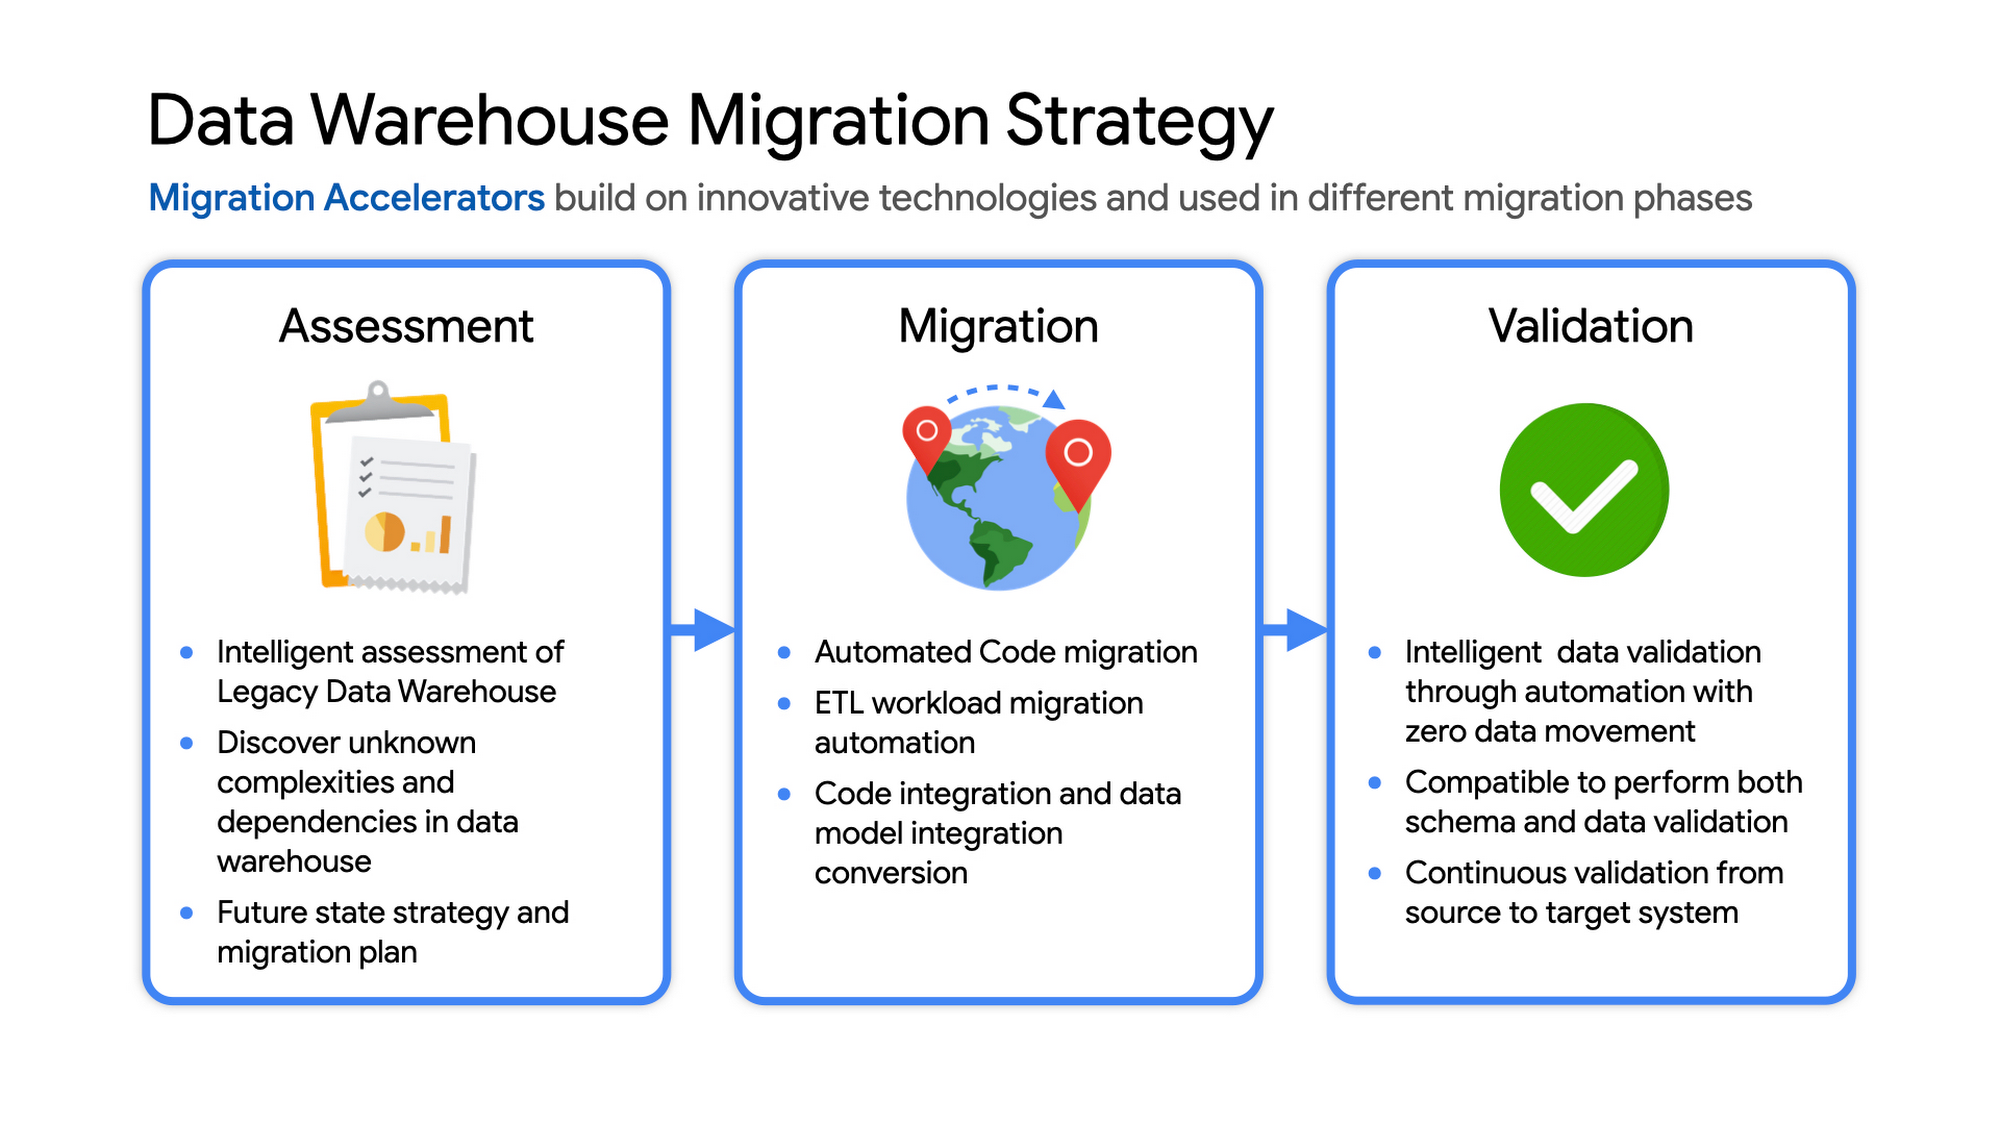
Data warehouse migration strategy
The following steps are typical for a successful migration:
- Assessment and planning: Find the scope in advance to plan the migration of the legacy data warehouse
- Identify data groupings, application access patterns and capacities
- Use tools and utilities to identify unknown complexities and dependencies
- Identify required application conversions and testing
- Determine initial processing and storage capacity for budget forecasting and capacity planning
- Consider growth and changes anticipated during the migration period
- Develop a future state strategy and vision to guide design
- Migration: Establish GCP foundation and begin migration
- As the cloud foundation is being set up, consider running focused POCs to validate data migration processes and timelines
- Look for automated utilities to help with any required code migration
- Plan to maintain data synchronization between legacy and target EDW during the duration of the migration. This becomes a critical business process to keep the project on schedule.
- Plan to integrate some enterprise tooling to help existing teams span both environments
- Consider current data access patterns among EDW user communities and how they will map to similar controls available in Big Query.
- Key scope includes code integration and data model conversions
- Expect to refine capacity forecasts and refine allocation design. In Big Query there are many options to balance cost and performance to maximize business value. For example, you can use either on-demand or flat-rate slot pricing or a combination of both.
- Validation and testing
- Look for tools to allow automated, intelligent data validation
- Scope must include both schema and data validation
- Ideally solutions will allow continuous validation from source to target system during migration
- Testing complexity and duration will be driven by number and complexity of applications consuming data from the EDW and rate of change of those applications
A key to successful migration is finding Google Cloud partners with experience migrating EDW workloads. For example, our Google Cloud partner Datametica offers services and specialized Migration Accelerators for each of these migration stages to make it more efficient to plan and execute migrations.
Data warehouse migration: Things to consider
- Financial benefits of open source: Target moving to ‘Open Source’ where none of the services have license fees. For example BigQuery uses Standard SQL; Cloud Composer is managed Apache Airflow, Dataflow is based on Apache Beam. Taking these as managed services provides the financial benefits of open source, but avoids the burden of maintaining open source platforms internally.
- Serverless: Move to “serverless” big data services. The majority of the services used in a recommended GCP data architecture scale on demand allowing more cost effective alignment with needs. Using fully managed services lets you focus engineering time on business roadmap priorities, not building and maintaining infrastructure.
- Efficiencies of a Unified platform: Any data warehouse migration involves integration with services that surround the EDW for data ingest and pre-processing and advanced analytics on the data stored in the EDW to maximize business value. A cloud provider like GCP offers a full breadth of integrated and managed ‘big data’ services with built-in machine learning. This can yield significantly reduced long-term TCO by increasing both operational and cost efficiency when compared to EDW-specific point solutions.
- Establishing a solid cloud foundation: From the beginning, take the time to design a secure foundation that will serve the business and technical needs for workloads to follow. Key features include: Scalable Resource Hierarchy, Multi-layer security, multi-tiered network and data center strategy and automation using Infrastructure-as-Code. Also allow time to integrate cloud-based services into existing enterprise systems such as CI/CD pipelines, monitoring, alerting, logging, process scheduling, and service request management.
- Unlimited expansion capacity: Moving to cloud sounds like a major step, but really look at this as adding more data centers accessible to your teams. Of course, these data centers offer many new services that are very difficult to develop in-house and provide nearly unlimited expansion capacity with minimal up-front financial commitment. .
- Patience and interim platforms: Migrating an EDW is typically a long running project. Be ready to design and operate interim platforms for data synchronization, validation and application testing. Consider the impact on up-stream and down-stream systems. It might make sense to migrate and modernize these systems concurrent with the EDW migration since they are probably data sources and sinks and may be facing similar growth challenges. Also be ready to accommodate new business requirements that develop during the migration. Take advantage of the long duration to have existing your operational teams learn new services from the partner leading the deployment so your teams are ready to take over post-migration.
- Experienced partner: An EDW migration can be a major undertaking with challenges and risks during migration, but offers tremendous opportunities to reduce costs, simplify operations and offer dramatically improved capacities to internal and external EDW users. Selecting the right partner reduces the technical and financial risks, and allows you to plan for and possibly start leveraging these long-term benefits early in the migration process.
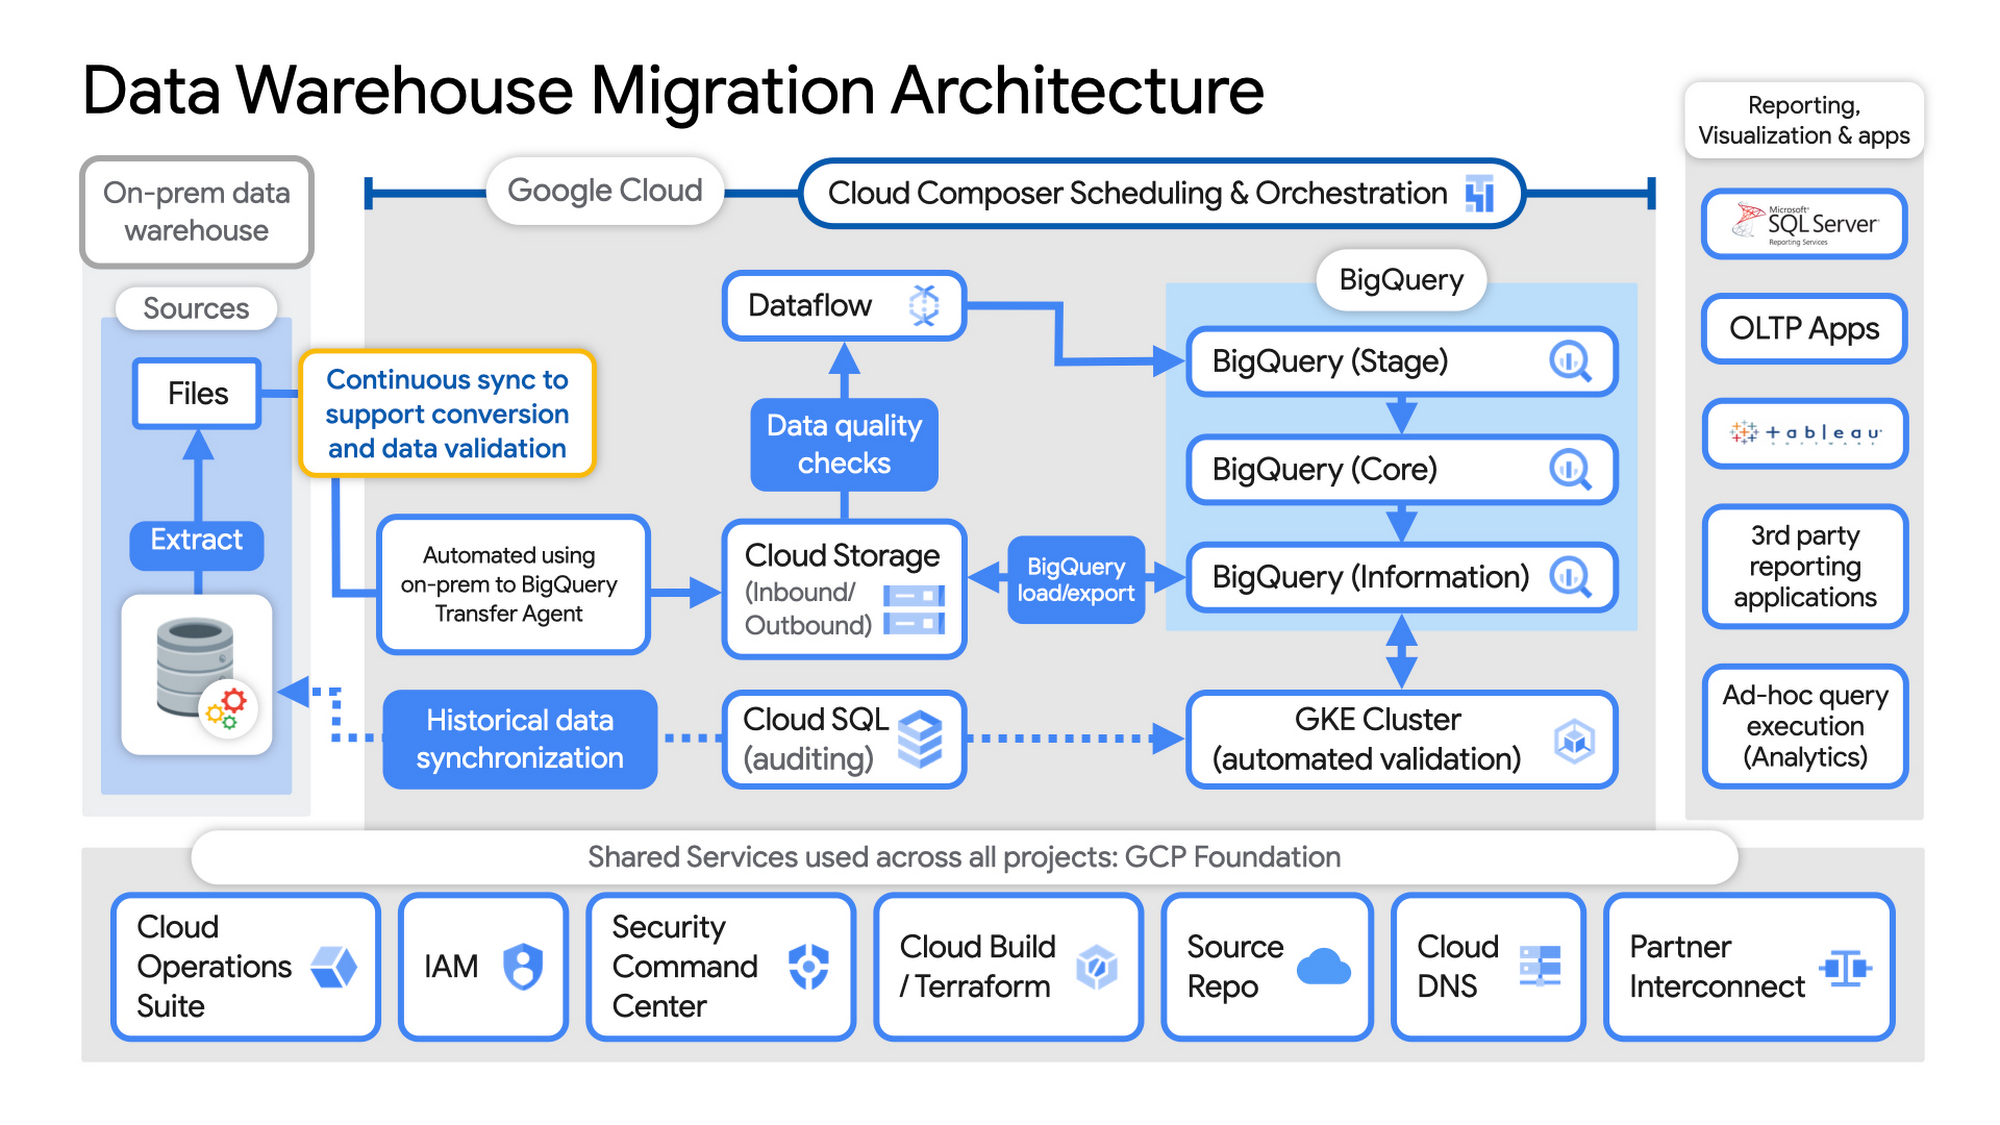
Example Data Warehouse Migration Architecture
- Setup foundational elements. In GCP these include, IAM for authorization and access, cloud resource hierarchy, billing, networking, code pipelines, Infrastructure as Code using Cloud Build with Terraform ( GCP Foundation Toolkit), Cloud DNS and a dedicated/partner Interconnect to connect to the current data centers.
- Activate monitoring and security scanning services before real user data is loaded using Cloud Operations for monitoring and logging and Security Command Center for security monitoring.
- Extract files from on-premise legacy EDW and move to Cloud Storage and establish on-going synchronization using Big Query Transfer services.
- From Cloud Storage, process the data in Dataflow and Load/Export data to BigQuery.
- Validate the export using Datametica’s validation utilities running in a GKE cluster and Cloud SQL for auditing and historical data synchronization as needed. Application teams test against the validated data sets throughout the migration process.
- Orchestrate the entire pipeline using Cloud Composer, integrated with on-prem scheduling services as needed to leverage established processes and keep legacy and new systems in sync.
- Maintain close coordination with teams/services ingesting new data into the EDW and down-streams analytics teams relying on the EDW data for on-going advanced analytics.
- Establish fine-grained access controls to data sets and start making the data in Big Query available to existing reporting, visualization and application consumption tools using BigQuery data connectors for ‘down-stream’ user access and testing.
- Incrementally increase Big Query flat-rate processing capacity to provide the most cost-effective utilization of resources during migration.
To learn more about migrating from on-premises Enterprise Data Warehouses (EDW) to Bigquery and GCP here.
The Divercity Story: Using Google Cloud to Achieve a More Inclusive and Sustainable Workforce

4738
Of your peers have already read this article.
2:30 Minutes
The most insightful time you'll spend today!
Despite a growing number of diversity, equity, and inclusion (DEI) initiatives, Black and Latinx people remain highly underrepresented in tech. Although comprising 12.6% and 18% of the U.S. labor force respectively, Black professionals hold only 5% of tech positions, while Latinx professionals fill just 6% of tech roles.
Long-standing biases in hiring practices and non-inclusive work environments are the primary contributors to this lack of diversity. Even when underrepresented professionals are successfully recruited, invisible barriers to promotion and layoffs that disproportionally impact Black and Latinx employees make it extremely challenging for tech firms to retain top talent.
We founded Divercity to help employers build diverse workforces that are more inclusive and sustainable. With our comprehensive recruiting and retention platform, tech companies can accurately measure employee diversity and gender parity, seamlessly connect with underrepresented talent, and significantly reduce turnover.
As Divercity continues to grow, we’ll introduce new services and solutions that empower the tech world to build inclusive companies while improving compliance with state and federal equal opportunity laws. We also hope to expand the reach of Divercity to support DEI initiatives in non-tech industries and bolster recruiting underrepresented professionals in other countries as well.

Scaling Divercity with the help of the Google for Startups Black Founders Fund
Shortly after founding Divercity, we participated in the 2021 Techstars Workforce Development Accelerator. The incredible support and guidance we received during and after the program highlighted the importance of long-term collaboration with reliable technology partners who actively champion diversity and inclusion.
That’s why we became part of the Google for Startups Cloud Program. After completing the program, we used Google Cloud credits and Google for Startups Black Founders Fund funding to cost-effectively trial, deploy, and scale key Google Cloud solutions. In just months, we rolled out new inclusion tracking and recruiting tools on the highly secure-by-design infrastructure of Google Cloud to expedite the sourcing and hiring of underrepresented talent in the tech industry.
With the support and mentorship of the Google for Startups Cloud Program and the Black Founders Fund, Divercity is well on its way to becoming one of the industry’s most trusted sites for DEI measurement, recruitment, and retention.
Delivering predictive diversity analyses with a 99% accuracy rate
We rely on the expansive Google Cloud ecosystem to power all the services offered on the Divercity platform. Specifically, we leverage Colab to write and execute the sophisticated TensorFlow machine learning (ML) models that deliver our predictive diversity analyses with a 99% accuracy rate.
We also use BigQuery to democratize insights and run analytics at scale with 27% lower three-year TCO than cloud data warehouse alternatives. BigQuery seamlessly integrates with Looker and Data Studio to display company diversity and recruitment data on interactive dashboards—and automatically populate reports with detailed demographic information.
We also accelerate the development, launch, and management of new Divercity tools with Firebase, while taking advantage of key features such as A/B testing and messaging campaigns to boost user engagement.
In the future, we plan to explore how Google Cloud AI and machine learning products such as Vertex AI and AutoML can further refine our diversity score analyses and applicant recruiting pipeline. We’ll also continue leveraging the many resources provided by the Google Black Founders Fund, including opportunities for technical project partnerships, early access to new Google Cloud products and tools, and collaboration with dedicated Google experts.
The Google for Startups Cloud Program and Google Black Founders Fund have been invaluable to our success. Since completing the Black Founders Accelerator program, we’ve been named a top 10 HR tech product by HR Tech Outlook, significantly increased our subscriber base, and received positive feedback from investors. We can’t wait to see what we accomplish next as we empower tech companies to build more diverse, inclusive, and sustainable workforces.

If you want to learn more about how Google Cloud can help your startup, visit our page here to get more information about our program, and sign up for our communications to get a look at our community activities, digital events, special offers, and more.
More Relevant Stories for Your Company

Serverless and BigQuery Together on Google Cloud: Behind the L’Oreal Beauty Tech Data Platform
Editor's note: In Today's guest post we hear from beauty leader L'Oréal about their approach to building a modern data platform on fully managed services: managing the ingest of diverse datasets into BigQuery with Cloud Run, and orchestrating transformations into relevant business domain representations for stakeholders across the organization. Learn




Explore the Innovations and Architecture Powering Spanner and BigQuery
Previously, databases had architectures with tightly coupled storage and compute. This resulted in higher latency, and with faster networks these constraints no longer surface. With Google Cloud's BigQuery and CloudSpanner, the storage and compute architecture have been separated, allowing for better scalability and availability to address businesses' high throughput data

An AI-Powered Cost Cutting Guide: 8 Strategies for Maximizing Profits
We are increasingly seeing one question arise in virtually every customer conversation: How can the organization save costs and drive new revenue streams? Everyone would love a crystal ball, but what you may not realize is that you already have one. It's in your data. By leveraging Data Cloud and

BigQuery Explainable AI for Demystifying the Inner Workings of ML Models. Now GA!
Explainable AI (XAI) helps you understand and interpret how your machine learning models make decisions. We're excited to announce that BigQuery Explainable AI is now generally available (GA). BigQuery is the data warehouse that supports explainable AI in a most comprehensive way w.r.t both XAI methodology and model types. It does this at
