





Migrating Hadoop to Dataproc by LiveRamp: Best Practices
2879
Of your peers have already read this article.
3:30 Minutes
The most insightful time you'll spend today!
Abstract
In this blog, we describe our journey to the cloud and share some lessons we learned along the way. Our hope is that you’ll find this information helpful as you go through the decision, execution, and completion of your own migration to the cloud.
Introduction
LiveRamp is a data enablement platform powered by identity, centered on privacy, integrated everywhere. Everything we do centers on making data safe and easy for businesses to use. Our Safe Haven platform powers customer intelligence, engages customers at scale, and creates breakthrough opportunities for business growth.
Businesses safely and securely bring us their data for enrichment and use the insights gained to deliver better customer experiences and generate more valuable business outcomes. Our fully interoperable and neutral infrastructure delivers end-to-end addressability for the world’s top brands, agencies, and publishers. Our platforms are designed to handle the variability and surge of the workload and guarantee service-level agreements (SLAs) to businesses.
We process petabytes of batch and streaming data daily. We ingest, process (join and enhance), and distribute this data. We receive and distribute data from thousands of partners and customers on a daily basis. We maintain the world’s largest and most accurate identity graph and work with more than 50 leading demand-side and supply-side platforms.
Our decision to migrate to Google Cloud and Dataproc
As an early adopter of Apache Hadoop, we had a single on-prem production managed Hadoop cluster that was used to store all of LiveRamp’s persistent data (HDFS) and run the Hadoop jobs that make up our data pipeline (YARN). The cluster consisted of around 2500 physical machines with a total of 30PB or raw storage, ~90,000 vcores, and ~300TB of memory. Engineering teams managed and ran multiple MapReduce jobs on these clusters.
The sheer volume of applications that LiveRamp ran on this cluster caused frequent resource contention issues, not to mention potentially widespread outages if an application was tuned improperly. Our business was scaling and we were running into constraints related to data center space and power in our on-premises environment. These constraints restricted our ability to meet our business objectives so a strategic decision was made to leverage elastic environments and migrate to the cloud. The decision required financial analysis and a detailed understanding of the available options, from do-it-yourself and vendor-managed distributions to leveraging cloud-managed services.
LiveRamp’s target architecture
We ultimately chose Google Cloud and Dataproc, a managed service for Hadoop, Spark, and other big data frameworks. During the migration we made a few fundamental changes to our Hadoop infrastructure:
Instead of 1 large persistent cluster managed by a central team, we have decentralized the cluster ownership to individual teams. This gave the teams flexibility to recreate, perform upgrades or change configurations as they see fit. This also gives us better cost attribution, less blast radius for errors, and less chance that – a rogue job from one team will impact the rest of the workloads.
Persistent data is no longer stored in HDFS on the clusters, it is in Google Cloud Storage, which, conveniently, served as a drop in replacement, as GCS is compatible with all the same APIs as HDFS. This means we can delete all the virtual machines that are part of the cluster without losing any data.
Introduced autoscaling clusters to control compute cost, and to dramatically decrease request latency. On premise you’re paying for the machines so you might as well use them. Cloud compute is elastic so you want to burst when there is demand and scale down when you can.
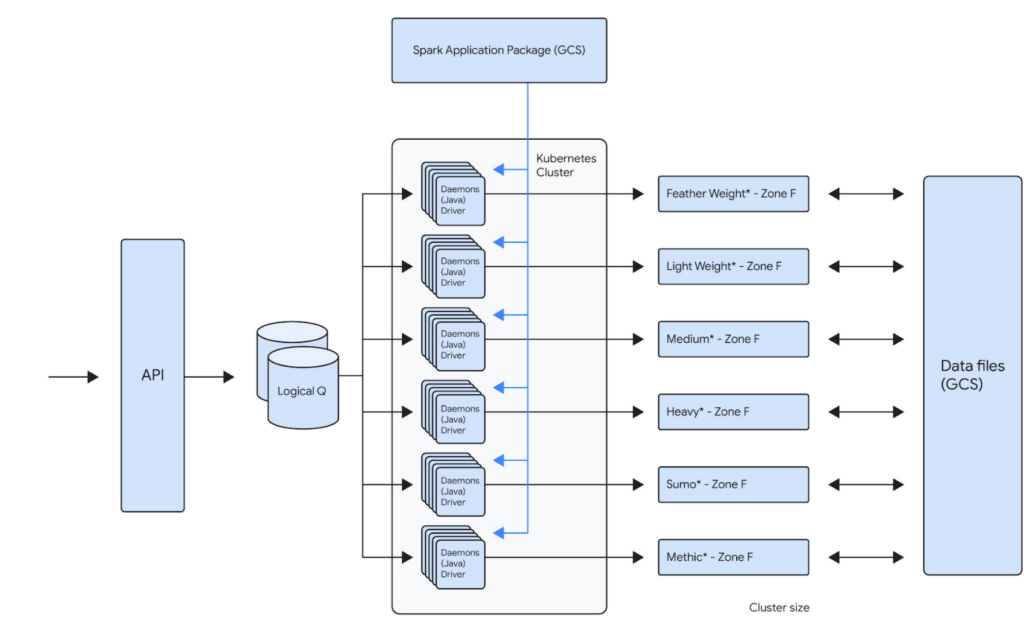
For example, one of our teams runs about 100,000 daily Spark jobs on 12 Dataproc clusters that each independently scale up to 1000 VMs. This gives that team a current peak capacity of about 256,000 cores. Because the team is bound to its own GCP Project inside of a GCP Organization, the cost attributed to that team is now very easy to report. The team uses architecture represented below to distribute the jobs across the clusters. This architecture allows them to bin similar workloads together so that they can be optimized together. Below is the logical architecture of the above workload:
Our approach
Overall migration and post migration stabilization/optimization of the largest of our workloads took us about several years to complete. We broadly broke down the migration into multiple phases.
Initial Proof-Of-Concept
When analyzing solutions for cloud-hosted big data services, any product had to meet our clear acceptance criteria:
- Cost: Dataproc is not particularly expensive compared to similar alternatives, but our discount with the existing managed Hadoop partner made it expensive. We have initially accepted that the cost would remain the same. We did see cost benefits post migration, after several rounds of optimizations.
- Features: Some key features (compared to current state) that we were looking for are built-in autoscaler, ease of creating/updating/deleting clusters, managed big data technologies etc.
- Integration with GCP: As we had already decided to move other LiveRamp-owned services to GCP, a big data platform with robust integration with GCP was a must. Basically, we’d like to be able to leverage GCP features without a lot of effort on our end (custom vms, preemptible vms, etc).
- Performance: Cluster creation, deletion, scale up, and scale down should be fast. This will allow teams to iterate and react quickly. These are some rough estimates of how fast the cluster operations should be:
- Cluster creation: <15 minutes
- Cluster Deletion: <15 minutes
- Adding 50 nodes: <20 minutes
- Removing 200 nodes: <10 minutes
- Reliability: Bug free and low downtime software that has concrete SLAs on clusters and a strong commitment to the correct functioning of all of its features.
An initial prototype to better understand Dataproc and Google Cloud helped us prove that target technologies and architecture will give us reliability and cost improvements. This also fed into our decisions around target architecture. This was then reviewed by the Google team before we embarked on the migration journey.
Overall migration
Terraform module
Our ultimate goal is to create self-service tooling that allows our data engineers to deploy infrastructure as easily and safely as possible. After defining some best practices around cluster creation and configuration, the central team’s first step was to build a terraform module that can be used by all the teams to create their own clusters. This module will create a dataproc cluster along with all supporting buckets, pods and datadog monitors:
- A dataproc cluster autoscaling policy that can be customized
- A dataproc cluster with LiveRamp defaults preconfigured
- Sidecar applications for recording job metrics from the job history server and for monitoring the cluster health
- Pre configured datadog cluster health monitors for alerting
This Terraform module is also composed of multiple supporting modules underneath. This allows users to call the supporting modules directly in your project terraform as well if such a need arises. The module can be used to create a cluster by just setting the parameters like project id, path to application source (Spark or Map/Reduce), subnet, VM instance type, auto scaling policy etc.
Workload migration
Based on our analysis of Dataproc, discussions with GCP team and the POC, we used following criteria:
- We prioritized applications that can use preemptibles to achieve cost parity to our existing workloads
- We prioritized some of our smaller workloads initially to build momentum within the organization. For example, we left the single workload that accounted for ~40% of our overall batch volume to the end, after we had gained enough experience as an organization.
- We combined the migration to Spark along with the migration to Dataproc. This has initially resulted in some extra dev work but helped reduce the effort for testing and other activities.
Our initial approach was to lift and shift from existing managed providers and Map/Reduce to Dataproc and Spark. We then later focused on optimizing the workloads for cost and reliability.
What’s working well
Cost Attribution
As is true with any business, it’s important to know where your cost centers are. Moving from a single cluster, made opaque by the number of teams loading work onto it, to GCP’s Organization/Project structure has made cost reporting very simple. The tool breaks down cost by project, but also allows us to attribute cost to a single cluster via tagging. As we sometimes deploy a single application to a cluster, this helps us to make strategic decisions on cost optimizations at an application level very easily.
Flexibility
The programmatic nature of deploying Hadoop clusters in a cloud like GCP dramatically reduces the time and effort involved in making infrastructure changes. LiveRamp’s use of a self-service Terraform module means that a data engineering team can very quickly iterate on cluster configurations. This allows a team to create a cluster that is best for their application while also adhering to our security and health monitoring standards. We also get all the benefits of infrastructure as code: highly complicated infrastructure state is version controlled and can be easily recreated and modified in a safe way.
Support
When our teams face issues with services that run on Dataproc, the GCP team is always quick to respond. They work very closely with LiveRamp to develop new features for our needs. They proactively provide LiveRamp with preview access to new features that help LiveRamp to stay ahead of the curve in the Data Industry.
Cost Savings
We have achieved around 30% cost savings in certain clusters by achieving the right balance between on-demand and PVMs. The cost savings were a result of our engineers building efficient A/B testing frameworks that helped us run the clusters/jobs in several configurations to arrive at the most reliable, maintainable and cost efficient configuration. Also, one of the applications is now 10x + faster.
Five lessons learned
Migration was a successful exercise that took about six months to complete, across all our teams and applications. While many aspects went really well, we also learned a few things along the way that we hope will help you when planning your own migration journey.
- Benchmark, benchmark, benchmark
It’s always a good idea to benchmark the current platform against the future platform to compare costs and performance. On-premises environments have a fixed capacity, while cloud platforms can scale to meet workload needs. Therefore, it’s essential to ensure that the current behavior of the key workload is clearly understood before the migration.
- Focus on one thing at a time
We initially focused on reliability while remaining cost-neutral during the migration process, and then focused on cost optimization post-migration. Google teams were very helpful and instrumental in identifying cost optimization opportunities.
- Be aware of alpha and beta products
Although there usually aren’t any guarantees of a final feature set when it comes to pre-released products, you can still get a sense of their stability and create a partnership if you have a specific use case. In our specific use case, Enhanced Flexibility Mode was in alpha stage in April 2019, beta in August 2020, and released in July 2021. Therefore, it was helpful to check in on the product offering and understand its level of stability so we could carry out risk analysis and decide when we felt comfortable adopting it.
- Think about quotas
Our Dataproc clusters could support much higher node counts than was possible with our previous vendor. This meant we often had to increase IP space and change quotas, especially as we tried out new VM and disk configurations.
- Preemptable and committed use discounts (CUDs)
CUDs make compute less expensive while preemptables make compute significantly less expensive. However, preemptibles don’t count against your CUD purchases, so make sure you understand the impact on your CUD utilization when you start to migrate to preemptables.
We hope these lessons will help you in your Data Cloud journey.
Blue Apron: Offering a better recipe for modern analytics

1646
Of your peers have already read this article.
5:30 Minutes
The most insightful time you'll spend today!
When Blue Apron had issues running its data warehouse on another cloud provider, it built an analytics platform using Looker and Google BigQuery to enable faster business decisions about food inventory.
Blue Apron’s mission is to make incredible home cooking accessible to everyone. Launched in 2012, Blue Apron is reimagining the way that food is produced, distributed, and consumed.

Google Cloud Results
- Enables near real-time business decisions to better manage food inventory and delivery by reducing query times exponentially
- Helps improve customer service and optimize business processes with faster insights
- Reduces costs while reclaiming up to a week per month of engineering
The popularity of meal kit delivery services has surged in recent years as consumer attitudes toward home cooking and grocery shopping have shifted. As a pioneer in the category, Blue Apron helps its customers create incredible home cooking experiences by sending culinary-driven recipes with high-quality ingredients and step-by-step instructions straight to customers’ doors. Blue Apron also offers a monthly wine subscription service and a la carte culinary tools and products through its marketplace.
If that sounds simple, it isn’t. Ingredients for the meal kits must be sourced at the right time, quality, and price. Orders must be packed efficiently and in exactly the right proportions. Most importantly, meal kits must be delivered to the customer fresh and on time.
To meet these criteria and make data meaningful and intuitive to its managers, one of the tools Blue Apron relies on is Looker, an analytics platform that lets business users explore data and ask sophisticated questions using familiar terms.
A Google Cloud partner and winner of the 2016 Google Cloud Global Partner Award for Solution Innovation, Looker integrates its solution with Google Cloud Platform to help customers modernize their analytics.
Blue Apron previously used Looker with a single database instance hosted on another cloud provider. As data volumes grew and queries became more complex, it became difficult to scale. Blue Apron’s only options were choosing ever-larger server classes and increasing storage throughput by purchasing a higher number of provisioned IOPS. To improve speed, scalability, and cost efficiency, Blue Apron moved its data warehouse to Google BigQuery.
“The combination of Looker and Google BigQuery is powerful, allowing us to get data-hungry analysts essential information much faster,” says Sam Chase, Tech Lead, Data Operations at Blue Apron. “Because we choose to pay by the query, it’s also flexible and cost effective—plus storage is cheap, so we can just put data in and query what we need.”
The analytics platform of the future
When you’re making business decisions about a customer’s dinner, speed matters. Looker takes full advantage of the power of Google BigQuery, making it easy to build a data exploration platform. Blue Apron’s applications publish event data to Kafka—approximately 140 million events per day—and data is then streamed into Google BigQuery, which performs lightning-fast queries on both streamed and static data. Now, business users and analytics teams can make decisions based on near real-time information in Looker, instead of waiting until the next business day for results.
“After we moved to Google BigQuery, query time was reduced exponentially. It’s an astonishing difference, allowing us to run 300 queries per day,” says Sam.
Previously, Blue Apron spent up to a week out of every month optimizing its data warehouse to attempt to improve query performance. With Google BigQuery, all maintenance is handled by Google, reclaiming 25% of up to two engineers’ time. Even when multiple people are using Looker concurrently, query performance never degrades and storage never runs out.
“Because Google BigQuery is architected as a giant, shared cluster, growth is smooth,” says Lloyd Tabb, Founder and CTO of Looker. “Like a race car going from 0 to 120 mph, there are no shift points, just smooth acceleration. To us, it looks like the future.”
An empowering, integrated toolset
Looker takes advantage of aggressive caching and support for date-based table partitioning in Google BigQuery to increase performance, simplify the load process, and improve data manageability. By partitioning data by time, Blue Apron can also take advantage of better long-term storage pricing without sacrificing query performance. When using Google BigQuery with Looker, analysts can easily see how much data is going to be scanned before each query is run.
Blue Apron is also using Looker for Google BigQuery Data Transfer Service to provide actionable analytics for all of the company’s Google marketing data from Google AdWords and DoubleClick by Google in one place to understand campaign performance across channels, saving its data operations team months of work. Using Looker Blocks, marketers can quickly make sense of the data with reports and dashboards, and set alerts when campaign performance hits certain thresholds.
Looker Blocks for Google AdWords and DoubleClick by Google provide all the analysis you’d get straight from the Google console, plus additional value-add analysis that’s impossible to replicate without SQL. Complex metrics such as ROI on ad spend, flexible multi-touch attribution, and predictive lifetime value empower marketers with a better understanding of their customers and where to spend their next dollar.
In addition to these turnkey dashboards and pieces of analysis, marketers can customize views to meet their unique needs and workflows. These capabilities help the Blue Apron marketing team make decisions regarding the allocation of spend to maximize customer acquisition and retention.
“Everyone at Blue Apron is excited about using Google BigQuery with Looker,” says Sam. “Business users and marketers are more empowered to look for answers, instead of waiting for analytics teams. Because users know they can get results rapidly, our business processes are evolving and improving.”
For data cleansing and transformation, Blue Apron uses Google Cloud Dataproc to run fully managed Apache Spark clusters on Google Cloud Platform. It’s also leveraging Google BigQuery integration with Google Workspace to bring data into Google Sheets for further distribution and analysis.
“Transferring data between Google tools is fast because it all happens on the Google network,” says Sam. “We can pull data from Google BigQuery, run transformations with Spark, and then write it back to Google BigQuery. That’s very helpful in providing our business users and data analysts with the richest, most current data.”
A perfect match for better insights
As Blue Apron seeks to expand its reach and deepen its engagement with customers, it is making Google BigQuery and Looker available to more users, providing a high-quality interactive analytics experience. “Our ability to pull a lot of data in and compute fast results affects everyone in our company,” says Sam. “Using Google BigQuery and Looker to iterate quickly and build new models to make our operations more efficient will directly impact our customers.”
For Looker, Google BigQuery represents the next step in data warehouse evolution. “Google BigQuery is a perfect match for Looker, combining easy setup with near infinite scale-out and elasticity,” says Lloyd. “People can make smarter decisions faster that directly benefit their business and customers.”
Empower Your Firm’s Data Decisions with Dataplex Data Lineage

1508
Of your peers have already read this article.
2:30 Minutes
The most insightful time you'll spend today!
Today, we are excited to announce the general availability of Dataplex data lineage — a fully managed Dataplex capability that helps you understand how data is sourced and transformed within the organization. Dataplex data lineage automatically tracks data movement across BigQuery, BigLake, Cloud Data Fusion (Preview), and Cloud Composer (Preview), eliminating operational hassles around manual curation of lineage metadata.
With rising data volume spread across data silos, it can be challenging for organizations to ensure users have a self-service mechanism to discover, understand and trust the data. Organizations constantly struggle with questions such as:
- Is the data extracted from an authoritative source?
- What is the impact if I drop this table?
- The data in this table seems corrupted – where did this data come from, and when was it last refreshed?
- How is sensitive information being moved or copied? Is it in adherence to data governance practices?
To answer the above questions, organizations need to track how data is sourced and transformed, which can be complex and requires significant effort.
Dataplex data lineage describes each lineage relationship by detailing what happened and when it happened in an interactable lineage graph, providing data observability.
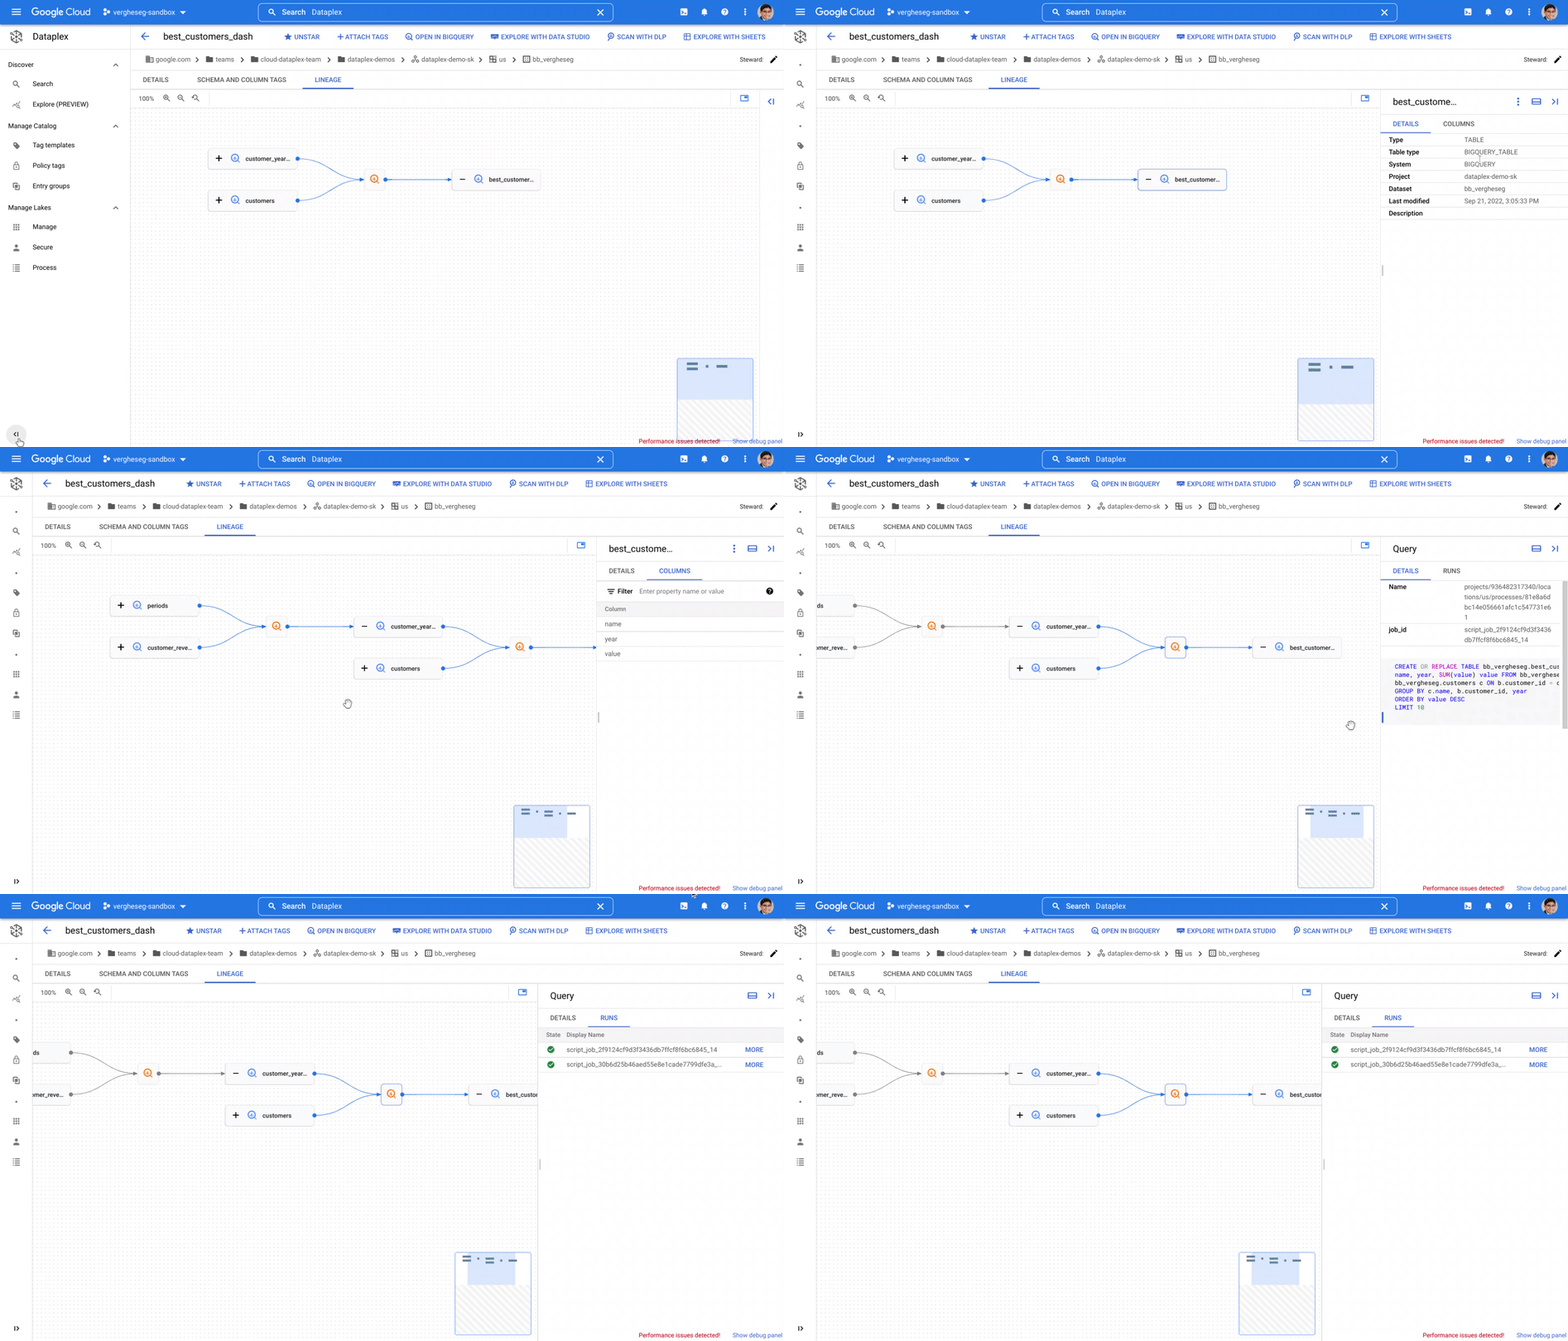
Data analysts who want to know if a table originates from an authoritative source can now answer this in a self-service manner with a simple look-up of lineage for the concerned table — available in Dataplex and in BigQuery for in-context analysis.
Data engineers can reduce time to identify and resolve data issues through root cause analysis using the operational metadata trace asserting a lineage relationship. Data lineage also aids deterministic change management by providing the ability to evaluate the impact of a change and collaborate with the corresponding stakeholders to minimize any adverse impact.
Finally, data lineage provides a map of data movement which can become the foundation for data governance practice. It enables data stewards and owners to evaluate and enforce adherence to governance requirements, especially when tracking the movement of sensitive information.
Dataplex data lineage provides APIs for extensibility so that organizations can report lineage from various systems and have a single map of how data entries are related.
What our customers are saying
L’Oréal, the world’s largest cosmetics company, is on a mission to ‘create the beauty that moves the world.’ “Dataplex data lineage helps us understand how data moves across our organization,” said Sébastien Morand, Head of Data Engineering team, L’Oréal. “As a fully managed solution, it becomes the main entry point to diagnose data issues and evaluate the impact of a change or incident — providing insight on what happened and when it happened, including reference to the execution metadata. Directly integrated into our beauty tech data platform, data lineage helps us reduce data issues and also enables us to mitigate issues faster when it does happen.”
“At Wayfair, we treat data-as-a-product and are building a robust data platform that provides self-service access and compliance constructs,” said Vinit Rajopadhye, Associate Director on Data Infrastructure & Data Enablement at Wayfair. “We are excited about Dataplex data lineage as it helps our data consumers trust data based on where it originates and the transformations applied.”
Hurb is an online travel agency in Brazil with a mission to optimize travel through technology. “Hurb has a rapidly growing data platform, with new data assets created and registered daily to support business decision-making and Machine Learning models,” said Vinícius dos Santos Mello, Senior Data Engineer. “Thanks to Dataplex data lineage features, we have end-to-end data observability across data in BigQuery. We can proactively address schema changes, data quality issues, and asset depreciation that could otherwise negatively affect the business.”
“As a company with many business domains and services, we handle a large volume of data and use it to power our decision making, so it is crucial to ensure data quality. Dataplex data lineage provides a visual understanding of the flow of data across our organization, improving efficiency of impact investigations when problems occur and increasing the reliability of the data.” said Mitsunori Fukase, Data Platform Department Group Manager, DeNA.
Get started with Dataplex data lineage
You can get started with Dataplex data lineage by enabling the Data Lineage API on your project. You can learn more here.
Additional Resources:
Google Cloud Next 21 for Data Analytics Unplugged

4944
Of your peers have already read this article.
4:30 Minutes
The most insightful time you'll spend today!
October 23rd (this past Saturday!) was my 4th Googlevarsery and we are wrapping an incredible Google Next 2021!
When I started in 2017, we had a dream of making BigQuery Intelligent Data Warehouse that would power every organization’s data driven digital transformation.
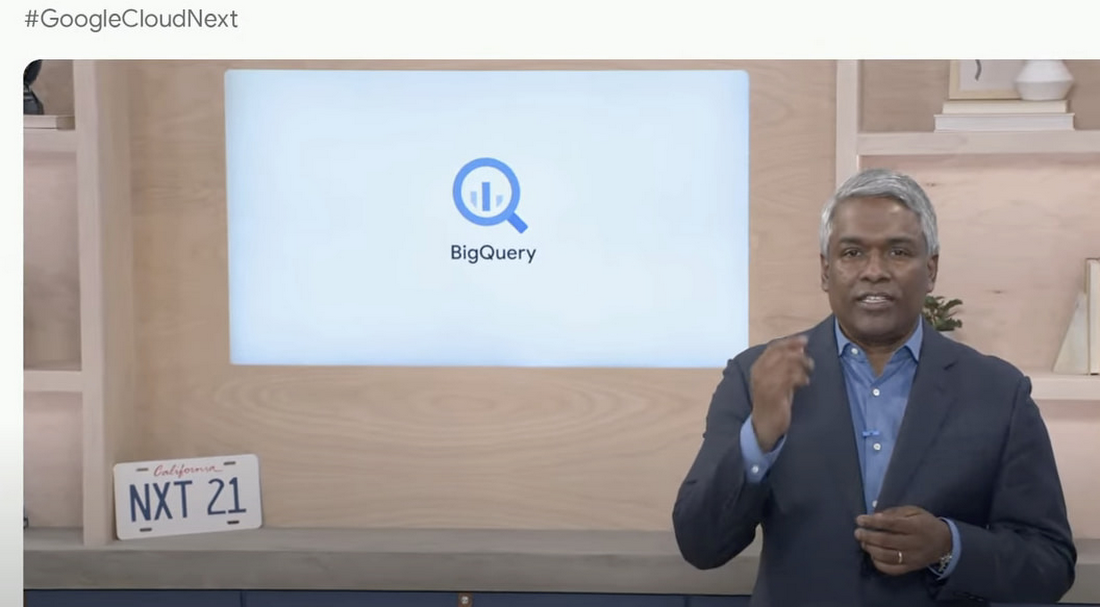
This year at Next, It was amazing to see Google Cloud’s CEO, Thomas Kurian, kick off his keynote with CTO of WalMart, Suresh Kumar , talking about how his organization is giving its data the “BigQuery treatment”.
AS I recap Next 2021 and reflect on our amazing journey over the past 4 years, I’m so proud of the opportunity I’ve had to work with some of the world’s most innovative companies from Twitter to Walmart to Home Depot, Snap, Paypal and many others.
So much of what we announced at Next is the result of years of hard work, persistence and commitment to delivering the best analytics experience for customers.
I believe that one of the reasons why customers choose Google for data is because we have shown a strong alignment between our strategy and theirs and because we’ve been relentlessly delivering innovation at the speed they require.
Unified Smart Analytics Platform
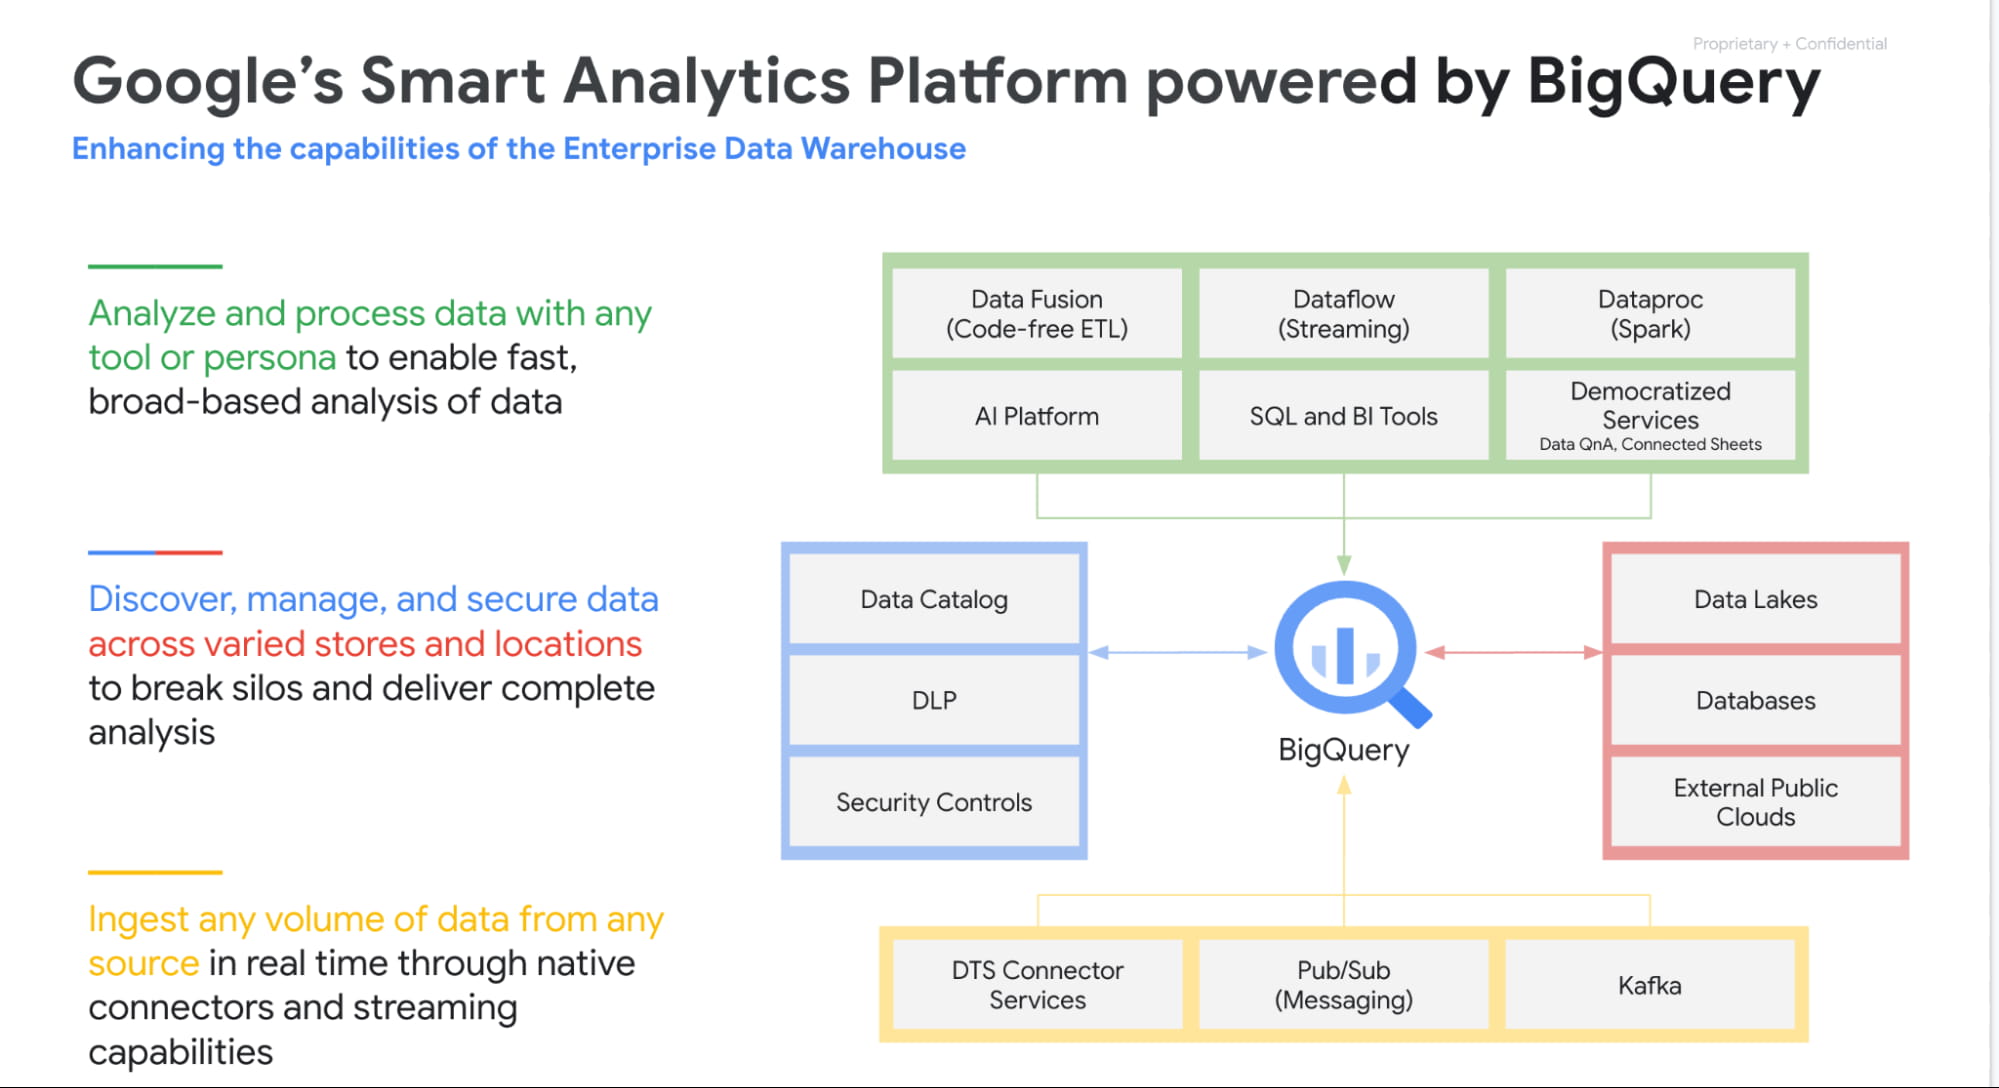
Over the past 4 years our focus has been to build industries leading unified smart analytics platforms. BigQuery is at the heart of this vision and seamlessly integrates with all our other services. Customers can use BigQuery to query data in BigQuery Storage, Google Cloud Storage, AWS S3, Azure Blobstore, various databases like BigTable, Spanner, Cloud SQL etc. They can also use any engine like Spark, Dataflow, Vertex AI with BigQuery. BigQuery automatically syncs all its metadata with Data Catalog and users can then run a Data Loss Prevention service to identify sensitive data and tag it. These tags can then be used to create access policies.
In addition to Google services, all our partner products also integrate with BigQuery seamlessly. Some of the key partners highlighted at Next 21 included Data Ingestion (Fivetran, Informatica & Confluent), Data preparation (Trifacta, DBT), Data Governance (Colibra), Data Science (Databricks, Dataiku) and BI (Tableau, PowerBI, Qlik etc).
Planet Scale analytics with BigQuery
BigQuery is an amazing platform and over the past 11 years we have continued to innovate in various aspects. Scalability has always been a huge differentiator for BigQuery. BigQuery has many customers with more than 100 petabytes of data and our largest customer is now approaching an exabyte of data. Our large customers have run queries over trillions of rows.
But scale for us is not just about storing or processing a lot of data. Scale is also how we can reach every organization in the world. This is the reason we launched BigQuery Sandbox which enables organizations to get started with BigQuery without a credit card. This has enabled us to reach tens of thousands of customers. Additionally to make it easy to get started with BigQuery we have built integrations with various Google tools like Firebase, Google Ads, Google Analytics 360, etc.
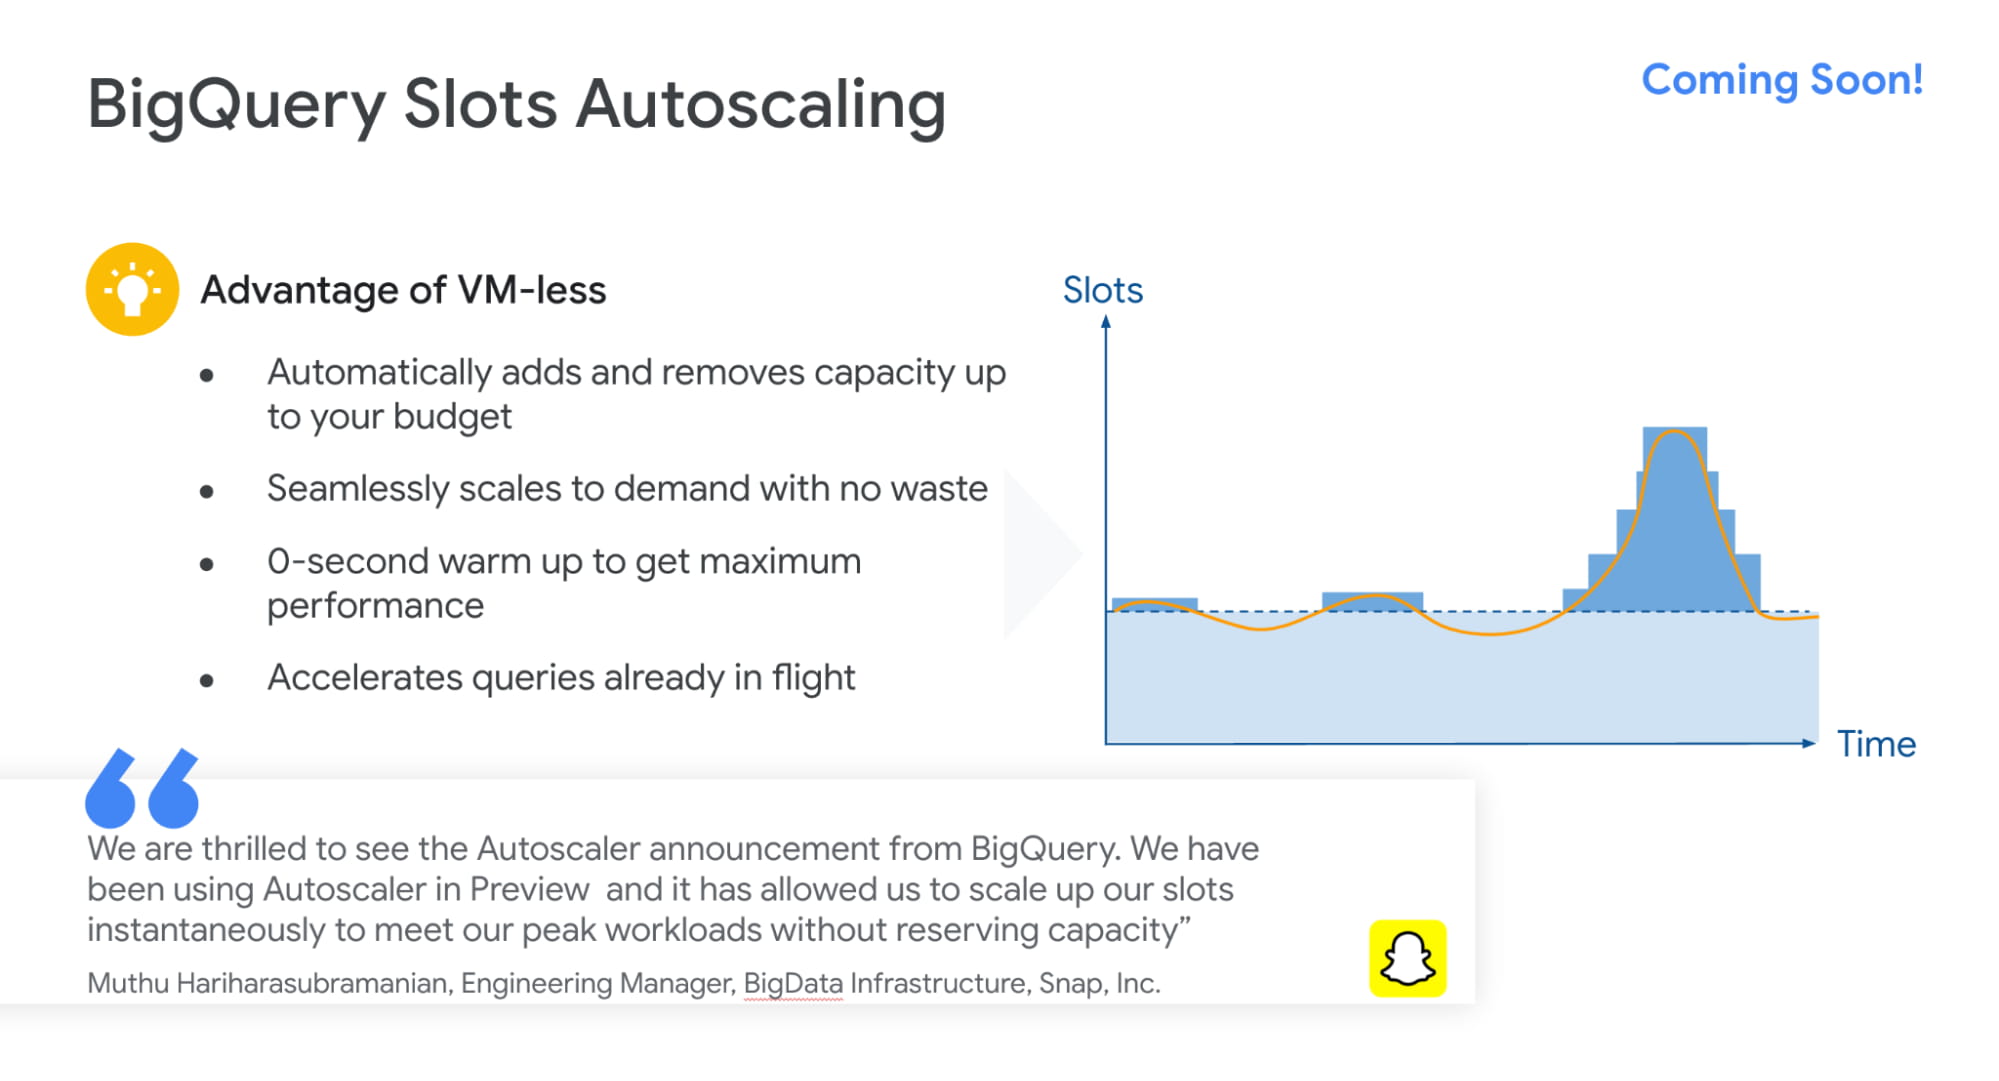
Finally, to simplify adoption we now provide options for customers to choose whether they would like to pay per query, buy flat rate subscriptions or buy per second capacity. With our autoscaling capabilities we can provide customers best value by mixing flat rate subscription discounts with auto scaling with flex slots.
Intelligent Data Warehouse to empower every data analyst to become a data scientist
BigQuery ML is one of the biggest innovations that we have brought to market over the past few years. Our vision is to make every data analyst a data scientist by democratizing Machine learning. 80% of time is spent in moving, prepping and transforming data for the ML platform. This also causes a huge data governance problem as now every data scientist has a copy of your most valuable data. Our approach was very simple. We asked:”what if we could bring ML to data rather than taking data to an ML engine?”
That is how BigQuery ML was born. Simply write 2 lines of SQL code and create ML models.
Over the past 4 years we have launched many models like regression, matrix factorization, anomaly detection, time series, XGboost, DNN etc. These models are used by customers to solve complex business problems simply from segmentation, recommendations, time series forecasting, package delivery estimation etc. The service is very popular: 80%+ of our top customers are using BigQueryML today. When you consider that the average adoption rate of ML/AI is in the low 30%, 80% is a pretty good result!

We announced tighter integration of BQML with Vertex AI. Model explainability will provide the ability to explain the results of predictive ML classification and regression models by understanding how each feature contributes to the predicted result. Also users will be able to manage, compare and deploy BigQuery ML models in Vertex; leverage Vertex Pipelines to train and predict BigQuery ML models.
Real-time streaming analytics with BigQuery
Customer expectations are changing and everyone wants everything in an instant: according to Gartner, by the end of 2024, 75% of enterprises will shift from piloting to operationalizing AI, driving a 5X increase in streaming data and analytics infrastructures.
The BigQuery’s storage engine is optimized for real-time streaming. BigQuery supports streaming ingestion of 10s of millions of events in real-time and there is no impact on query performance. Additionally customers can use materialized views and BI Engine (which is now GA) on top of streaming data. We guarantee always fast, always fresh data. Our system automatically updates MVs and BI Engine.
Many customers also use our PubSub service to collect real-time events and process these through Dataflow prior to ingesting into BigQuery. This is a streaming ETL pattern which is very popular. Last year,we announced PubSub Lite to provide customers with a 90% lower price point and aTCO that is lower than any DIY Kafka deployment.
We also announced Dataflow Prime, it is our next generation platform for Dataflow. Big Data processing platforms have only focused on horizontal scaling to optimize workloads. But we have seen new patterns and use cases like streaming AI where you may have a few steps in pipelines that perform data prep and then customers have to run a GPU based model. Customers want to use different sizes and shapes of machines to run these pipelines in the most optimum manner. This is exactly what Dataflow Prime does. It delivers vertical auto scaling with the right fitting for your pipelines. We believe this should lower costs for pipelines significantly.
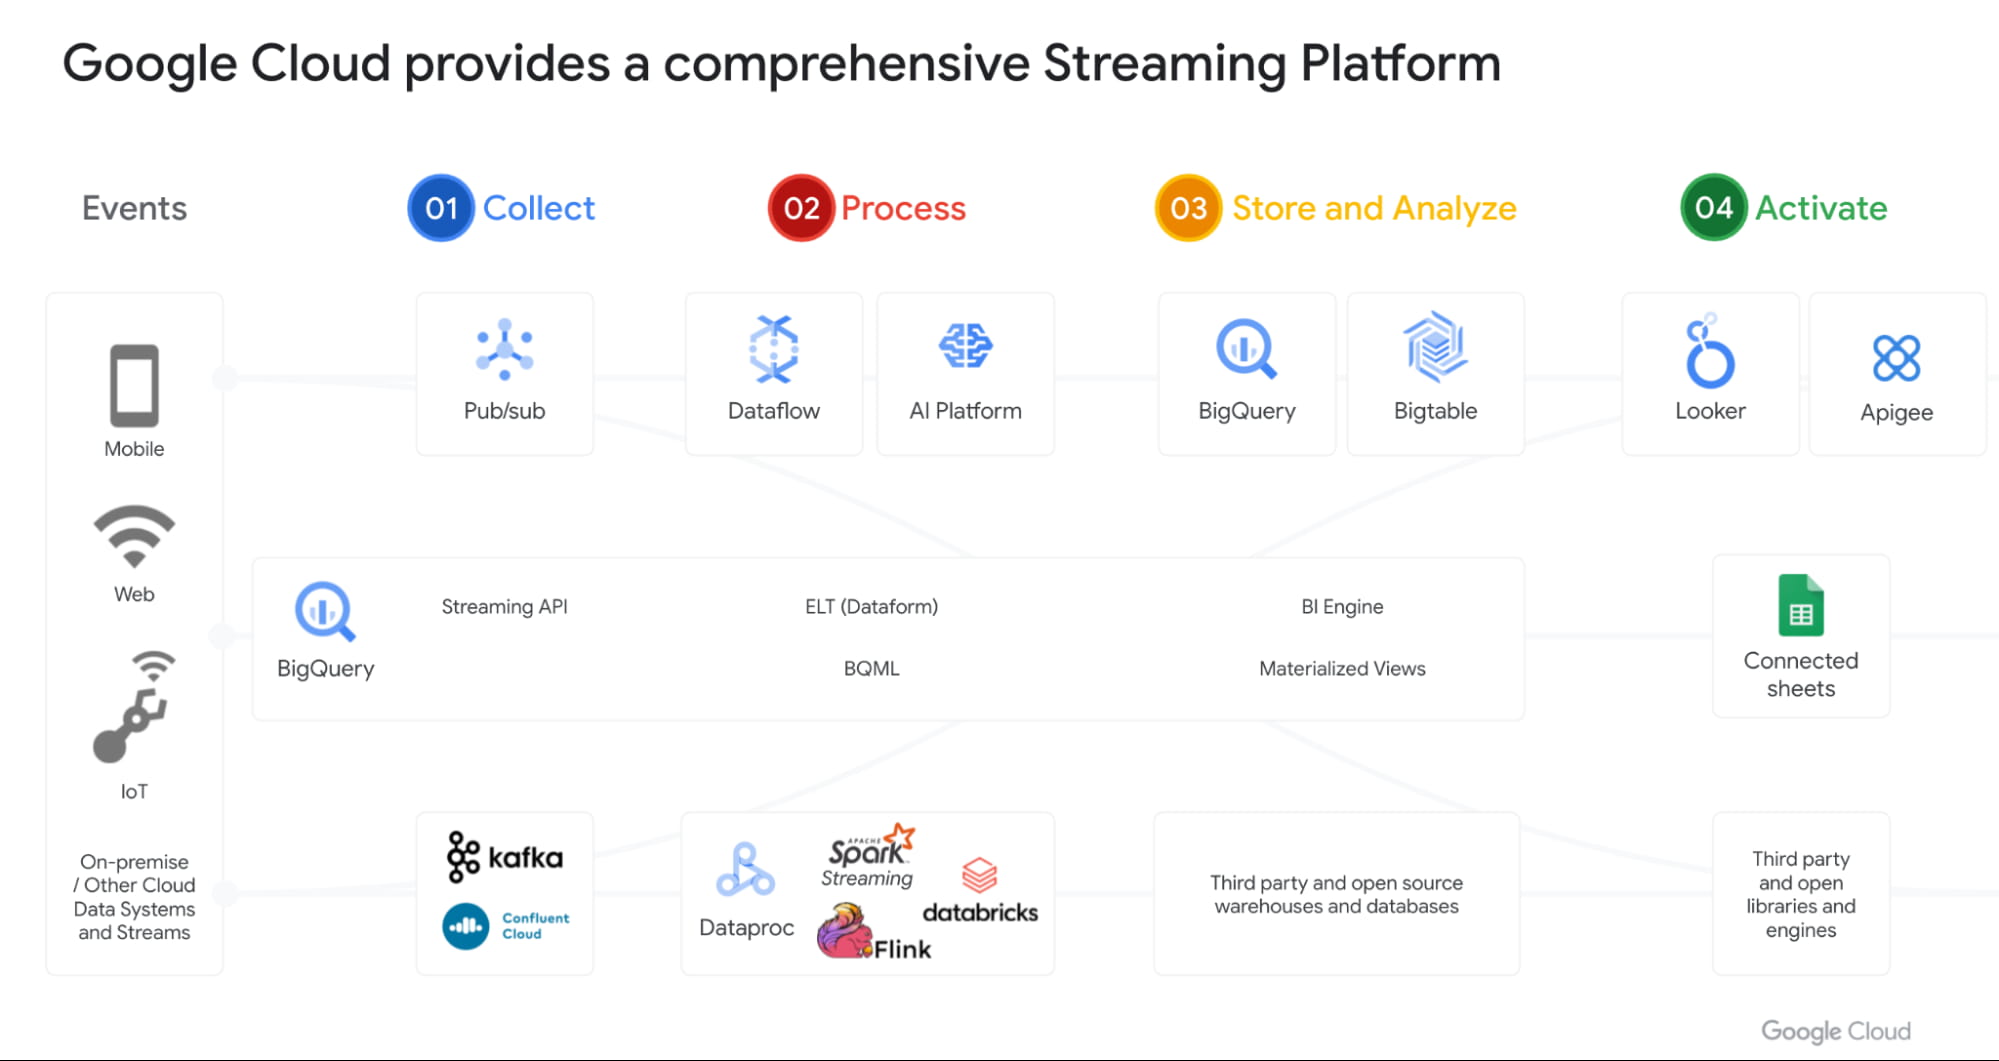
With Datastream as our change data capture service (built on Alooma technology), we have solved the last key problem space for customers. We can automatically detect changes in your operational databases like MySQL, Postgres, Oracle etc and sync them in BigQuery.
Most importantly, all these products work seamlessly with each other through a set of templates. Our goal is to make this even more seamless over next year.
Open Data Analytics with BigQuery
Google has always been a big believer in Open Source initiatives. Our customers love using various open source offerings like Spark, Flink, Presto, Airflow etc. With Dataproc & Composer our customers have been able to run various of these open source frameworks on GCP and leverage our scale, speed and security. Dataproc is a great service and delivers massive savings to customers moving from on-prem Hadoop environments. But customers want to focus on jobs and not clusters.
That’s why we launched Dataproc Serverless Spark (GA) offering at Next 2021. This new service adheres to one of our key design principles we started with: make data simple.
Just like with BigQuery, you can simply RUN QUERY. With Spark on Google Cloud, you simply RUN JOB. ZDNet did a great piece on this. I invite you to check it out!
Many of our customers are moving to Kubernetes and wanted to use that as the platform for Spark. Our upcoming Spark on GKE offering will give the ability to deploy spark workloads on existing Kubernetes clusters.
But for me the most exciting capability we have is, the ability to run Spark directly on BigQuery Storage. BigQuery storage is highly optimized analytical storage. By running Spark directly on it, we again bring compute to data and avoid moving data to compute.
BigSearch to power Log Analytics
We are bringing the power of Search to BigQuery. Customers already ingest massive amounts of log data into BigQuery and perform analytics on it. Our customers have been asking us for better support for native JSON and Search. At Next 21 we announced the upcoming availability of both these capabilities.
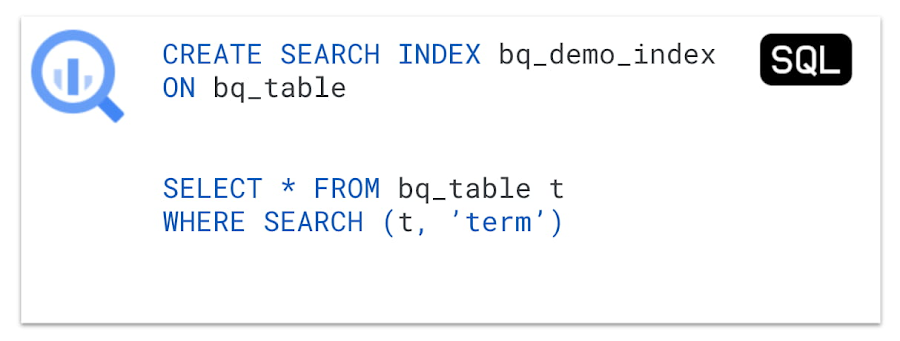
Fast cross column search will provide efficient indexing of structured, semi-structured and unstructured data. User friendly SQL functions let customers rapidly find data points without having to scan all the text in your table or even know which column the data resides in.
This will be tightly integrated with native JSON, allowing customers to get BigQuery performance and storage optimizations on JSON as well as search on unstructured or constantly changing data structures.
Multi & Cross Cloud Analytics
Research on multi cloud adoption is unequivocal — 92% of businesses in 2021 report having a multi cloud strategy. We have always believed in providing customers choice to our customers and meeting them where they are. It was clear that all our customers wanted us to take our gems like BigQuery to other clouds as their data was distributed on different clouds.
Additionally it was clear that customers wanted cross cloud analytics not multi-cloud solutions that can just run in different clouds. In short, see all their data with a single pane of glass, perform analysis on top of any data without worrying about where it is located, avoid egress costs and finally perform cross cloud analysis across datasets on different clouds.
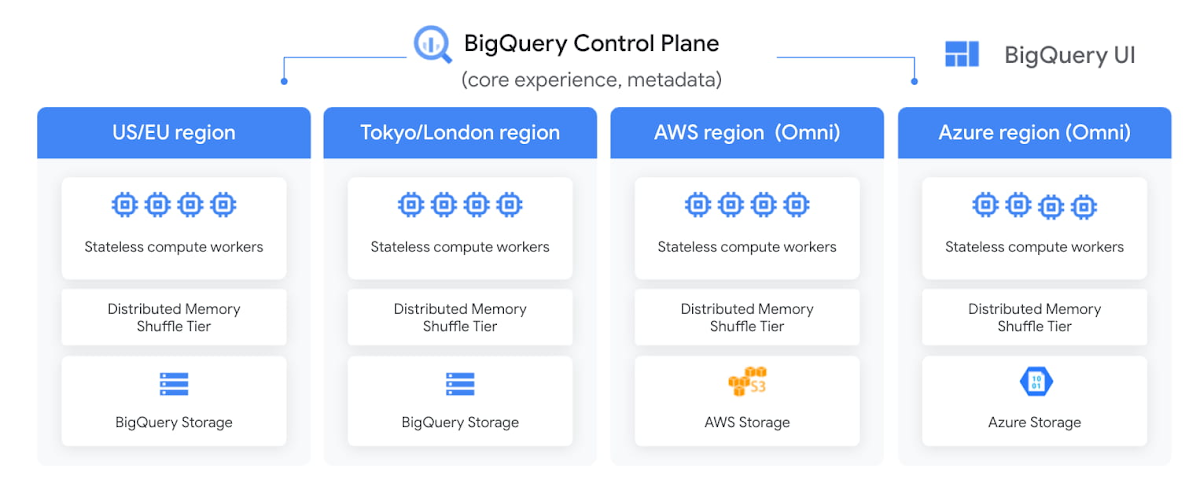
With BigQuery Omni, we deliver on this vision, with a new way of analyzing data stored in multiple public clouds. Unlike competitors, BigQuery Omni does not create silos across different clouds. BigQUery provides a single control plane that shows an analyst all data they have access to across all clouds. Analyst just writes the query and we send it to the right cloud across AWS, Azure or GCP to execute it locally. Hence no egress costs are incurred.
We announced BQ Omni GA for both AWS and Azure at Google Next 21 and I’m really proud of the team for delivering on this vision. Check out Vidya’s session and learn from Johnson and Johnson how they innovate in a multi-cloud world.
Geospatial Analytics with BigQuery and Earth Engine
We have partnered with our Google Geospatial team to deliver GIS functionality inside BigQuery over the years. At Next we announced that customers will be able to integrate Earth Engine with BigQuery, Google Cloud’s ML technologies, and Google Maps Platform.
Think about all the scenarios and use-cases your team’s going to be able to enable sustainable sourcing, saving energy or understanding business risks.
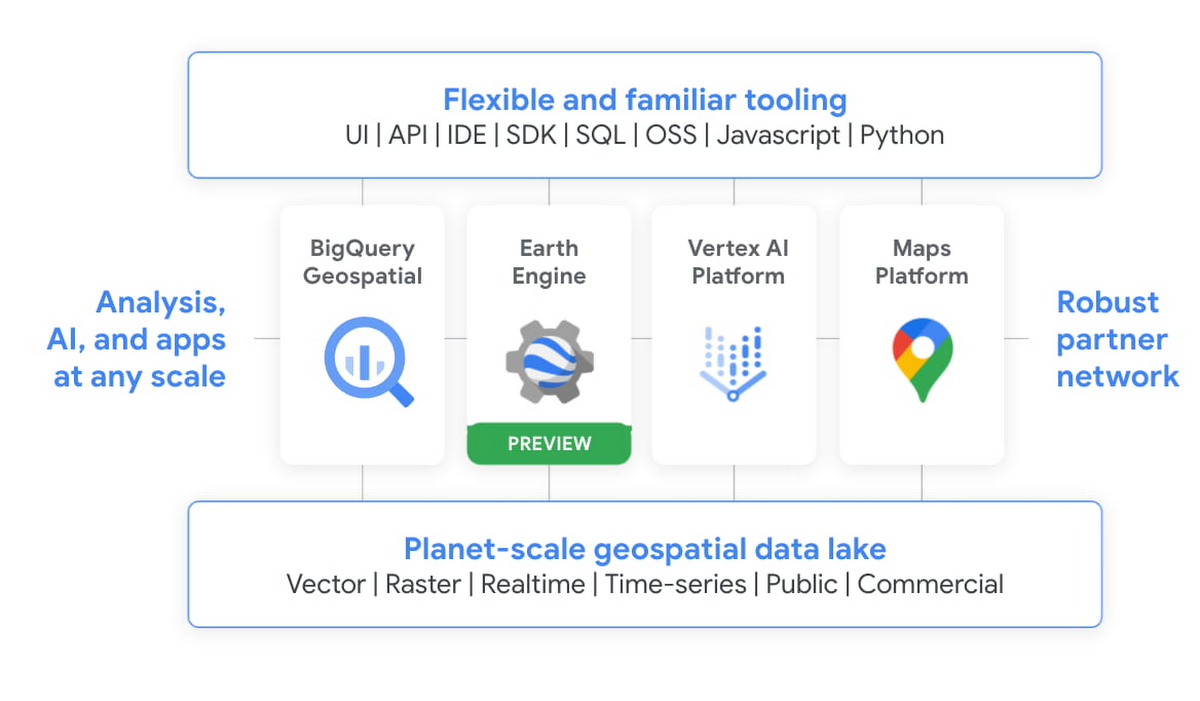
We’re integrating the best of Google and Google Cloud together to – again – make it easier to work with data to create a sustainable future for our planet.
BigQuery as a Data Exchange & Sharing Platform
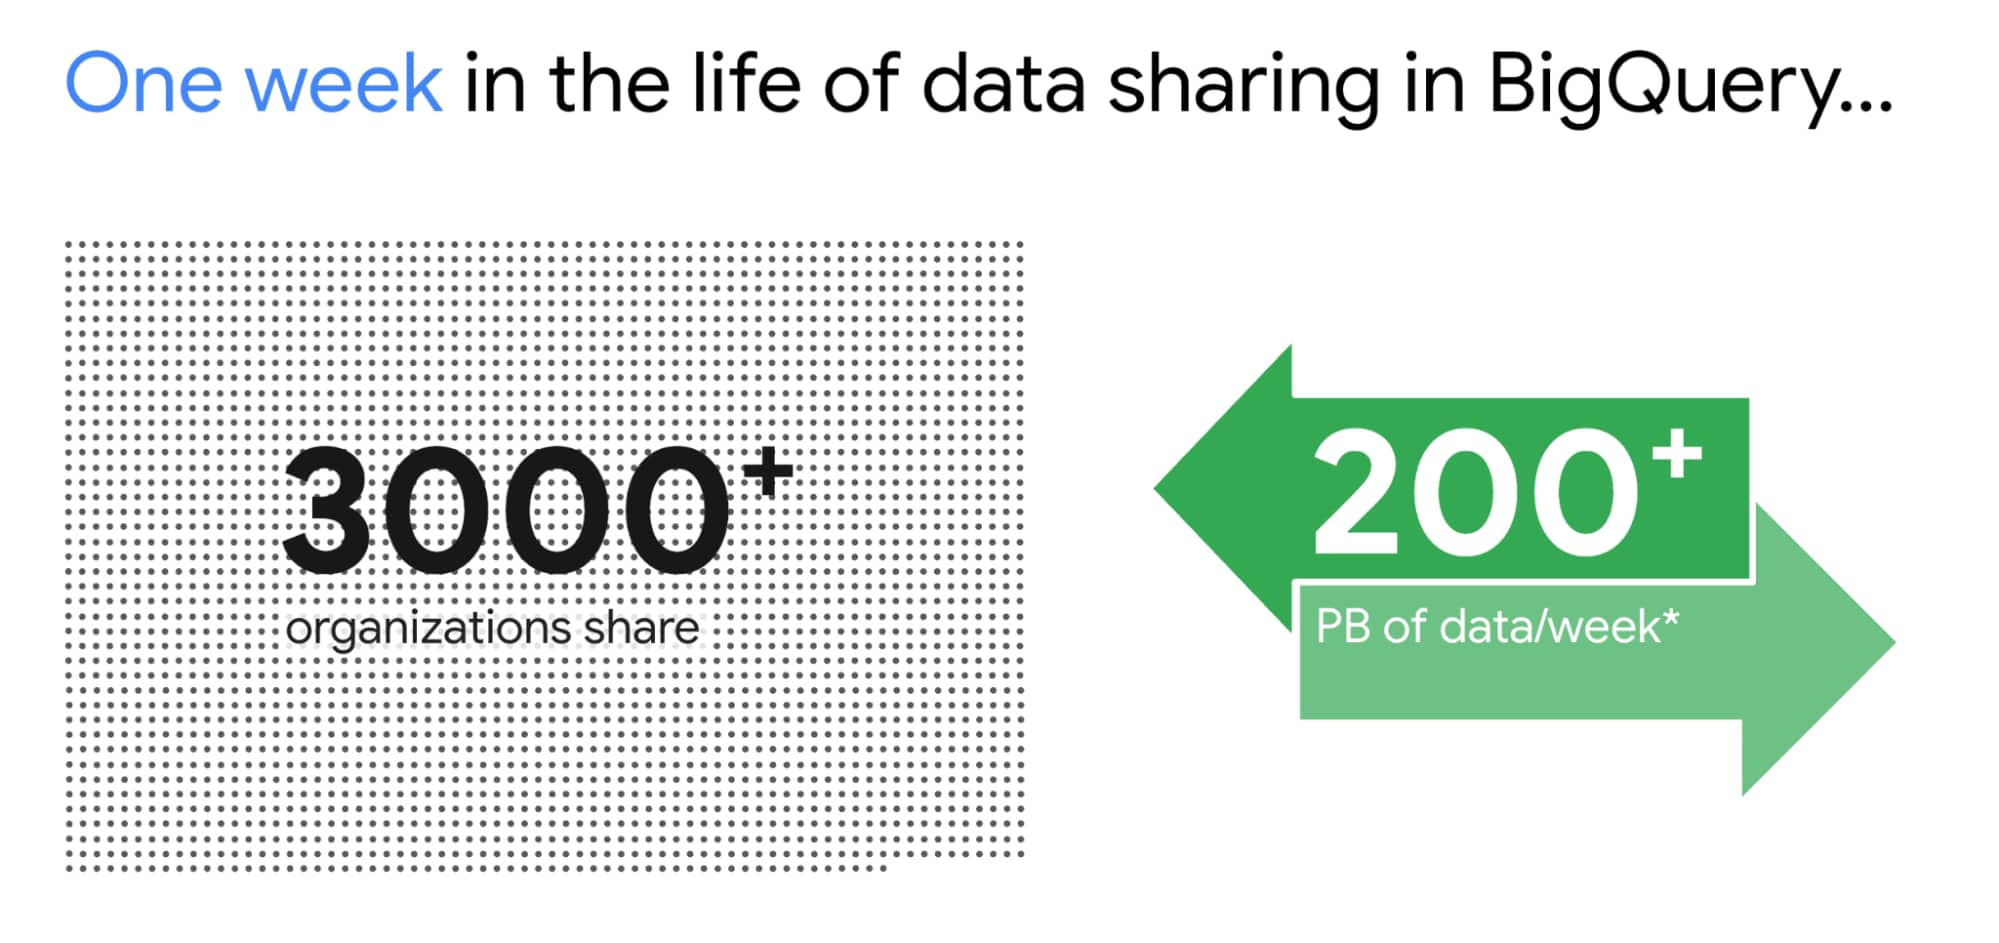
BigQuery was built to be a sharing platform. Today we have 3000+ organizations sharing more than 250 petabytes of data across organizations. Google also brings more than 150 public datasets to be used across various use cases. In addition to this, we are also bringing some of the most unique datasets like Google Trends to BigQuery. This will enable organizations to understand in real-time trends and apply to their business problems.
I am super excited about the Analytics Hub Preview announcement. Analytics Hub will provide the ability for organizations to build private and public analytics exchanges. This will include data, insights, ML Models and visualizations. This is built on top of the industry leading security capabilities of BigQuery.

Breaking Data Silos
Data is distributed across various systems in the organization and making it easy to break the data silo and make all this data accessible to all is critical. I’m also particularly excited about the Migration Factory we’re building with Informatica and the work we are doing for data movement, intelligent data wrangling with players like Trifacta and FiveTran, with whom we share over 1,000 customers (and growing!). Additionally we continue to deliver native Google service to help our customers.
We acquired Cask in 2018 and launched our self service Data Integration service in Data Fusion. Now Fusion allows customers to create complex pipelines with just simple drag and drop. This year we focused on unlocking SAP data for our customers. We have launched various SAP connectors and accelerators to achieve this.
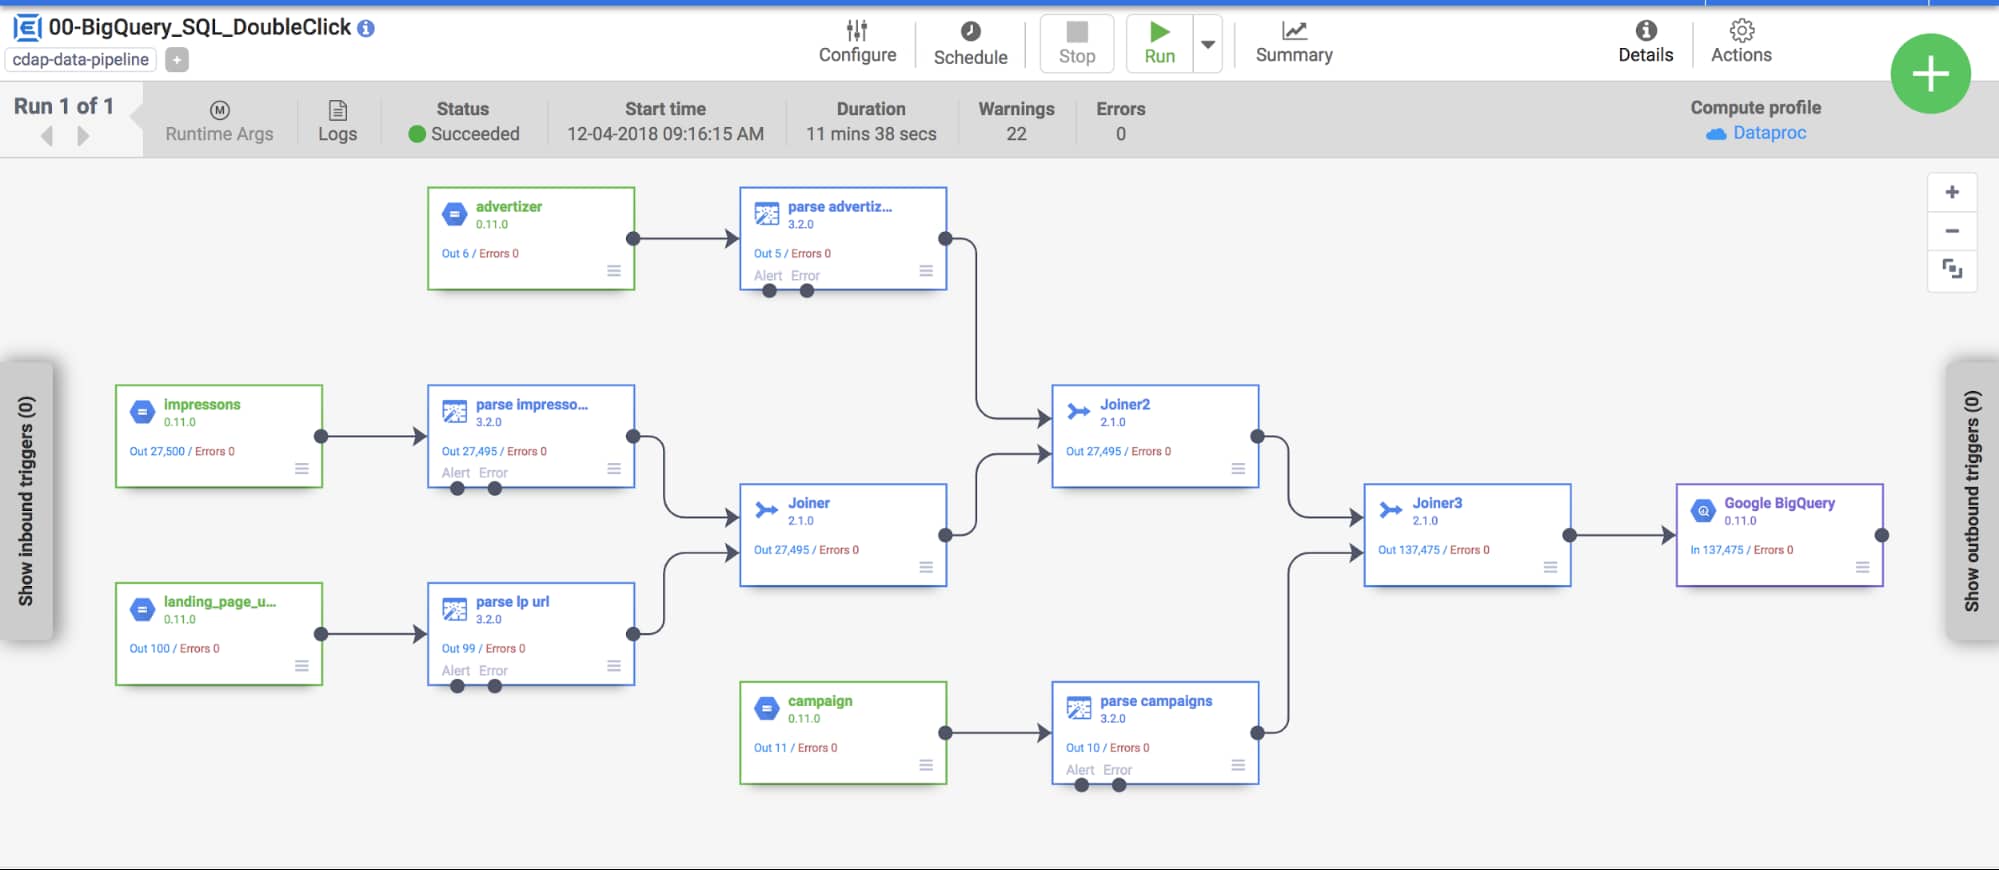
At GCP Next we also announced our BigQuery Migration service in preview. Many of our customers are migrating their legacy data warehouses and data lakes to BigQuery. BigQuery Migration Service provides end-to-end tools to simplify migrations for these customers.
And today, to make migrations to BigQuery easier for even more customers, I am super excited to announce the acquisition of CompilerWorks. CompilerWorks’ Transpiler is designed from the ground up to facilitate SQL migration in the real world and will help our customers accelerate their migrations. It supports migrations from over 10 legacy enterprises data warehouses and we will be making it available as part of our BigQuery Migration service in the coming months.
Data Democratization with BigQuery
Over the past 4 years we have focused a lot on making it very easy to derive actionable insights from data in BigQuery. Our priority has been to provide a strong ecosystem of partners that can provide you with great tools to achieve this but also deliver native Google capabilities.
With our BI engine GA announcement which we introduced in 2019, previewed earlier this year and showcased with tools like Microsoft PowerBI and Tableau, is now available for all to play with.

BigQuery + Data Studio are like peanut butter and Jelly. They just work well together. We launched BI Engine first with Data Studio and scaled it to all the users. More than 40% of our BigQuery customers use Data Studio. Once we knew BI Engine works extremely well we now have made it an integral part of BigQuery API and launched it for all our internal and partner BI tools.
We announced GA for BI Engine at Next 2021 but we were already GA with Data Studio for the past 2 years. We recently moved the Data Studio team back into Google Cloud making the partnership even stronger. If you have not used Data Studio, I encourage you to take a look and get started for free today here!!
Connected Sheets for BigQuery is one of my favorite combinations. You can give every business user in your organization the ability to analyze billions of records using standard Google Sheets experience. I personally use it everyday to analyze all our product data.
We acquired Looker in Feb 2020 with a vision of providing a semantic modeling layer to our customers with a governed BI solution. Looker is tightly integrated with BigQuery including BigQuery ML. Our latest partnership with Tableau where Tableau customers will soon be able to leverage Looker’s semantic model, enabling new levels of data governance while democratizing access to data.
Finally, I have a dream that one day we will bring Google Assistant to your enterprise data. This is the vision of Data QnA. We are in early innings on this and we will continue to work hard to make this vision a reality.
Intelligent Data Fabric to unify the platform
Another important trend that shaped our market is the Data Mesh. Earlier this year, Starburst invited me to talk about this very topic. We have been working for years on this concept, and although we would love for all data to be neatly organized in one place, we know that our customers’ reality is that it is not (If you want to know more about this, read about my debate on this topic with Fivetran’s George Fraser, a16z’s Martin Casado and Databricks’ Ali Ghodsi).
Everything I’ve learned from customers over my years in this field is that they don’t just need a data catalog or a set of data quality and governance tools, they need an intelligent data fabric. That is why we created Dataplex, whose general availability we announced at Next.
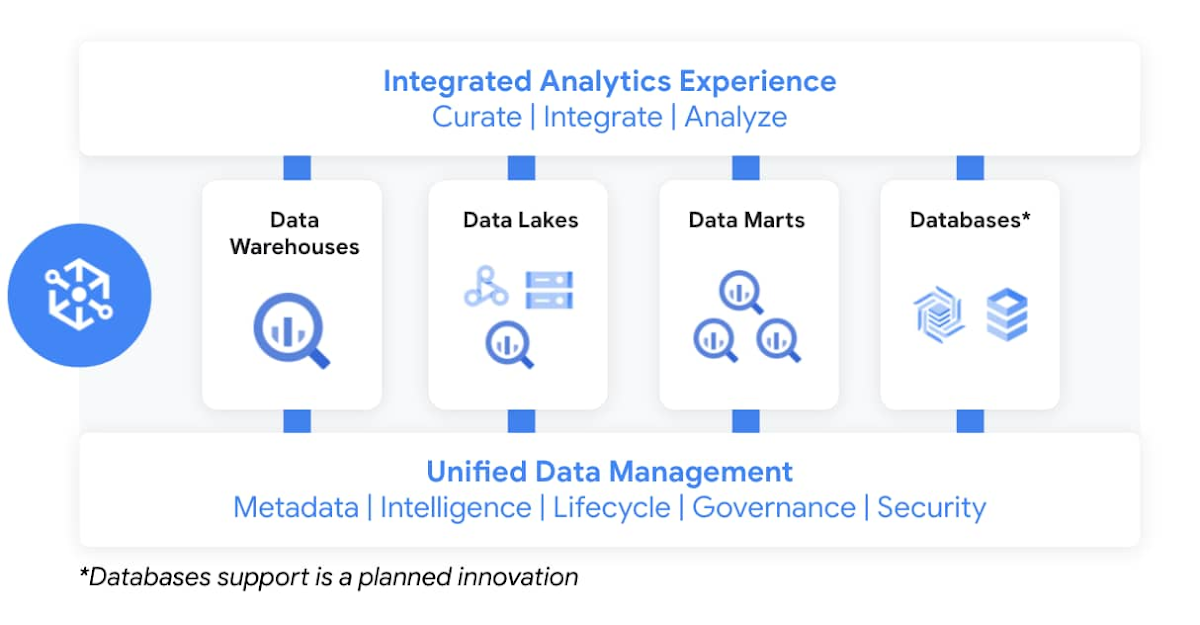
Dataplex enables customers to centrally manage, monitor, and govern data across data lakes, data warehouses, and data marts, while also ensuring data is securely accessible to a variety of analytics and data science tools. It lets customers organize and manage data in a way that makes sense for their business, without data movement or duplication. It provides logical constructs – lakes, data zones, and assets – which enable customers to abstract away the underlying storage systems to build a foundation for setting policies around data access, security, lifecycle management, and so on. Check out Prajakta Damle’s session and learn from Deutsche Bank how they are thinking about a unified data mesh across distributed data.
Closing Thoughts
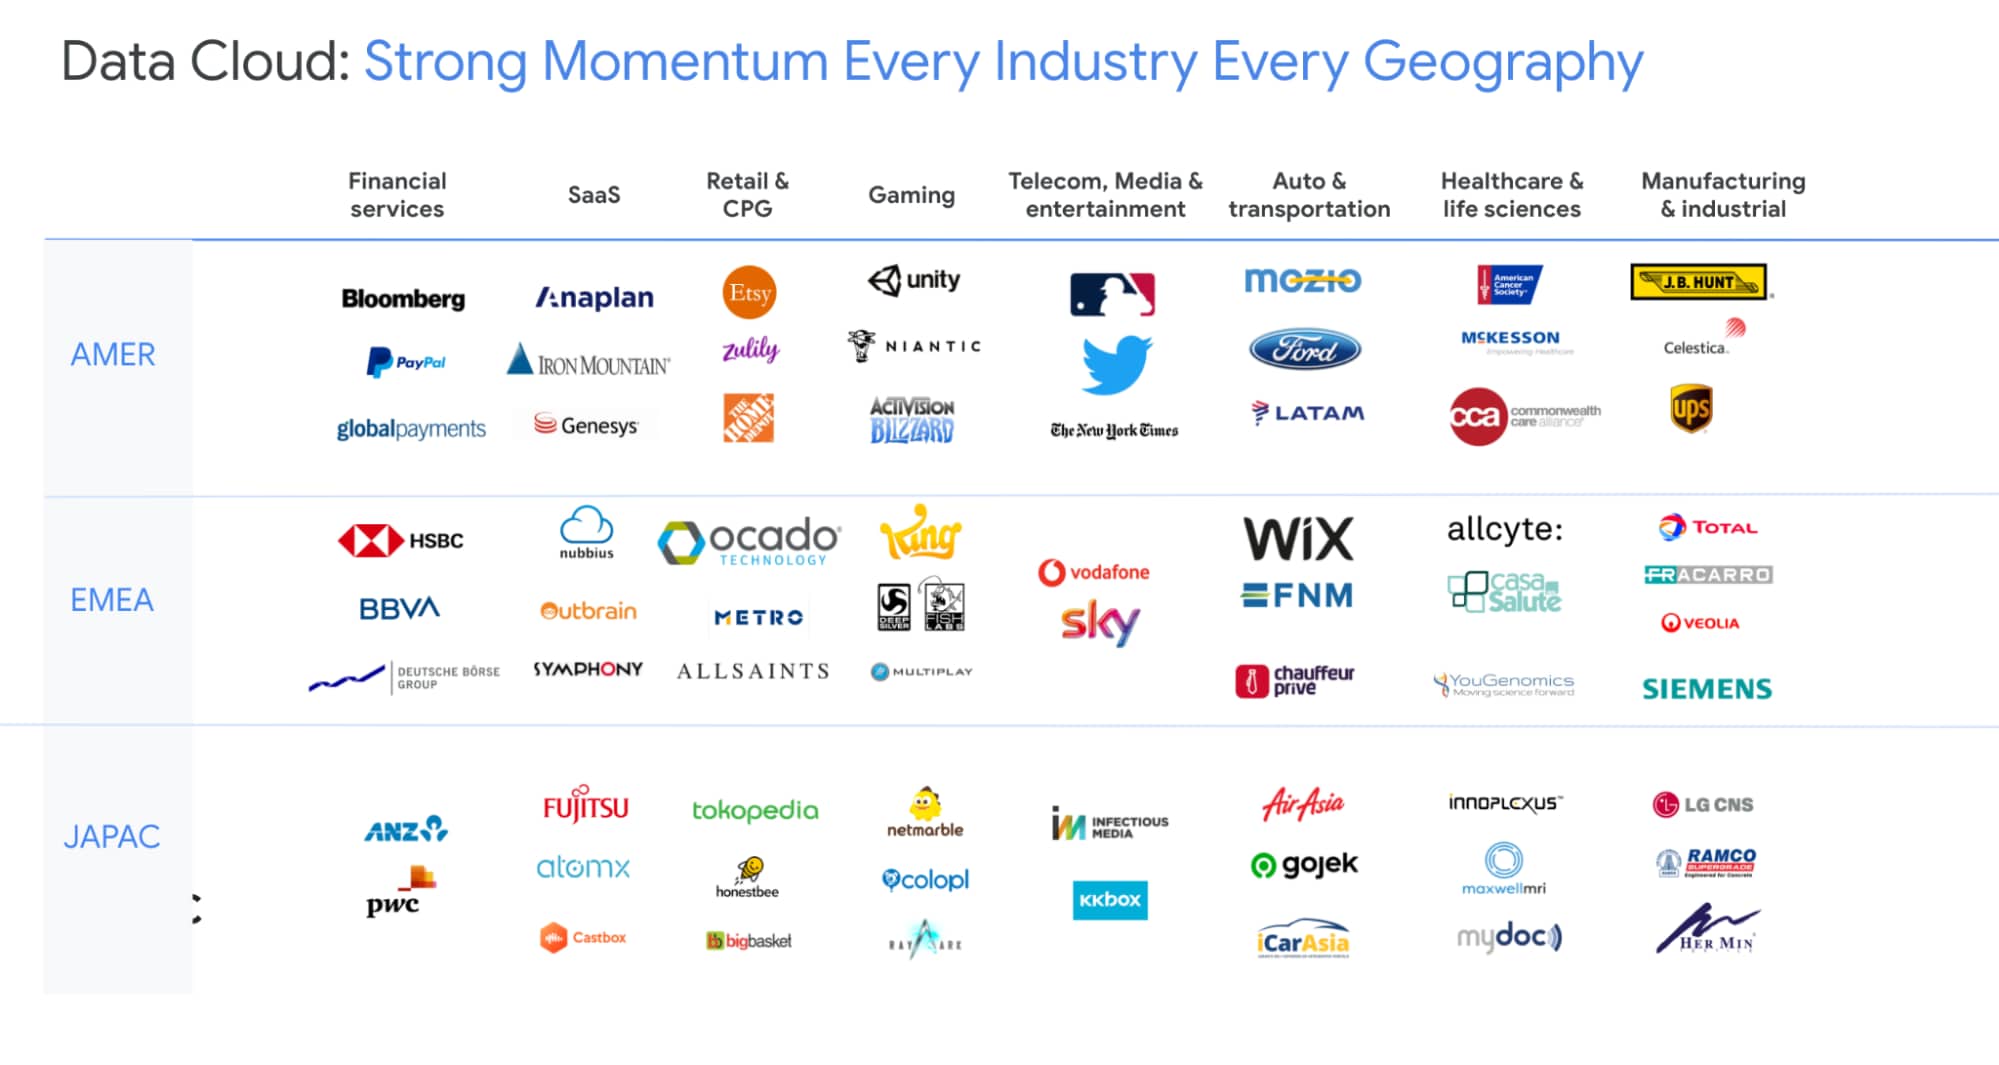
Analysts have recognized our momentum and, as I look back at this year, I couldn’t thank our customers and partners enough for the support they provided my team and I across our large Data Analytics portfolio: in March, Google BigQuery was named a Leader in The Forrester Wave™: Cloud Data Warehouse, Q1 2021. And in June, Dataflow was named a Leader in The Forrester Wave™: Streaming Analytics, Q2 2021 report.
If you want to get a taste for why customers choose us over other hyperscalers or cloud data warehousing, I suggest you watch the Data Journey series we’ve just launched, which documents the stories of organizations modernizing to the cloud with us.
The Google Cloud Data Analytics portfolio has become a leading force in the industry and I couldn’t be more excited to have been part of it. I do miss you, my customers and partners, and I’m frankly bummed that we didn’t get to meet in person like we’ve done so many times before (see a photo of my last in-person talk before the pandemic), but this Google Next was extra special, so let’s dive into the product innovation and their themes.
I hope that I will get to see you in person next time we run Google Next!
Creating and Using Storage Buckets for Your Data Needs

1388
Of your peers have already read this article.
2:30 Minutes
The most insightful time you'll spend today!
So, you want to store objects on the cloud? But you’re really new to Google Cloud or Cloud Storage and would like someone to walk you through the process step by step?
Today is your lucky day!
I will help you understand the big steps involved in setting up and using Cloud Storage. For a walkthrough of all the steps involved that even includes highlighting of things to select so you don’t spend all your time playing “Where’s Waldo” on the page looking for that one button, click try the tutorial!
Creating buckets, storing objects in them, and adjusting permissions may feel challenging at first, but after you’ve walked through these steps, you’ll be able to create and use the Cloud Storage your project needs.
Resource Hierarchy
Projects contain all of the related parts of your application. Inside projects, you may have buckets, the top level containers in Cloud Storage. Files and folders are stored in buckets. You can grant access to a bucket, folder, or file using Identity and Access Management.

You can do all of that in this interactive tutorial. So let’s get started. I suggest you follow along in the tutorial so you can see the specific keys and screens as I describe them.
Creating a project
Everything in your application will be in a project, even if the only service you are using is storage. Projects need to be associated with a billing account, so if you don’t have one, consider signing up for the Free Trial. You’ll start in the Cloud Console.
Creating a bucket
Once you have a project, you can use storage by navigating to the Cloud Storage page by using either the Navigation menu at the top left of the console or by searching for “Cloud Storage” using the search box at the top of the console.
At the Buckets page of Cloud Storage, you’ll be able to create a bucket. The name of your bucket needs to be globally unique; that is no other bucket in Google Cloud Storage can have the same name. This is because if you or your organization allow your bucket to be accessible on the Internet, it will be at the URL https://storage.googleapis.com/<bucket name>. You can also consider implementing a security feature to prevent data exfiltration, organization restriction headers when you’re finished creating your bucket.. Pick a region close to you for your bucket. In some cases it may make sense to use multi-region or dual-region, but the details are more than I want to get into here. Don’t worry; you can find lots more information on them! Additionally, I won’t go into the details about selecting the appropriate storage class based on access frequency and longevity, but more information can be found here as well our recently introduced Autoclass tiering feature..
Since buckets can be accessed from the Internet, you need to be careful to only make the things you want to be public, public. The default value is to keep your data off of the Internet, so when you create the bucket, there’s an option to “Enforce public access prevention on this bucket” that is already selected. Since we’ll be making items in this bucket public later on, clear the option before confirming the bucket information. Don’t worry; you’ll see how to set that option back later.
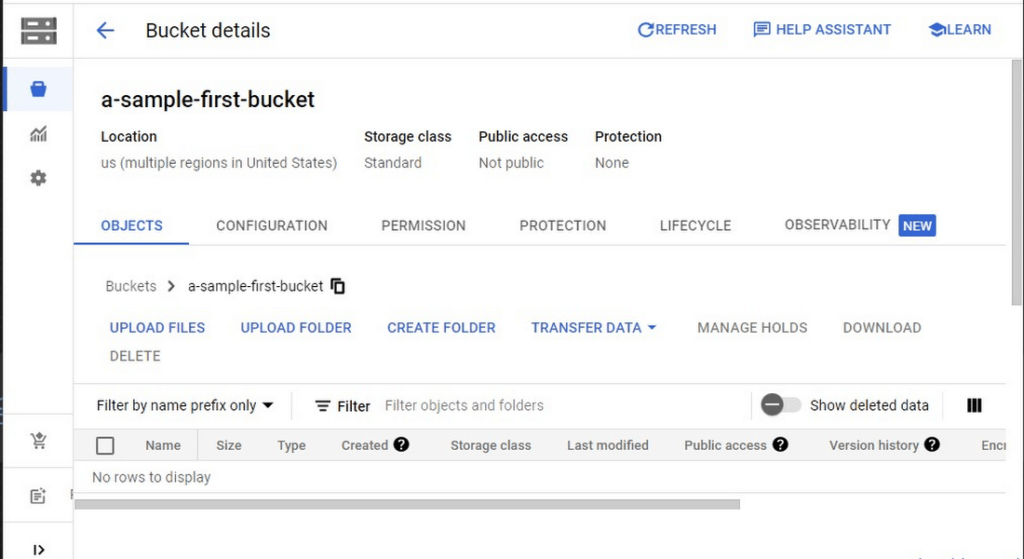
Take a look at the Bucket detail page. There are tabs to see the objects in the bucket, the permissions on the bucket, and much more. There are commands to create folders and to upload files and folders. We’ll do some of this in the next section. You can even find out much more from the Learn option in the upper right.
Adding items to the bucket
Find a file you’d like to upload to this bucket, remembering it will be made public to the Internet later. If you don’t have anything available, there’s a picture of a cat (of course, it’s a cat picture, this is the Internet!) in the interactive tutorial.
Go to the bucket details for your bucket. Using the “Upload files” button, you’ll just upload the file to the bucket by selecting the file from your computer. We won’t get into service classes here, but when you’re ready, there are links in the references.
Of course, if you have a lot of files in a bucket, you probably will want some sort of organization. You can do this by creating folders in your bucket with the “Create Folder” option. Once you’ve done that, you can go to the overflow menu (three vertical dots at the end line with the object information) and select Move. Remember, if you need help finding this, the interactive tutorial will point it out.
Making a bucket public
No surprise, the Bucket details hold lots of information about your bucket. You’ll change the bucket’s permissions in the Permission tab. (I hope that’s not a surprise.) You can then give access to individuals, groups, or all users. For this tutorial, follow the steps to grant access to allUsers. There are a variety of different levels of access you can grant to a user. In this case, just grant the ability to view the object using Storage Object Viewer.
Then go into the Objects tab to find the URL for the object you uploaded. Copy that URL and ensure you can indeed access the object from another tab or incognito window.
Now that you’ve done that, go back to the Permission tab for the bucket and select Prevent Public Access to secure the bucket again.
So, in a nutshell, to make all files in a bucket public, in the Permissions tab:
- Uncheck the option “Remove Public Access Prevention”
- Use Grant Access to give allUsers the Storage Object Viewer role in Cloud Storage.
To make all files in a bucket private, in the Permissions tab select Prevent Public Access.
Cleaning up
There is a charge to keep items in Cloud Storage, so you’ll probably want to delete the object you uploaded by selecting it and pressing Delete. You can delete the bucket in a similar way. The tutorial has details, of course.
While there are lots more details about Cloud Storage, you’ve got the big picture now. Go do something creative and useful with it!
So what now?
If you haven’t walked through the interactive tutorial, give it a try!
ActivStat: Enhancing Live Sports Broadcast with Real-time Stats and Metrics

5096
Of your peers have already read this article.
2:00 Minutes
The most insightful time you'll spend today!
Millions of people annually view esports, as top players and teams compete in thrilling, fast-paced tests of reflexes, strategy, and teamwork. Fans are a diverse group, sharing a passion for action. A new, revolutionary project we’re working on with Call of Duty League just made that action a lot better.
ActivStat brings fans, players, and commentators the power of competitive statistics in real-time—stats that matter not only to the game at hand, but also for a full roster of competitors globally. Using ActivStat, live broadcasts will soon be enhanced with more depth and color-of-play while they’re happening, building excitement and adding to the overall experience.
Technically, ActivStat is an entirely new capability for esports. It’s a constantly updating catalog of statistics that is sourced, analyzed, updated, and delivered in an easy-to-consume way across global-scale computing systems, with a latency of milliseconds or seconds, rather than minutes or hours. By comparison, many of these stats today are available to fans after a day or more of processing.
Call of Duty League plans to begin rolling out ActivStat during the 2021 season. The initial rollout will include critical information like player and team standings and winning ratios across multiple aspects of virtual combat—including ultimately what these numbers mean for rankings. ActivStats are delivered both in raw statistics and via visualizations and graphics, providing commentators with fast access to the types of insights fans crave.
For engineers at both companies, building the service has been an epic success all its own. Due to a sponsorship with Call of Duty signed last February, our dedicated game engineering team quickly innovated a new solution incorporating high-speed networking, data pipelines from multiple cloud sources, and data warehousing to create a user-friendly dashboard. Real data was flowing into commentator dashboards by April.
Esports are more complex to cover in many ways than regular sports. Instead of a well-defined physical playing field (often a simple rectangular space), multiplayer games involve complex and sprawling virtual environments that can be the size of a large campus or airport with multiple levels and hidden locations.
Gameplay between competitors happens across many of these locations simultaneously. In addition, competitors also each choose their own configurations of equipment, known as “loadouts,” which can dramatically affect gameplay and strategy. All of this additional complexity in online gaming involves data that needs to be captured, analyzed, and communicated to the fans in insightful ways.
Two Google Cloud technology capabilities play central roles in the operations of ActivStat. BigQuery—a planet-scale data warehouse that can store and query petabytes of information in real time—is the foundation of the ActivStat platform for gathering and summarizing millisecond-level statistics. Looker, an intuitive analytic dashboard, surfaces those insights to commentators in an easy-to-use, real-time dashboard that enables the commentators to speak to compelling insights and statistics in sync with the gameplay as it is happening in the live broadcast.
While the initial release of ActivStat for this season of Call of Duty League provides compelling and powerful capabilities, it’s only the beginning of this Call of Duty League-Google Cloud co-innovation partnership. Our future vision is mapping gameplay hotspots on the field, and predicting where to place cameras with machine learning as the match evolves–enabling broadcast producers to build excitement for fans by always being in the middle of the best action. Call of Duty League and Google will also look to drive statistics and metrics directly into the broadcast feed.
The implications of the real-time statistical capabilities of ActivStat go beyond gaming and esports. Historically, gaming has been at the leading edge of what computer processing, computer graphics, wide-area networking, data analysis, and insight can do. The real-time data ingestion and output used in ActivStat could one day be useful powering live broadcasts in other types of sporting events, as well as blending live video feeds and data to support use cases in media & entertainment, healthcare, finance, manufacturing, and other verticals. We’re excited about the potential for this bold new solution and partnership between Call of Duty League and Google in esports and beyond.
To learn more about Call of Duty League-Google Cloud partnership, visit our press release.
More Relevant Stories for Your Company
Quick Watch on Six Database Trends
In a data-driven, global, always-on world, databases are the engines that let businesses innovate and transform. As databases get more sophisticated and more organizations look for managed database services to handle infrastructure needs, there are a few key trends we’re seeing. Here’s what to watch.

Key Highlights on Data Analytics to Smooth Your Organization’s Data Journey
As the Olympics kicked off in Tokyo at the end of July, we found ourselves reflecting on the beauty of diverse countries and cultures coming together to celebrate greatness and sportsmanship. For this month’s blog, we’d like to highlight some key data and analytics performances that should help inspire you

Query Insights for Spanner: A blessing for developers and DBAs
Today, application development teams are more agile and are shipping features faster than ever before. In addition to these rapid development cycles and the rise of microservices architectures, the end-to-end ownership of feature development (and performance monitoring) has moved to a shared responsibility model between advanced database administrators and full-stack

How Constellation Brands’ Direct-to-Customer Tech Delivers Economic Impact across Business Portfolio
Editor’s note: Today we’re hearing from Ryan Mason, Director, Head of DTC Growth & Strategy, at alcoholic beverage firm, Constellation Brands on the company’s shift to Direct-to-Consumer (DTC) sales and how Google Cloud’s powerful technology stack helped with this transformation. It’s no secret that consumer businesses have been up-ended in
