





How Constellation Brands’ Direct-to-Customer Tech Delivers Economic Impact across Business Portfolio

6274
Of your peers have already read this article.
3:00 Minutes
The most insightful time you'll spend today!
Editor’s note: Today we’re hearing from Ryan Mason, Director, Head of DTC Growth & Strategy, at alcoholic beverage firm, Constellation Brands on the company’s shift to Direct-to-Consumer (DTC) sales and how Google Cloud’s powerful technology stack helped with this transformation.
It’s no secret that consumer businesses have been up-ended in a lasting manner after 18 months of the pandemic. Consumers have been forced to shop differently over the past year – and as a result, they’ve evolved to be more comfortable with online spending and have grown to expect a certain level of convenience. While the e-commerce share of consumer sales has grown steadily over the past decade, the pandemic was the catalyst for the famous “10 years of growth in 3 months” which many argue is here to stay.
Facing this reality head-on, we placed a new emphasis on Direct-to-Consumer (DTC) with our acquisition of Empathy Wines, a DTC-native wine brand that sells directly to consumers via e-commerce. To accelerate our innovation in the DTC space, we added headcount and new functions to the existing Empathy team and empowered the newly-minted DTC group to apply their digital commerce operating model across the rest of the wine and spirits portfolio, which includes Robert Mondavi Winery, Meiomi Wines, The Prisoner Wine Company, High West Whiskey, and more.
One pandemic and one year later, DTC sales have surged in the wine and spirits category with Constellation positioned as a leader armed with a unique and powerful cloud technology stack, best-in-class e-commerce user experiences, modernized fulfillment solutions, and data-driven growth marketing.
Benefits of Going DTC
A report from McKinsey estimates that the strategic business shift to DTC has been accelerated by two years because of the pandemic and argues that consumer brands that want to thrive will need to aim for a 20% DTC business or higher, which is already taking shape in the market: Nike’s direct digital channels are on track to make up 21.5% of the total business by the end of 2021, up from 15.5% in the last fiscal year, and Adidas is aiming for 50% DTC by 2025. But outside of the clear revenue upside, the auxiliary benefits of going DTC are robust.
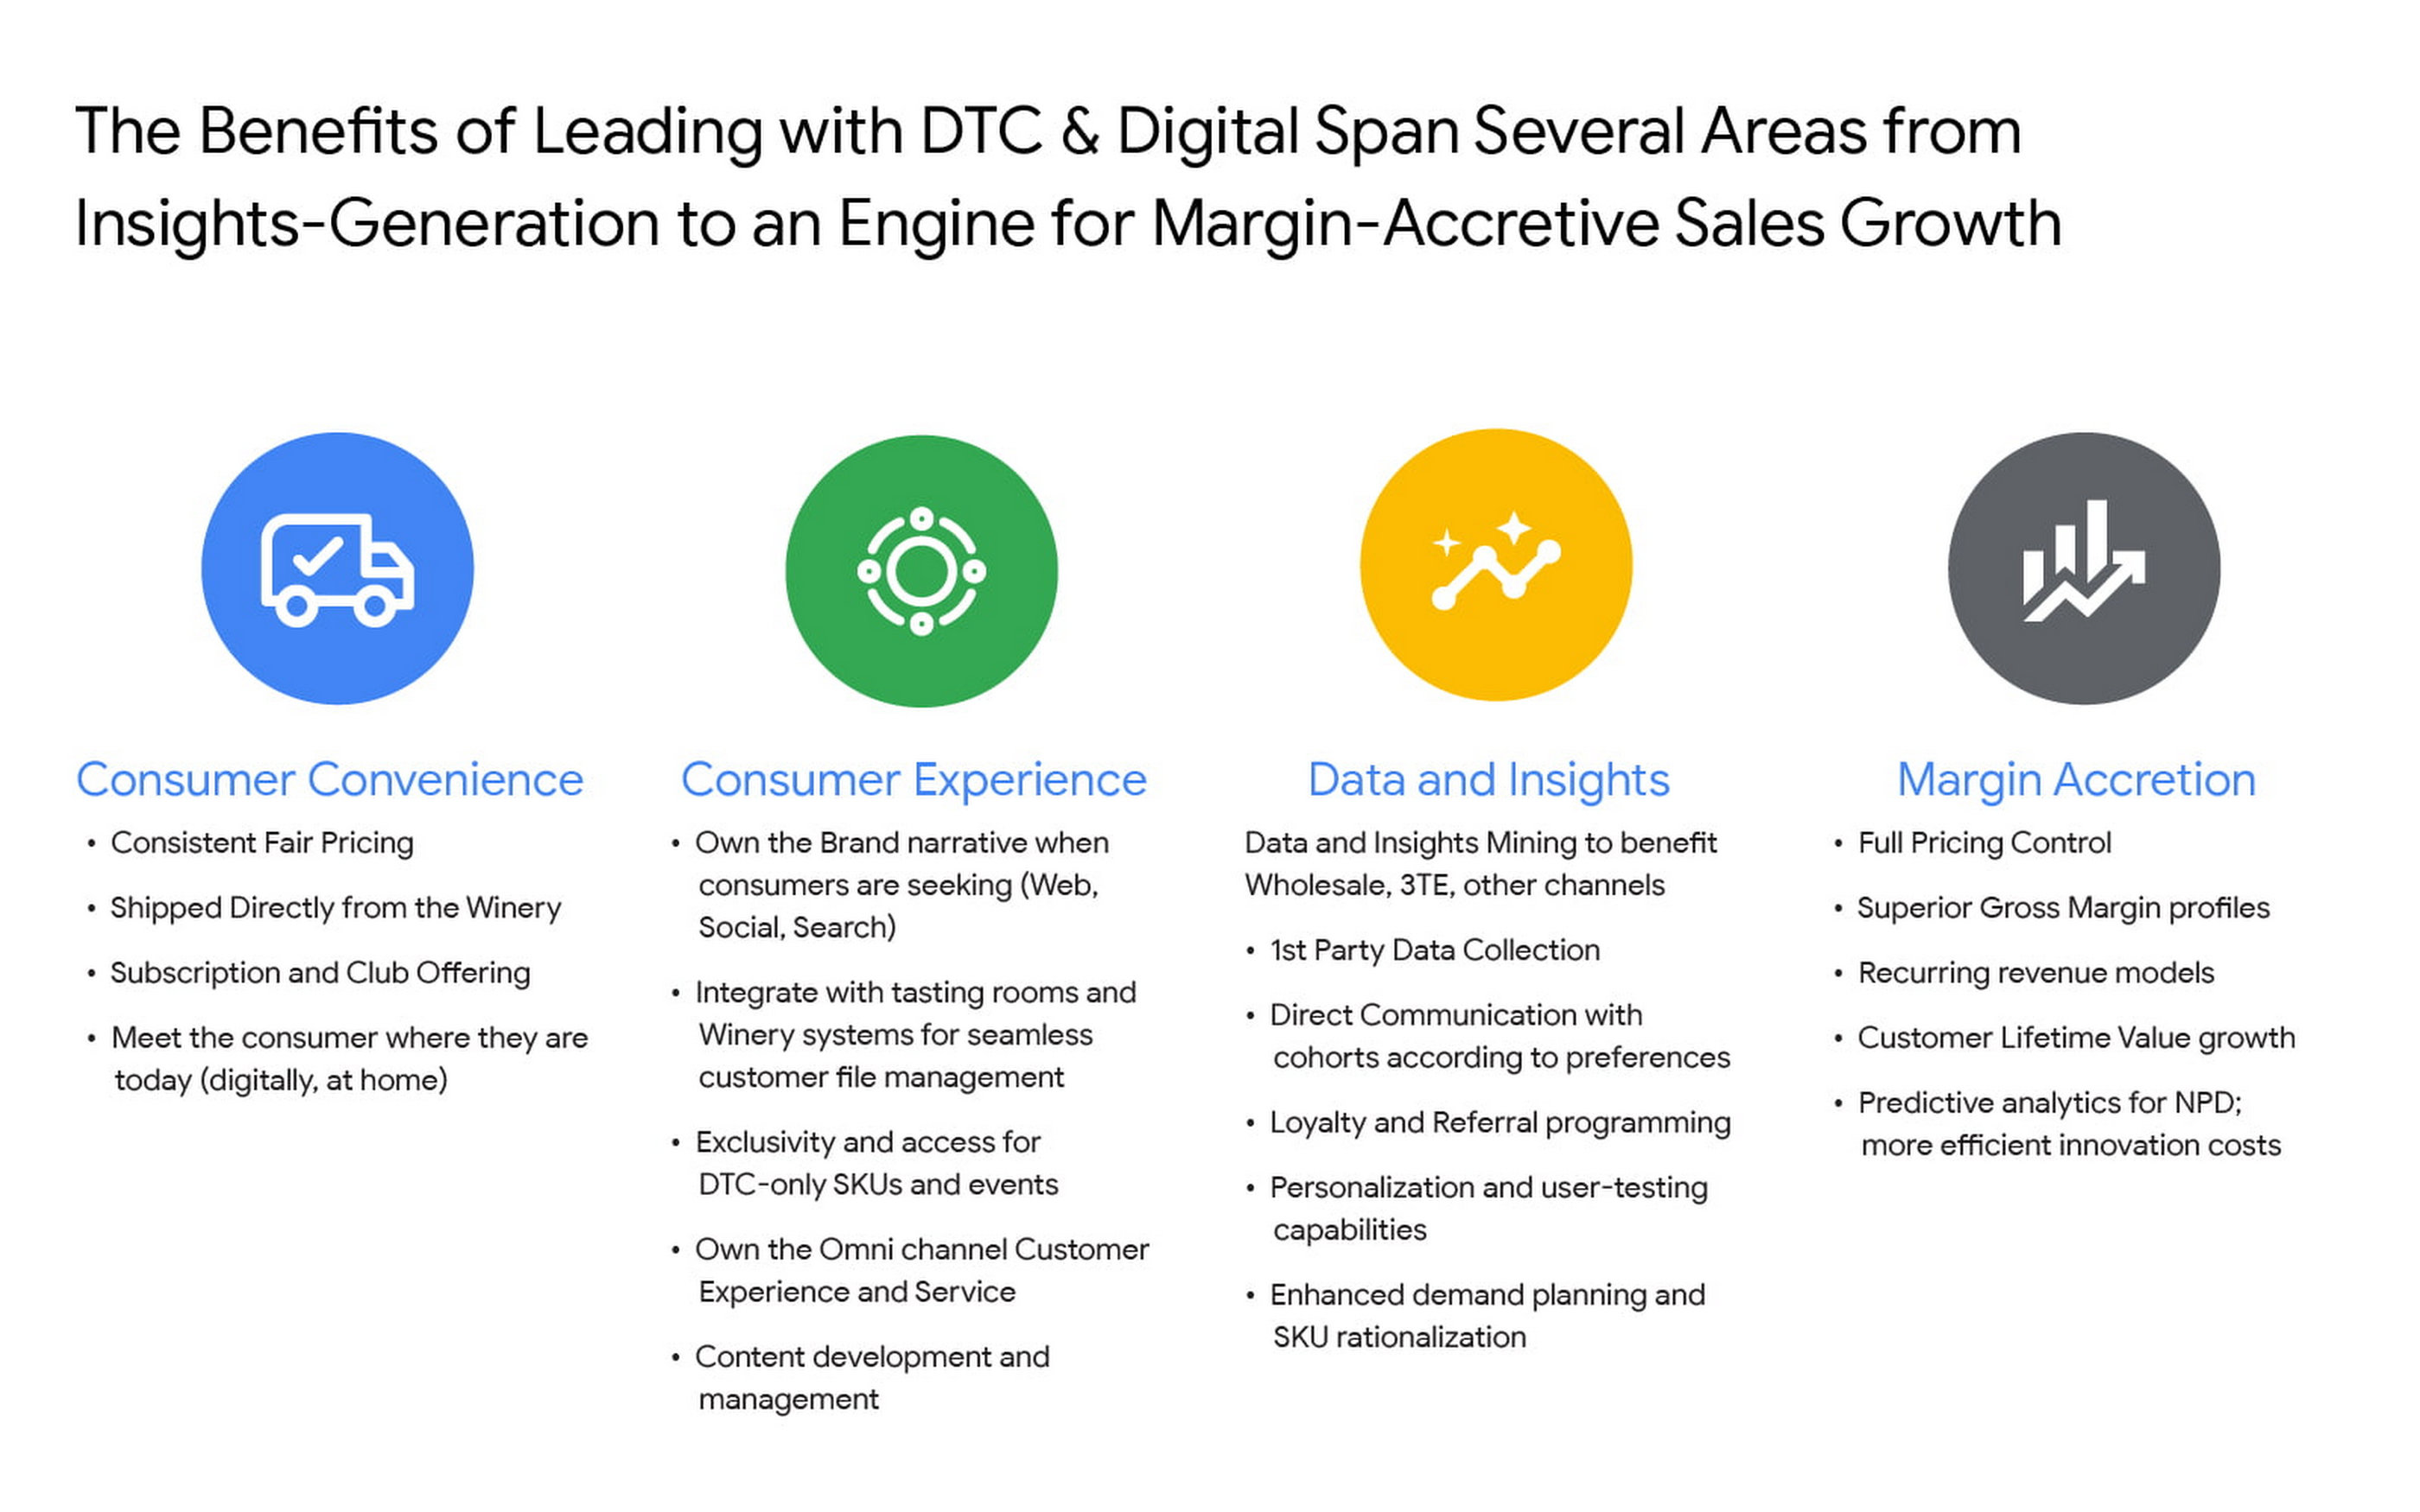
For Constellation Brands, each of these four pillars ring true, and our shift toward DTC is as much about margin accretion and revenue mix management as it is about consumer insights and data. The added complexities of the alcohol space add wrinkles to our DTC approach and manifest in many areas like consumer shopping preference, shipping and logistics hurdles, and more. In order to win share early and continue to lead the category, we recognized the need to harness the immense amount of first-party data to power impactful and actionable insights.
Our DTC technology architecture has fostered a value chain that is completely digitized: website traffic, marketing expenditures, tasting room transactions, e-commerce transactions, logistics and fulfillment events, cost of goods sold (COGS) and margin profiles, etc. are recorded and stored in a data warehouse in real time. For the first time, at any given moment, we can easily and deterministically answer complex business questions like “what is the age and gender distribution of my customers from Los Angeles who have purchased SKU X from Brand.com Y in the last 6 months? What is the cohort net promoter score? Did that increase after we introduced same-day shipping in this zip code? By how much?”
The ability to answer these questions and understand the root causes allows us to stay nimble with product offerings and iterate marketing strategies at the speed of consumer preference. Further, it enables us to optimize our omnichannel presence in the same manner by leaning on DTC consumer insights to develop valuable strategies with key wholesale distribution partners and 3-Tier eCommerce partners like Drizly and Instacart. At its core, Constellation’s DTC practice is designed to be the consumer-centric “tip-of-the-spear” responsible for generating insights from which all sales channels, including wholesale, can benefit.
Constellation’s DTC technology approach prioritizes consumer-centricity and insights generation
We have taken a modern approach to building a digital commerce technology stack, leveraging a hub-and-spoke model built around Shopify Plus and other key emergent technology providers like email provider Klaviyo, loyalty platform Yotpo, Net Promoter Score measurer Delighted, Customer Service module Gorgias, payments processor Stripe, event reservations platform Tock, and many more. For digital marketing and analytics, we use Google Cloud and Google Marketing Platform, which includes products like Analytics 360, Tag Manager 360, and Search Ads 360.
To help gather, organize, and store all of the inbound data from the ecosystem, we partnered with SoundCommerce, a data processing platform for eCommerce businesses. Together with SoundCommerce, we are able to automate data ingestion from all endpoints into a central data warehouse in Google BigQuery. With BigQuery, our data team is able to break data silos and quickly analyze large volumes of data that help unlock actionable insights about our business. BigQuery itself allows for out-of-the-box predictive analytics using SQL via BigQuery ML, and a key differentiator for us is that all Google Marketing Platform data is natively accessible for analysis within BigQuery.
But data possession only addresses half of the opportunity: we needed a powerful and modern business intelligence platform to help make sense of the vast amounts of data flowing into the system. Core to the search was to find a partner that approached BI in a way that fit with our future-looking strategy.
Our DTC team relies on the accurate measurement of variable metrics like Customer Acquisition Cost (CAC), Customer Lifetime Value (CLV), Churn, and Net Promoter Score (NPS) as a bellwether of the health of the business and monitoring these figures on a daily basis is paramount to success. To enable us to keep an accurate pulse on strategic KPIs, we considered several incumbent BI platforms. Ultimately we selected Google Cloud’s Looker for a range of benefits that separated it from the rest of the pack.

From a vision perspective, in this particular case we felt Looker was most aligned with our belief that better decisions are made when everyone has access to accurate, up-to-date information. Looker allows us to realize that vision by surfacing data in a simple web-based interface that empowers everyone to take action with real-time data on critical commercial activities. Furthermore, Looker’s ability to automate and distribute formatted modules to a myriad of stakeholders on a regular cadence increases data literacy and business performance transparency.
From a product perspective, we chose Looker for it’s cloud offering, web-based interface, and centralized, agile modeling layer that creates a trusted environment for all users to confidently interact with data — without any actual data extraction. While other BI tools have centralized semantic layers that require skilled IT resources, we’ve experienced that those can lead to bottlenecks and limited agility. With Looker’s semantic layer, LookML, our BI Team, led by Peter Donald, can easily build upon their SQL knowledge to add both a high degree of control as well as flexibility to our data model. The fully browser-based development environment allows the data team to rapidly develop, test, and deploy code and is backed by robust and seamless Git source code management.
In parallel, LookML empowers business users to collaborate without the need for advanced SQL knowledge. Our data team curates interactive data experiences with Looker to help scale access and adoption. Business users can explore ad hoc analysis, create dashboards, and develop custom data experiences in the web-based environment to get the answers they need without relying on IT resources each time they have a new question, while also maintaining the confidence that the underlying data will always be accurate. This helps us meet our primary goal of providing all businesses users with the data access they need to monitor the pulse of key metrics in near real-time.
Impact and future of DTC BI at Constellation
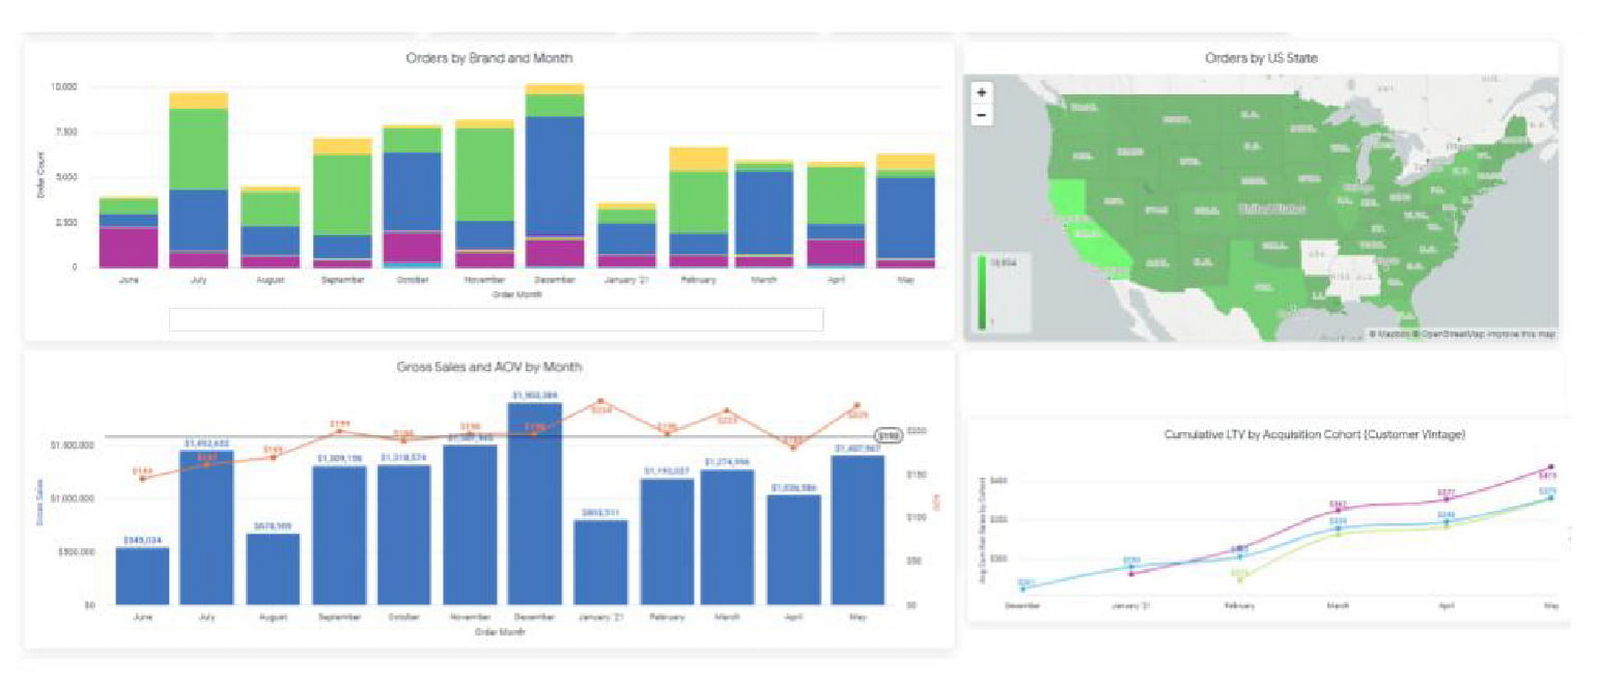
In short order, taking a modern and integrated approach to the DTC technology stack has delivered economic impact across the portfolio, helping our team understand and combat customer churn, increase conversion rates, and optimize the customer acquisition cost (CAC) and customer lifetime value (CLV) ratios. Perhaps most important is the benefit it can provide to the customer base. Mining customer data and consumer behavior generates data into what our customers are seeking, giving us insights to supply more, or less of it. For example, observing sales velocity and conversion rates by SKU or by region can help us better understand changes in customer taste profiles and fluctuations in demand, providing the foundation for a more powerful innovation pipeline and more effective sales and distribution tactics in wholesale. Our team has also been an early pilot tester for Looker’s new integration with Customer Match, which contributes to the virtuous cycle between data insight and data activation. In the future, our plan is to leverage this cycle to amplify the impact of Google Ads across Search, Shopping, and YouTube placements for the wine and spirits portfolio.
The operational impact of Looker is also substantial: our team estimates that the number of hours needed to reach critical business decisions has been reduced by nearly 60%, boosting productivity and accelerating the daily operating rhythm. A thoughtfully curated technology stack together with a modern BI solution allows us to stay at the vanguard of the industry. While the DTC sales channel is not designed to surpass the core business of wholesale for Constellation in terms of size, the approach enables unparalleled insights and measurement abilities that will pay dividends for the entire business for years to come.
Why More DB Admins Love Google Cloud Spanner, Its Best Uses Cases—and What it Costs

3763
Of your peers have already read this article.
2:45 Minutes
The most insightful time you'll spend today!
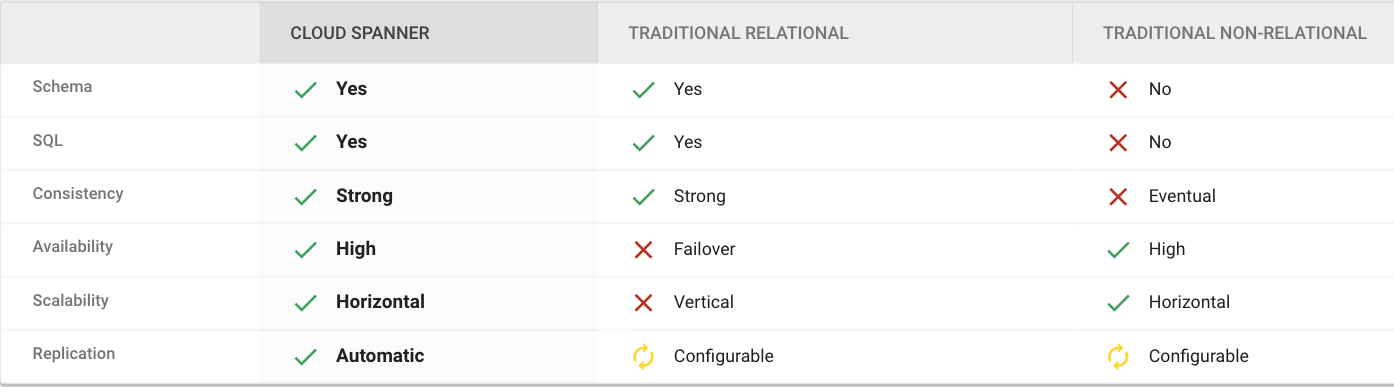
Cloud Spanner is the first scalable, enterprise-grade, globally-distributed, and strongly consistent database service built for the cloud specifically to combine the benefits of relational database structure with non-relational horizontal scale.
This combination delivers high-performance transactions and strong consistency across rows, regions, and continents with an industry-leading 99.999% availability SLA, no planned downtime, and enterprise-grade security.
Cloud Spanner revolutionizes database administration and management and makes application development more efficient.
Find out How Streak built a graph database on Cloud Spanner to wrangle billions of emails
What Are Cloud Spanner’s Strengths?
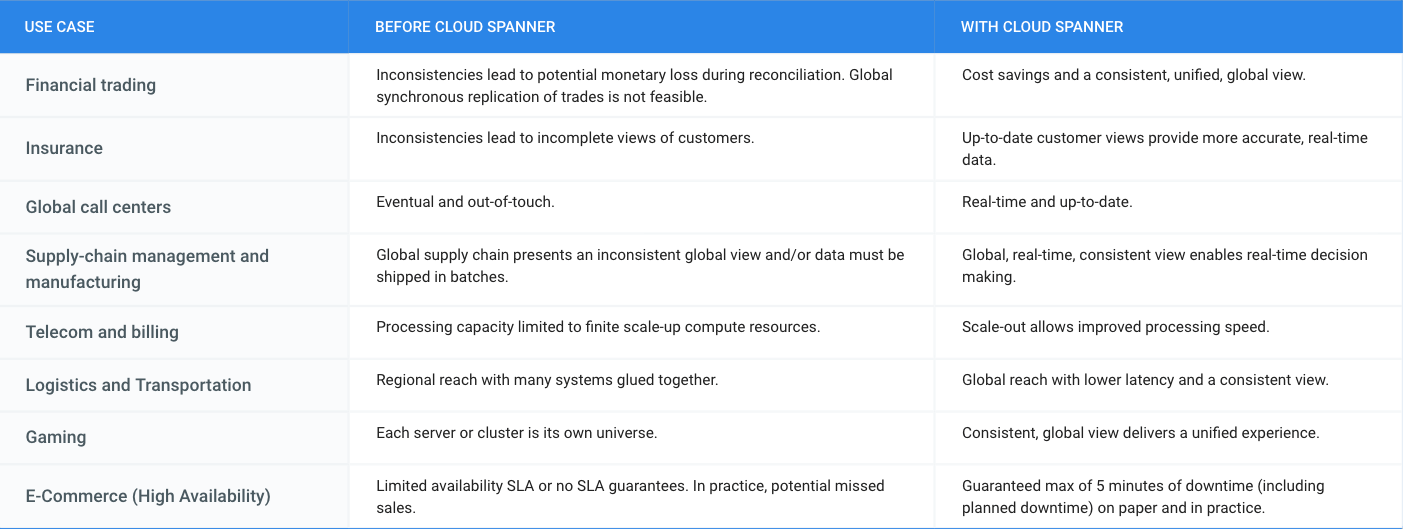
What is Cloud Spanner Useful For?
What Does it Cost?
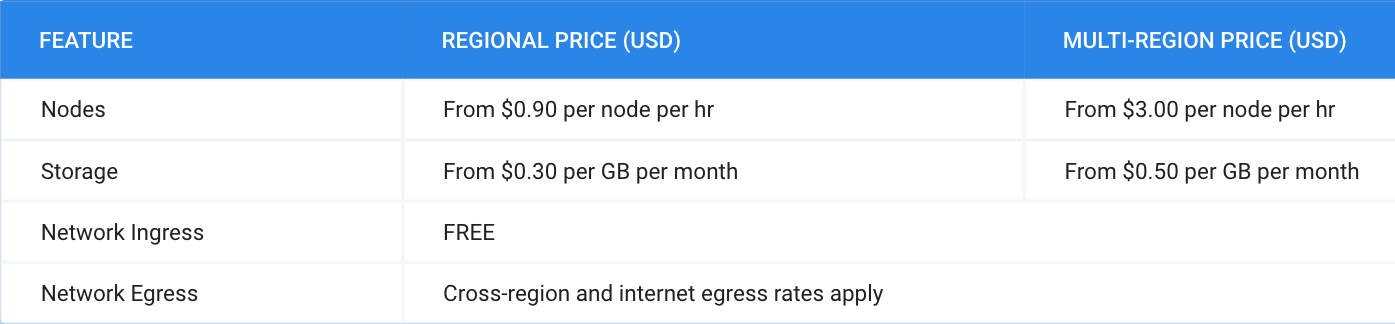
Pricing for Cloud Spanner is simple and predictable. You are only charged for the number of nodes in your instance, the amount of storage that your tables and secondary indexes use (not pre-provisioned), and the amount of network bandwidth used. Note that there is no additional charge for replication. For more detailed pricing information, please view the pricing guide.
Fairygoodboss and Google Cloud Tied to Advancing Diversity and Female Leadership at Workplaces

5119
Of your peers have already read this article.
2:00 Minutes
The most insightful time you'll spend today!
May is Asian American Pacific Islander Heritage Month — a time for us to come together to celebrate and remember the important people and history of Asian and Pacific Island heritage. This feature highlights founder Georgene Huang and how her startup Fairygodboss uses easy to use Google Cloud tools to grow and innovate.
Coming from a male-dominated industry like Wall Street, I never thought much about my gender. I was so focused on work that I didn’t feel like I could focus on my identity as a woman of color. That all changed when I found myself thrust into the job market while two months pregnant.
Traditionally, job-seeking sites are built by – and geared towards – men and their professional needs. There was no recruiting site that broke down what candidates who identify as women might expect from a company, let alone women of color like myself. I founded Fairygodboss to create a space where women can crowdsource information about opportunities and employers in order to make informed career decisions.
Fairygodboss
Fair•y•god•boss (noun): A person who elevates women at work.
Fairygodboss is the largest career community for women. In researching potential employers, I had many questions surrounding company culture, maternity leave, and women in leadership positions. While sites like Glassdoor provide high-level details for job seekers, I wanted more concrete examples and data than general salary information and anecdotes about work-life balance.
Fairygodboss began as a job review site geared towards women, but has expanded significantly since our initial launch. In addition to providing free resources like career connections, job listings, virtual recruiting events, community advice, and real research on how companies treat women, we also proactively help companies improve gender diversity. Fairygodboss partners with hundreds of top employers to create a 360-degree recruiting and employer branding program designed to drive female applicants to job postings by showcasing a company’s track record of women in leadership within a company, and their diversity investments.

Google Cloud + Fairygodboss: Data defined
At our core, Fairygodboss is a data-driven company, and we rely on Google Cloud to help us process, store, and analyze user-driven events occurring on the site. As a highly scalable, serverless, and cost-effective data warehousing solution, BigQuery collect millions of events each day, helping us identify where traffic is coming from (and where it goes next), and it produces actionable insights to provide better recommendations, information, and opportunities for women visiting our platform.
After seamlessly connecting our BigQuery data to Data Studio, we have been able to visualize and make sense of all the data we receive on our platform. Unlike some other data visualization tools, Data Studio allows us to analyze data in real time. With tools like BigQuery, we are now able to identify trends and gain a deep understanding for how our users interact with our site.
Google for Startups Accelerator: Women Founders
In order to provide more accurate job recommendations for our users, the Fairygodboss team wanted to build a machine learning prototype to classify our users and jobs into categories to facilitate more effective matching. So we applied for the Google for Startups Accelerator: Women Founders, a three-month digital accelerator program for high-potential Seed to Series A tech startups based in the U.S. and Canada. Along with tailored mentorship and product support from Googlers and industry experts, the Google for Startups Accelerator provided $100K in Google Cloud credits to scale our businesses. The mentorship we received from the Google Cloud technical experts as part of the Accelerator – special shout out to Peter Novig! – empowered us to integrate Cloud AutoML into our systems and ultimately curate more accurate job suggestions for our users.
Not only did the Google for Startups Accelerator program help to achieve our business goals for the year, it was also extremely beneficial to be connected with a cohort of other women founders of color. While we are all building different kinds of businesses across different industries, the guidance around fundraising, scaling teams, and coping with the struggles of being a founder rang true for all of us.
Advancing the community
It can be daunting to launch your own business – and even more so as an AAPI woman. Throughout my career, I am certain I have experienced unconscious bias around my race. Specifically, there have likely been “model minority” stereotypes about my demeanor and math abilities, assumptions that I may be mild-mannered or agreeable. While frustrating, these unfair tropes actually inspired me to see myself beyond others’ perceptions. Why be either analytical or creative, meek or brash, inspiring or agreeable? It’s the ors of life that prevent us from seeing ourselves as truly multi-dimensional individuals. I aspired to be more instead of or, and want my company to be as well.
As an inclusion-focused business, it is extremely important that Fairygodboss mindfully engage with all underrepresented groups. Diversity can be sliced in many different ways, and these intersections lead to great opportunities for change. We have a team of volunteer ‘culture wizards’ at work that provide educational resources and videos for those wanting to learn more about different cultures and identities from members of under-represented groups. We also practice what we preach at Fairygodboss by prioritizing diverse slates and diversity in our own hiring process. We aim for the talent we hire to be representative of the diverse communities we support. It is imperative to take an intentional approach to hiring diverse talent, as it falls on all employers to promote equity and inclusion—there are always ways in which we can all improve. Fairygodboss looks forward to evolving with Google Cloud in 2021 and beyond as we work together to foster inclusive teams around the world.
If you want to learn more about how Google Cloud can help your startup, visit our Startup Program application page here and sign up for our monthly startup newsletter to get a peek at our community activities, digital events, special offers, and more.
10150
Of your peers have already watched this video.
1:00 Minutes
The most insightful time you'll spend today!
Predict User Churn on Gaming Apps with Google Analytics Data using BigQuery ML
User retention can be a major challenge for mobile game developers. According to the Mobile Gaming Industry Analysis in 2019, most mobile games only see a 25% retention rate for users after the first day. To retain a larger percentage of users after their first use of an app, developers can take steps to motivate and incentivize certain users to return. But to do so, developers need to identify the propensity of any specific user returning after the first 24 hours.
In this blog post, we will discuss how you can use BigQuery ML to run propensity models on Google Analytics 4 data from your gaming app to determine the likelihood of specific users returning to your app.
You can also use the same end-to-end solution approach in other types of apps using Google Analytics for Firebase as well as apps and websites using Google Analytics 4. To try out the steps in this blogpost or to implement the solution for your own data, you can use this Jupyter Notebook.
Using this blog post and the accompanying Jupyter Notebook, you’ll learn how to:
- Explore the BigQuery export dataset for Google Analytics 4
- Prepare the training data using demographic and behavioural attributes
- Train propensity models using BigQuery ML
- Evaluate BigQuery ML models
- Make predictions using the BigQuery ML models
- Implement model insights in practical implementations
Google Analytics 4 (GA4) properties unify app and website measurement on a single platform and are now default in Google Analytics. Any business that wants to measure their website, app, or both, can use GA4 for a more complete view of how customers engage with their business. With the launch of Google Analytics 4, BigQuery export of Google Analytics data is now available to all users. If you are already using a Google Analytics 4 property, you can follow this guide to set up exporting your GA data to BigQuery.
Once you have set up the BigQuery export, you can explore the data in BigQuery. Google Analytics 4 uses an event-based measurement model. Each row in the data is an event with additional parameters and properties. The Schema for BigQuery Export can help you to understand the structure of the data.
In this blogpost, we use the public sample export data from an actual mobile game app called “Flood It!” (Android, iOS) to build a churn prediction model. But you can use data from your own app or website.
Here’s what the data looks like. Each row in the dataset is a unique event, which can contain nested fields for event parameters.
SELECT *FROM `firebase-public-project.analytics_153293282.events_*`TABLESAMPLE SYSTEM (1 PERCENT)

This dataset contains 5.7M events from over 15k users.
SELECTCOUNT(DISTINCT user_pseudo_id) as count_distinct_users,COUNT(event_timestamp) as count_eventsFROM`firebase-public-project.analytics_153293282.events_*

Our goal is to use BigQuery ML on the sample app dataset to predict propensity to user churn or not churn based on users’ demographics and activities within the first 24 hours of app installation.

In the following sections, we’ll cover how to:
- Pre-process the raw event data from GA4
- Identify users & the label feature
- Process demographic features
- Process behavioral features
- Train classification model using BigQuery ML
- Evaluate the model using BigQueryML
- Make predictions using BigQuery ML
- Utilize predictions for activation
Pre-process the raw event data
You cannot simply use raw event data to train a machine learning model as it would not be in the right shape and format to use as training data. So in this section, we’ll go through how to pre-process the raw data into an appropriate format to use as training data for classification models.
This is what the training data should look like for our use case at the end of this section:

Notice that in this training data, each row represents a unique user with a distinct user ID (user_pseudo_id).
Identify users & the label feature
We first filtered the dataset to remove users who were unlikely to return the app anyway. We defined these ‘bounced’ users as ones who spent less than 10 mins with the app. Then we labeled all remaining users:
- churned: No event data for the user after 24 hours of first engaging with the app.
- returned: The user has at least one event record after 24 hours of first engaging with the app.
For your use case, you can have a different definition of bounce and churning. Also you can even try to predict something else other than churning, e.g.:
- whether a user is likely to spend money on in-game currency
- likelihood of completing n-number of game levels
- likelihood of spending n amount of time in-game etc.
In such cases, label each record accordingly so that whatever you are trying to predict can be identified from the label column.
From our dataset, we found that ~41% users (5,557) bounced. However, from the remaining users (8,031), ~23% (1,883) churned after 24 hours:
SELECTbounced,churned,COUNT(churned) as count_usersFROMbqmlga4.returningusersGROUP BY 1,2ORDER BY bounced

To create these bounced and churned columns, we used the following snippet of SQL code.
...#churned = 1 if last_touch within 24 hr of app installation, else 0IF (user_last_engagement < TIMESTAMP_ADD(user_first_engagement,INTERVAL 24 HOUR),1,0 ) AS churned,#bounced = 1 if last_touch within 10 min, else 0IF (user_last_engagement <= TIMESTAMP_ADD(user_first_engagement,INTERVAL 10 MINUTE),1,0 ) AS bounced,...
You can view the Jupyter Notebook for the full query used for materializing the bounced and churned labels.
Process demographic features
Next, we added features both for demographic data and for behavioral data spanning across multiple columns. Having a combination of both demographic data and behavioral data helps to create a more predictive model.
We used the following fields for each user as demographic features:
geo.countrydevice.operating_systemdevice.language
A user might have multiple unique values in these fields — for example if a user uses the app from two different devices. To simplify, we used the values from the very first user engagement event.
CREATE OR REPLACE VIEW bqmlga4.user_demographics AS (WITH first_values AS (SELECTuser_pseudo_id,geo.country as country,device.operating_system as operating_system,device.language as language,ROW_NUMBER() OVER (PARTITION BY user_pseudo_id ORDER BY event_timestamp DESC) AS row_numFROM `firebase-public-project.analytics_153293282.events_*`WHERE event_name="user_engagement")SELECT * EXCEPT (row_num)FROM first_valuesWHERE row_num = 1 #first engagement);
Process behavioral features
There is additional demographic information present in the GA4 export dataset, e.g. app_info, device, event_params, geo etc. You may also send demographic information to Google Analytics through each hit via user_properties. Furthermore, if you have first-party data on your own system, you can join that with the GA4 export data based on user_ids.
To extract user behavior from the data, we looked into the user’s activities within the first 24 hours of first user engagement. In addition to the events automatically collected by Google Analytics, there are also the recommended events for games that can be explored to analyze user behavior. For our use case, to predict user churn, we counted the number of times the follow events were collected for a user within 24 hours of first user engagement:
user_engagementlevel_start_quickplaylevel_end_quickplaylevel_complete_quickplaylevel_reset_quickplaypost_scorespend_virtual_currencyad_rewardchallenge_a_friendcompleted_5_levelsuse_extra_steps
The following query shows how these features were calculated:
WITHevents_first24hr AS (SELECTe.*FROM`firebase-public-project.analytics_153293282.events_*` eJOINbqmlga4.returningusers rONe.user_pseudo_id = r.user_pseudo_idWHERETIMESTAMP_MICROS(e.event_timestamp) <= r.ts_24hr_after_first_engagement)SELECTuser_pseudo_id,SUM(IF(event_name = 'user_engagement', 1, 0)) AS cnt_user_engagement,# ... repeated for all behavior data ...SUM(IF(event_name = 'use_extra_steps', 1, 0)) AS cnt_use_extra_steps,FROMevents_first24hrGROUP BY1
View the notebook for the query used to aggregate and extract the behavioral data. You can use different sets of events for your use case. To view the complete list of events, use the following query:
SELECTevent_name,COUNT(event_name) as event_countFROM`firebase-public-project.analytics_153293282.events_*`GROUP BY 1ORDER BYevent_count DESC
After this we combined the features to ensure our training dataset reflects the intended structure. We had the following columns in our table:
- User ID:
user_pseudo_id
- Label:
churned
- Demographic features
countrydevice_osdevice_language
- Behavioral features
cnt_user_engagementcnt_level_start_quickplaycnt_level_end_quickplaycnt_level_complete_quickplaycnt_level_reset_quickplaycnt_post_scorecnt_spend_virtual_currencycnt_ad_rewardcnt_challenge_a_friendcnt_completed_5_levelscnt_use_extra_stepsuser_first_engagement
At this point, the dataset was ready to train the classification machine learning model in BigQuery ML. Once trained, the model will output a propensity score between churn (churned=1) or return (churned=0) indicating the probability of a user churning based on the training data.
Train classification model
When using the CREATE MODEL statement, BigQuery ML automatically splits the data between training and test. Thus the model can be evaluated immediately after training (see the documentation for more information).
For the ML model, we can choose among the following classification algorithms where each type has its own pros and cons:

Often logistic regression is used as a starting point because it is the fastest to train. The query below shows how we trained the logistic regression classification models in BigQuery ML.
CREATE OR REPLACE MODEL bqmlga4.churn_logregTRANSFORM(EXTRACT(MONTH from user_first_engagement) as month,EXTRACT(DAYOFYEAR from user_first_engagement) as julianday,EXTRACT(DAYOFWEEK from user_first_engagement) as dayofweek,EXTRACT(HOUR from user_first_engagement) as hour,* EXCEPT(user_first_engagement, user_pseudo_id))OPTIONS(MODEL_TYPE="LOGISTIC_REG",INPUT_LABEL_COLS=["churned"]) ASSELECT*FROMbqmlga4.train
We extracted month, julianday, and dayofweek from datetimes/timestamps as one simple example of additional feature preprocessing before training. Using TRANSFORM() in your CREATE MODEL query allows the model to remember the extracted values. Thus, when making predictions using the model later on, these values won’t have to be extracted again. View the notebook for the example queries to train other types of models (XGBoost, deep neural network, AutoML Tables).
Evaluate model
Once the model finished training, we ran ML.EVALUATE to generate precision, recall, accuracy and f1_score for the model:
SELECT*FROMML.EVALUATE(MODEL bqmlga4.churn_logreg)

The optional THRESHOLD parameter can be used to modify the default classification threshold of 0.5. For more information on these metrics, you can read through the definitions on precision and recall, accuracy, f1-score, log_loss and roc_auc. Comparing the resulting evaluation metrics can help to decide among multiple models.Furthermore, we used a confusion matrix to inspect how well the model predicted the labels, compared to the actual labels. The confusion matrix is created using the default threshold of 0.5, which you may want to adjust to optimize for recall, precision, or a balance (more information here).
SELECTexpected_label,_0 AS predicted_0,_1 AS predicted_1FROMML.CONFUSION_MATRIX(MODEL bqmlga4.churn_logreg)

This table can be interpreted in the following way:

Make predictions using BigQuery ML
Once the ideal model was available, we ran ML.PREDICT to make predictions. For propensity modeling, the most important output is the probability of a behavior occurring. The following query returns the probability that the user will return after 24 hrs. The higher the probability and closer it is to 1, the more likely the user is predicted to return, and the closer it is to 0, the more likely the user is predicted to churn.
SELECTuser_pseudo_id,returned,predicted_returned,predicted_returned_probs[OFFSET(0)].prob as probability_returnedFROMML.PREDICT(MODEL bqmlga4.churn_logreg,(SELECT * FROM bqmlga4.train)) #can be replaced with a proper test dataset
Utilize predictions for activation
Once the model predictions are available for your users, you can activate this insight in different ways. In our analysis, we used user_pseudo_id as the user identifier. However, ideally, your app should send back the user_id from your app to Google Analytics. In addition to using first-party data for model predictions, this will also let you join back the predictions from the model into your own data.
- You can import the model predictions back into Google Analytics as a user attribute. This can be done using the Data Import feature for Google Analytics 4. Based on the prediction values you can Create and edit audiences and also do Audience targeting. For example, an audience can be users with prediction probability between 0.4 and 0.7, to represent users who are predicted to be “on the fence” between churning and returning.
- For Firebase Apps, you can use the Import segments feature. You can tailor user experience by targeting your identified users through Firebase services such as Remote Config, Cloud Messaging, and In-App Messaging. This will involve importing the segment data from BigQuery into Firebase. After that you can send notifications to the users, configure the app for them, or follow the user journeys across devices.
- Run targeted marketing campaigns via CRMs like Salesforce, e.g. send out reminder emails.
You can find all of the code used in this blogpost in the Github repository:
What’s next?
Continuous model evaluation and re-training
As you collect more data from your users, you may want to regularly evaluate your model on fresh data and re-train the model if you notice that the model quality is decaying.
Continuous evaluation—the process of ensuring a production machine learning model is still performing well on new data—is an essential part in any ML workflow. Performing continuous evaluation can help you catch model drift, a phenomenon that occurs when the data used to train your model no longer reflects the current environment.
To learn more about how to do continuous model evaluation and re-train models, you can read the blogpost: Continuous model evaluation with BigQuery ML, Stored Procedures, and Cloud Scheduler
More resources
If you’d like to learn more about any of the topics covered in this post, check out these resources:
- BigQuery export of Google Analytics data
- BigQuery ML quickstart
- Events automatically collected by Google Analytics 4
- Qwiklabs: Create ML models with BigQuery ML
Or learn more about how you can use BigQuery ML to easily build other machine learning solutions:
- How to build demand forecasting models with BigQuery ML
- How to build a recommendation system on e-commerce data using BigQuery ML
Let us know what you thought of this post, and if you have topics you’d like to see covered in the future! You can find us on Twitter at @polonglin and @_mkazi_.Thanks to reviewers: Abhishek Kashyap, Breen Baker, David Sabater Dinter.
Renaulution: Renault’s story of migrating to 70 applications in 2 years

3315
Of your peers have already read this article.
3:00 Minutes
The most insightful time you'll spend today!
Editor’s note: Renault, the French automaker, embarked on a wholesale migration of its information systems—moving 70 applications to Google Cloud. Here’s how they migrated from Oracle databases to Cloud SQL for PostgreSQL.
The Renault Group, known for its iconic French cars has grown to include four complementary brands, and sold nearly 3 million vehicles in 2020. Following our company-wide strategic plan, “Renaulution,” we’ve shifted our focus over the past year from a car company integrating tech, to a tech company integrating cars that will develop software for our business. For the information systems group, that meant modernizing our entire portfolio and migrating 70 in-house applications (our quality and customer information systems) to Google Cloud. It was an ambitious project, but it’s paid off. In two years we migrated our Quality and Customer Satisfaction information systems applications, optimized our code, and cut costs thanks to managed database services. Compared to our on-premises infrastructure, using Google Cloud services and open-source technologies comes to roughly one dollar per user per year, which is significantly cheaper.
An ambitious journey to Google Cloud
We began our cloud journey in 2016 with digital projects integrating a new way of working and new technologies. These new technologies included those for agility at scale, data capabilities and CI/CD toolchain. Google Cloud stood out as the clear choice for its data capabilities. Not only are we using BigQuery and Dataflow to improve scaling and costs, but we are also now using fully managed database services like Cloud SQL for PostgreSQL. Data is a key asset for a modern car maker because it connects the car maker to the user, allows car makers to better understand usage and better informs what decisions we should make about our products and services. After we migrated our data lake to Google Cloud, it was a natural next step to move our front-end applications to Google Cloud so they would be easier to maintain and we could benefit from faster response times. This project was no small undertaking. For those 70 in-house applications (e.g. vehicle quality evaluation, statistical process control in plants, product issue management, survey analysis), for our information systems landscape, we had a range of technologies—including Oracle, MySQL, Java, IBM MQ, and CFT—with some applications created 20 years ago.
Champions spearhead each migration
Before we started the migration, we did a global analysis of the landscape to understand each application and its complexity. Then we planned a progressive approach, focusing on the smallest applications first such as those with a limited number of screens or with simple SQL queries, and saving the largest for last. Initially we used some automatic tools for the migration, but we learned very quickly nothing can replace the development team’s institutional knowledge. They served as our migration champions.
The apps go marching one by one
When we migrated our first few Oracle databases to Cloud SQL for PostgreSQL we tracked our learnings in an internal wiki to share common SQL patterns, which helped us speed up the process. For some applications, we simplified the architecture and took the opportunity to analyze and optimize SQL queries during the rework. We also used monitoring tools like Dynatrace and JavaMelody to ensure we improved the user experience.
The approach we developed was very successful—where database migration was initially seen as insurmountable, the entire migration project was completed in two years.
With on-premises applications it was hard for our developers to separate code performance from infrastructure limitations. So as part of our migration to Google Cloud, we optimized our applications with monitoring services. With these insights our team has more control over resources, which has reduced our maintenance and operations activity and resulted in faster, more stable applications. Plus, migrating to Cloud SQL has made it much easier for us to change our infrastructure as needed, add more power when necessary or even reduce our infrastructure size.
A new regime on Cloud SQL
Now that we’re running on Cloud SQL, we’ve improved performance even on large databases with many connected users. Thanks to built-in tools in the Google Cloud environment, we can now easily understand performance issues and quickly solve them. For example, we were able to reduce the duration of a heavy batch processing by a factor of three from nine to three hours. And we don’t have to wait for the installation of a new server, so our team can move faster. Beyond speed, we’ve also been able to cut costs. We optimized our code based on insights from monitoring tools, which not only enabled a more responsive application for the user, but it also reduced our costs because we’re not overprovisioned.
Learn more about the Renault Group and try out Cloud SQL today.
Cloud Databases: An Essential Building Block for Transforming Customer Experiences
DOWNLOAD RESEARCH REPORTS2758
Of your peers have already downloaded this article
11:30 Minutes
The most insightful time you'll spend today!
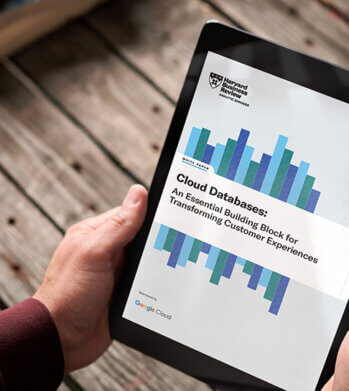
Around the globe, companies realize that iterating and innovating the customer experience (CX) is the key to their business transformation and success goals. Customers expect exceptional and speedy service from organizations through personalized experiences and easy-to-use apps.
However, while most companies want data-driven innovation, many of them overlook a key mechanism to do so: operational databases. These databases run a company’s day-to-day operations and power applications around the globe.
“Operational databases are often overlooked because they are behind the scenes,” says Kumar Menon, senior vice president of data fabric and decision science technology at Atlanta-based Equifax, the multinational consumer credit reporting agency. “Companies often focus on providing strong customer-facing applications, but the application will only achieve the desired results with a well-architected operational data capability that helps drive the real-time analytics needed to make the customer experience effective and memorable. It is the backbone of anything that you will build on top of it.”
Better customer experience is a business outcome of using cloud databases to build applications. This dictum stands to reason because moving from a traditional on-premises database to a modern database in the cloud, or simply building new applications in the cloud, allows companies to address operational overhead, unlock new possibilities, implement new features quickly, increase application reliability, and serve users across more regions—all the things that enhance CX and make it possible. Google Cloud sponsored this research by Harvard Business Review Analytic Services to understand how digital innovators are delighting their customers by using modern cloud databases. The report analyzes why operational databases are an essential building block for transformative experiences and highlights some of the critical capabilities leaders should prioritize. Through interviews with technology executives, data leaders, and industry experts, it provides real-world examples of benefits companies are realizing with cloud databases. We hope you find the findings and real-world examples in this report insightful and inspiring.
More Relevant Stories for Your Company

Combining IoT and Analytics to Warn Manufacturers of Line Break Downs and Increase Profitability
Oden Technologies is using the Internet of Things (IoT) to improve the factories of today. The giant network of “things” (including people) connected to each other via the Internet has the potential to reduce waste, increase efficiency, and improve safety across all walks of life. Oden is leading IoT innovation in

Choose the Right Google Database Service With This Chart
A growing number of Indian enterprises are leveraging the Google Cloud to run their database workloads. This is because Google Cloud offers fully managed, scalable database services to support all applications today and tomorrow. In fact, Forrester has named Google as a Leader in The Forrester Wave™: Database-as-a-Service, Q2 2019.

Migrate Your Microsoft SQL Server Workloads to Google Cloud
Enterprise database workloads are the backbone of many of your applications and ecosystems. Also, guaranteed availability is critical when choosing a cloud provider. Many enterprises built their mission-critical applications on Microsoft SQL Server 2008, and it’s common still to run into older versions of SQL Server as you’re working toward

Developers and Practitioners’ Guide for Moving On-prem Data Warehouse to BigQuery
Data teams across companies have continuous challenges of consolidating data, processing it and making it useful. They deal with challenges such as a mixture of multiple ETL jobs, long ETL windows capacity-bound on-premise data warehouses and ever-increasing demands from users. They also need to make sure that the downstream requirements
