





Query Insights for Spanner: A blessing for developers and DBAs

3290
Of your peers have already read this article.
1:30 Minutes
The most insightful time you'll spend today!
Today, application development teams are more agile and are shipping features faster than ever before. In addition to these rapid development cycles and the rise of microservices architectures, the end-to-end ownership of feature development (and performance monitoring) has moved to a shared responsibility model between advanced database administrators and full-stack developers. However, most developers don’t have the years of experience or the time needed to debug complex query performance issues and database administrators are now a scarce resource in most organizations. As a result, there is a dire need for tools for developers and DBAs alike to quickly diagnose performance issues.
Introducing Query Insights for Spanner
We are delighted to announce the launch of Query Insights for Spanner, a set of visualization tools that provide an easy way for developers and database administrators to quickly diagnose query performance issues on Spanner. Using Query Insights, users can now troubleshoot query performance in a self-serve way. We’ve designed Query Insights using familiar design patterns with world-class visualizations to provide an intuitive experience for anyone who is debugging issues with query performance on Spanner. Query Insights is available at no additional cost.
By using out-of-the-box visual dashboards and graphs, developers can visualize aberrant behavior like peaks and troughs in various performance metrics over a time-series and quickly identify problematic queries. Time series data provides significant value to organizations because it enables them to analyze important real-time and historical metrics. Data is valuable only if it’s easy to comprehend;. that’s where being able to view intuitive dashboards becomes a force multiplier for organizations looking to expose their time series data across teams.
Follow a visual journey with pre-built dashboards
With Query Insights, developers can seamlessly move from detection of database performance issues to diagnosis of problematic queries using a single interface. Query Insights will help identify query performance issues easily with pre-built dashboards.
The user could do this by following a simple journey where they can quickly confirm, identify and analyze query performance issues. Let’s walk through an example scenario.
Understand database performance
This journey will start by the user setting up an alert on Google Cloud Monitoring for CPU utilization going above a certain threshold. The alert could be configured in a way that if this threshold is crossed, the user will be notified with an email alert, with a link to the “Monitoring” dashboard.
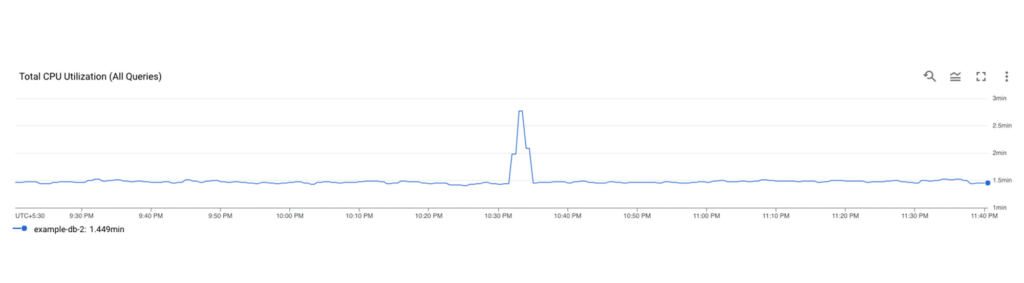
Once the user receives this alert, they would click on the link in the email, and navigate to the “Monitoring” dashboard. If they observe high CPU Utilization and high read latencies, the possible root cause could be expensive queries. A spike in CPU Utilization could be a strong signal that the system is using more compute than it usually would, due to an inefficient query.
The next step is to identify which query might be the problem, this is where Query Insights comes in. The user can get to this tool by clicking on Query Insights in the left navigation of your Spanner Instance. Here, they can drill down into the CPU usage by query and observe that for a specific database, CPU Utilization (attributed to all queries) is spiking for a particular time window. This confirms that the CPU utilization is due to inefficient queries.
Identifying a problematic query
The user now observes the TopN (Top queries by CPU Utilization) query graph to see the TopN queries by CPU Utilization. From the graph, it is very easy to visualize and identify the top queries which could be causing the spike in CPU Utilization.
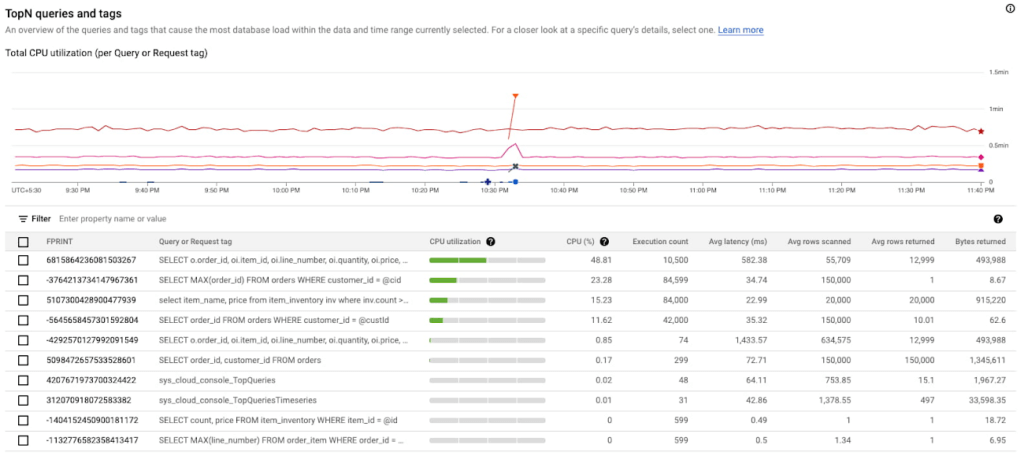
In the above screenshot, we can see that the first query in the table is showing a clear spike at 10:33 PM consuming 48.81% of total CPU. This is a clear indication that this query could be problematic, and the user should investigate further.
Analyzing the query performance
Once they have identified the problematic query, they can now drill down into this query shape to confirm, identify the root cause of the high CPU utilization.
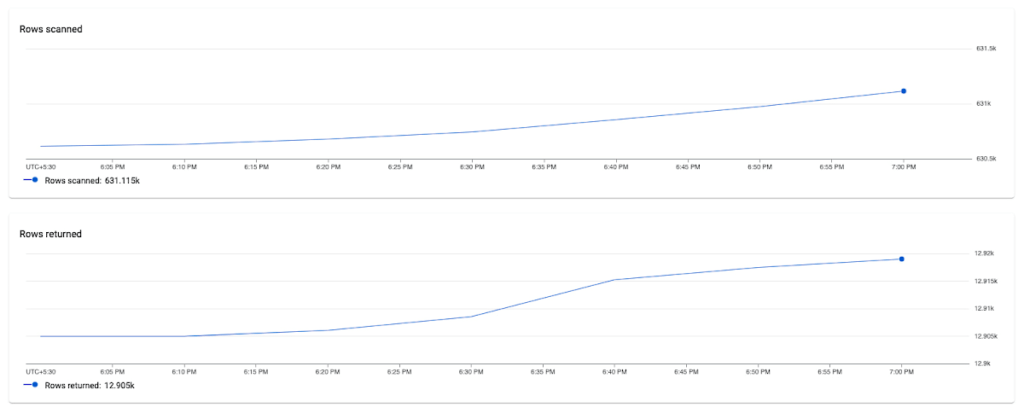
They can do this by clicking on the Fingerprint ID for the specific query from the topN table, and navigating to the Query Details page where they will be able to see a list of metrics (Latency, CPU Utilization, Execution count, Rows Scanned / Rows Returned) over a time series for that specific query.
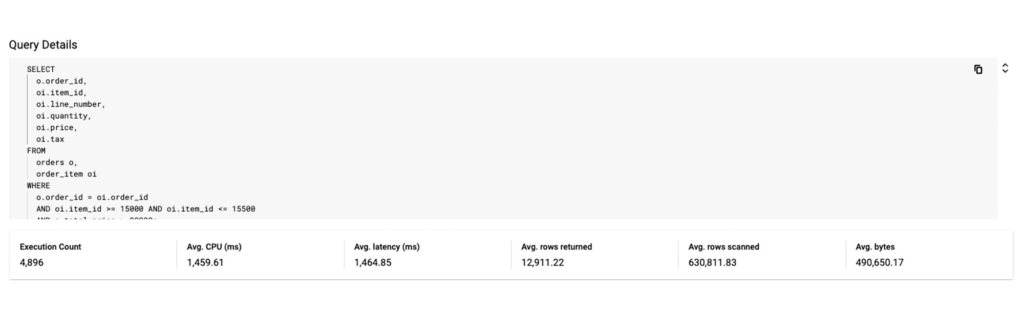
In this example, we notice that the average number of rows scanned for this specific query are very high (~ 600k rows scanned to return ~ 12k rows), which could point to a poor query design, resulting in an inefficient query. We can also observe that latency is high (1.4s) for this query.
Fixing the issue
To fix the problem in this scenario, the user could optimize this query by specifying a secondary index in the query using a FORCE_INDEX query hint to provide an index directive. This would provide more consistent performance, make the query more efficient, and lower CPU utilization for this query.
In the screenshot below, you can see that after specifying the index in the query, the query performance dramatically increases in terms of CPU, rows scanned (54K vs 630k) and also in terms of query latency (536 ns vs 1.4 s).
Unoptimized Query:
Optimized Query:
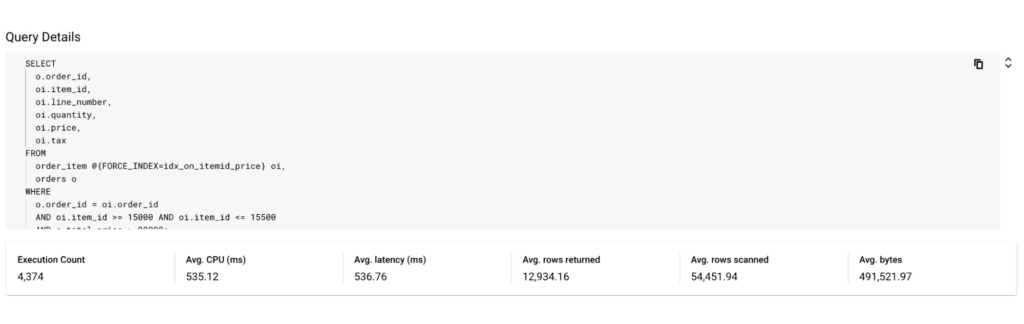
By following this simple visual journey, the user can easily detect, diagnose and debug inefficient queries on Spanner.
Get started with Query Insights today
To learn more about Query Insights, review the documentation here. Query Insights is enabled by default. In the Spanner console, you can click on Query Insights in the left navigation and start visualizing your query performance metrics!
New to Spanner? Get started in minutes with a new database.
Migrating Hadoop to Dataproc by LiveRamp: Best Practices

2876
Of your peers have already read this article.
3:30 Minutes
The most insightful time you'll spend today!
Abstract
In this blog, we describe our journey to the cloud and share some lessons we learned along the way. Our hope is that you’ll find this information helpful as you go through the decision, execution, and completion of your own migration to the cloud.
Introduction
LiveRamp is a data enablement platform powered by identity, centered on privacy, integrated everywhere. Everything we do centers on making data safe and easy for businesses to use. Our Safe Haven platform powers customer intelligence, engages customers at scale, and creates breakthrough opportunities for business growth.
Businesses safely and securely bring us their data for enrichment and use the insights gained to deliver better customer experiences and generate more valuable business outcomes. Our fully interoperable and neutral infrastructure delivers end-to-end addressability for the world’s top brands, agencies, and publishers. Our platforms are designed to handle the variability and surge of the workload and guarantee service-level agreements (SLAs) to businesses.
We process petabytes of batch and streaming data daily. We ingest, process (join and enhance), and distribute this data. We receive and distribute data from thousands of partners and customers on a daily basis. We maintain the world’s largest and most accurate identity graph and work with more than 50 leading demand-side and supply-side platforms.
Our decision to migrate to Google Cloud and Dataproc
As an early adopter of Apache Hadoop, we had a single on-prem production managed Hadoop cluster that was used to store all of LiveRamp’s persistent data (HDFS) and run the Hadoop jobs that make up our data pipeline (YARN). The cluster consisted of around 2500 physical machines with a total of 30PB or raw storage, ~90,000 vcores, and ~300TB of memory. Engineering teams managed and ran multiple MapReduce jobs on these clusters.
The sheer volume of applications that LiveRamp ran on this cluster caused frequent resource contention issues, not to mention potentially widespread outages if an application was tuned improperly. Our business was scaling and we were running into constraints related to data center space and power in our on-premises environment. These constraints restricted our ability to meet our business objectives so a strategic decision was made to leverage elastic environments and migrate to the cloud. The decision required financial analysis and a detailed understanding of the available options, from do-it-yourself and vendor-managed distributions to leveraging cloud-managed services.
LiveRamp’s target architecture
We ultimately chose Google Cloud and Dataproc, a managed service for Hadoop, Spark, and other big data frameworks. During the migration we made a few fundamental changes to our Hadoop infrastructure:
Instead of 1 large persistent cluster managed by a central team, we have decentralized the cluster ownership to individual teams. This gave the teams flexibility to recreate, perform upgrades or change configurations as they see fit. This also gives us better cost attribution, less blast radius for errors, and less chance that – a rogue job from one team will impact the rest of the workloads.
Persistent data is no longer stored in HDFS on the clusters, it is in Google Cloud Storage, which, conveniently, served as a drop in replacement, as GCS is compatible with all the same APIs as HDFS. This means we can delete all the virtual machines that are part of the cluster without losing any data.
Introduced autoscaling clusters to control compute cost, and to dramatically decrease request latency. On premise you’re paying for the machines so you might as well use them. Cloud compute is elastic so you want to burst when there is demand and scale down when you can.
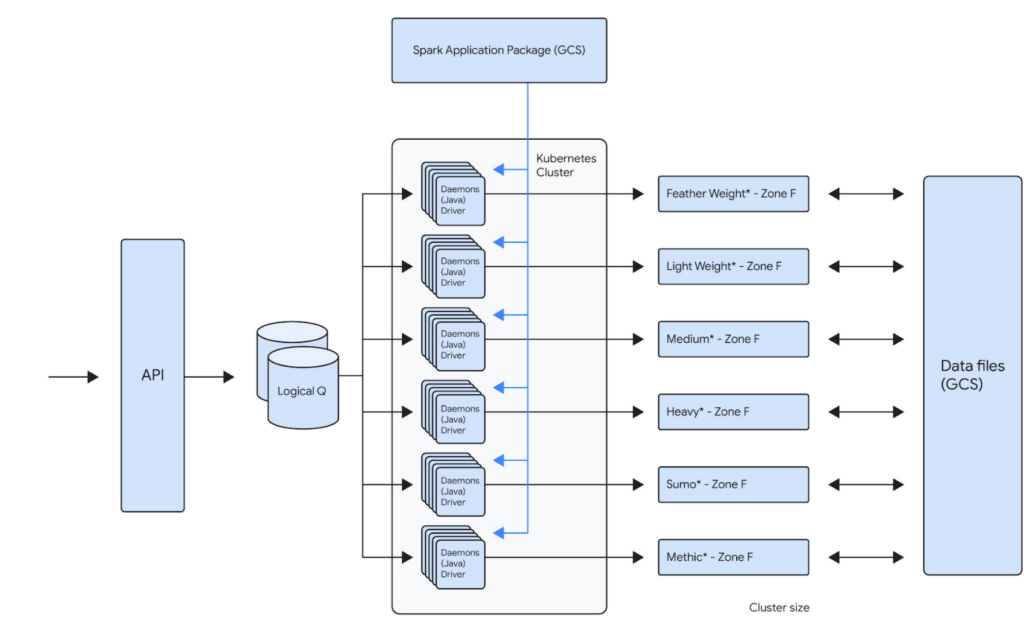
For example, one of our teams runs about 100,000 daily Spark jobs on 12 Dataproc clusters that each independently scale up to 1000 VMs. This gives that team a current peak capacity of about 256,000 cores. Because the team is bound to its own GCP Project inside of a GCP Organization, the cost attributed to that team is now very easy to report. The team uses architecture represented below to distribute the jobs across the clusters. This architecture allows them to bin similar workloads together so that they can be optimized together. Below is the logical architecture of the above workload:
Our approach
Overall migration and post migration stabilization/optimization of the largest of our workloads took us about several years to complete. We broadly broke down the migration into multiple phases.
Initial Proof-Of-Concept
When analyzing solutions for cloud-hosted big data services, any product had to meet our clear acceptance criteria:
- Cost: Dataproc is not particularly expensive compared to similar alternatives, but our discount with the existing managed Hadoop partner made it expensive. We have initially accepted that the cost would remain the same. We did see cost benefits post migration, after several rounds of optimizations.
- Features: Some key features (compared to current state) that we were looking for are built-in autoscaler, ease of creating/updating/deleting clusters, managed big data technologies etc.
- Integration with GCP: As we had already decided to move other LiveRamp-owned services to GCP, a big data platform with robust integration with GCP was a must. Basically, we’d like to be able to leverage GCP features without a lot of effort on our end (custom vms, preemptible vms, etc).
- Performance: Cluster creation, deletion, scale up, and scale down should be fast. This will allow teams to iterate and react quickly. These are some rough estimates of how fast the cluster operations should be:
- Cluster creation: <15 minutes
- Cluster Deletion: <15 minutes
- Adding 50 nodes: <20 minutes
- Removing 200 nodes: <10 minutes
- Reliability: Bug free and low downtime software that has concrete SLAs on clusters and a strong commitment to the correct functioning of all of its features.
An initial prototype to better understand Dataproc and Google Cloud helped us prove that target technologies and architecture will give us reliability and cost improvements. This also fed into our decisions around target architecture. This was then reviewed by the Google team before we embarked on the migration journey.
Overall migration
Terraform module
Our ultimate goal is to create self-service tooling that allows our data engineers to deploy infrastructure as easily and safely as possible. After defining some best practices around cluster creation and configuration, the central team’s first step was to build a terraform module that can be used by all the teams to create their own clusters. This module will create a dataproc cluster along with all supporting buckets, pods and datadog monitors:
- A dataproc cluster autoscaling policy that can be customized
- A dataproc cluster with LiveRamp defaults preconfigured
- Sidecar applications for recording job metrics from the job history server and for monitoring the cluster health
- Pre configured datadog cluster health monitors for alerting
This Terraform module is also composed of multiple supporting modules underneath. This allows users to call the supporting modules directly in your project terraform as well if such a need arises. The module can be used to create a cluster by just setting the parameters like project id, path to application source (Spark or Map/Reduce), subnet, VM instance type, auto scaling policy etc.
Workload migration
Based on our analysis of Dataproc, discussions with GCP team and the POC, we used following criteria:
- We prioritized applications that can use preemptibles to achieve cost parity to our existing workloads
- We prioritized some of our smaller workloads initially to build momentum within the organization. For example, we left the single workload that accounted for ~40% of our overall batch volume to the end, after we had gained enough experience as an organization.
- We combined the migration to Spark along with the migration to Dataproc. This has initially resulted in some extra dev work but helped reduce the effort for testing and other activities.
Our initial approach was to lift and shift from existing managed providers and Map/Reduce to Dataproc and Spark. We then later focused on optimizing the workloads for cost and reliability.
What’s working well
Cost Attribution
As is true with any business, it’s important to know where your cost centers are. Moving from a single cluster, made opaque by the number of teams loading work onto it, to GCP’s Organization/Project structure has made cost reporting very simple. The tool breaks down cost by project, but also allows us to attribute cost to a single cluster via tagging. As we sometimes deploy a single application to a cluster, this helps us to make strategic decisions on cost optimizations at an application level very easily.
Flexibility
The programmatic nature of deploying Hadoop clusters in a cloud like GCP dramatically reduces the time and effort involved in making infrastructure changes. LiveRamp’s use of a self-service Terraform module means that a data engineering team can very quickly iterate on cluster configurations. This allows a team to create a cluster that is best for their application while also adhering to our security and health monitoring standards. We also get all the benefits of infrastructure as code: highly complicated infrastructure state is version controlled and can be easily recreated and modified in a safe way.
Support
When our teams face issues with services that run on Dataproc, the GCP team is always quick to respond. They work very closely with LiveRamp to develop new features for our needs. They proactively provide LiveRamp with preview access to new features that help LiveRamp to stay ahead of the curve in the Data Industry.
Cost Savings
We have achieved around 30% cost savings in certain clusters by achieving the right balance between on-demand and PVMs. The cost savings were a result of our engineers building efficient A/B testing frameworks that helped us run the clusters/jobs in several configurations to arrive at the most reliable, maintainable and cost efficient configuration. Also, one of the applications is now 10x + faster.
Five lessons learned
Migration was a successful exercise that took about six months to complete, across all our teams and applications. While many aspects went really well, we also learned a few things along the way that we hope will help you when planning your own migration journey.
- Benchmark, benchmark, benchmark
It’s always a good idea to benchmark the current platform against the future platform to compare costs and performance. On-premises environments have a fixed capacity, while cloud platforms can scale to meet workload needs. Therefore, it’s essential to ensure that the current behavior of the key workload is clearly understood before the migration.
- Focus on one thing at a time
We initially focused on reliability while remaining cost-neutral during the migration process, and then focused on cost optimization post-migration. Google teams were very helpful and instrumental in identifying cost optimization opportunities.
- Be aware of alpha and beta products
Although there usually aren’t any guarantees of a final feature set when it comes to pre-released products, you can still get a sense of their stability and create a partnership if you have a specific use case. In our specific use case, Enhanced Flexibility Mode was in alpha stage in April 2019, beta in August 2020, and released in July 2021. Therefore, it was helpful to check in on the product offering and understand its level of stability so we could carry out risk analysis and decide when we felt comfortable adopting it.
- Think about quotas
Our Dataproc clusters could support much higher node counts than was possible with our previous vendor. This meant we often had to increase IP space and change quotas, especially as we tried out new VM and disk configurations.
- Preemptable and committed use discounts (CUDs)
CUDs make compute less expensive while preemptables make compute significantly less expensive. However, preemptibles don’t count against your CUD purchases, so make sure you understand the impact on your CUD utilization when you start to migrate to preemptables.
We hope these lessons will help you in your Data Cloud journey.

Customer Voices: How Firms from Across Industries Leverage Google Cloud
DOWNLOAD CASE STUDY14083
Of your peers have already downloaded this article
1:30 Minutes
The most insightful time you'll spend today!
From powering everyday operations and accelerating application innovation, to providing tools for specific business needs and executing on big ideas, to advancing the security of technology solutions, companies from across industries have leveraged Google Cloud for business benefits.
Companies from across industries have turned to Google Cloud for transforming their business, modernizing their infrastructure, and gleaning intelligence from data. For instance:
- Johnson & Johnson achieved a 41% increase in search results from high-quality job applicants, significantly improving the company’s ability to quickly hire top talent.
- Sony Network Communications now processes 10 billion monthly queries faster, which advances data analysis.
- University College Dublin saw significant 6-figure savings by eliminating legacy hardware, software, and maintenance.
And there are many such examples. Read the collection of case studies to find out how companies from across industries and geographies leveraged Google Cloud for measurable business benefits and for solving complex problems.
6795
Of your peers have already watched this video.
2:30 Minutes
The most insightful time you'll spend today!
What is BigQuery?
BigQuery is Google Cloud’s enterprise data warehouse designed to help you ingest, store, analyze, and visualize big data with ease.
Organizations rely on data warehouses to aggregate data from disparate sources, process it, and make it readily available for data analysis that supports their strategic decision-making.
You can ingest data into BigQuery either through batch uploading or streaming data directly to deliver real-time insights.
As a fully-managed data warehouse, Google takes care of the infrastructure so you can focus on analyzing your data up to petabyte scale.
BigQuery supports the same Structured Query Language, or SQL, for analyzing your data, which you may be familiar with if you’ve worked with ANSI-compliant relational databases in the past.
If you’re looking to create machine learning models using your enterprise data, you can do so with BigQuery ML.
With only a few lines of SQL, you can train and execute models on your BigQuery data without needing to move it around.
When it comes time to visualize your data, BigQuery integrates with Looker, as well as several other business intelligence tools across our partner ecosystem.
Now, how do you use BigQuery?
Luckily, it’s straightforward to get up and running with BigQuery.
After creating a GCP project, you can immediately start querying public data sets, which Google Cloud hosts and makes available to all BigQuery users, or you can load your own data into BigQuery to analyze.
Interacting with BigQuery to load data, run queries, or even create ML models can be done in three different ways.
First is by using the UI and the Cloud Console. Second is by using the BigQuery command line tool. And third is by making calls to the BigQuery API, using client libraries available in several languages.
BigQuery is integrated with Google Cloud’s Identity and Access Management Service so you can securely share your data and analytical insights across the organization.
What does it cost to use BigQuery?
With BigQuery, you pay for storing and querying data and streaming inserts.
Loading and exporting data are free of charge.
Storage costs are based on the amount of data stored and have two rates based on how often the data is changing.
Query costs can be either on demand, meaning you are charged per query by the amount of data processed, or flat rate for customers who want to purchase dedicated resources.
Unlocking the Potential of Advanced Analytics with BigQuery and Connected Vehicle Data

2865
Of your peers have already read this article.
2:30 Minutes
The most insightful time you'll spend today!
As software-defined vehicles continue to advance and the quantity of digital services grows to meet consumer demand, the data required to provide these services continue to grow as well. This makes automotive manufacturers and suppliers look for capabilities to log and analyze data, update applications, and extend commands to in-vehicle software.
The challenges the automotive sector faces can be quantified. A modern vehicle contains upwards of 70 electronic control units (ECUs), most of which are connected to one or more sensors. Not only is it now possible to exactly measure many aspects of vehicle performance, but new options become available. Using LIDAR (light detection and ranging), for example, vehicles are achieving higher levels of autonomy; this leads to a data stream from such demanding applications that may reach 25 GB per hour. For the in-vehicle processing of data, 100 million lines of software code may be present — more than a fighter jet. This in-vehicle code will have to be maintained with updates and new functionalities.
Access to the data will allow manufacturers to gain valuable insights into operational details of their vehicles. The use of this data can help to reduce costs and risks, increase ROI, support ESG initiatives, and provide valuable insights to develop innovative solutions and shorten the time to value for Electric Vehicle innovations.
Sibros’ Deep Connected Platform (DCP) makes it possible for these manufacturers to build and launch new connected vehicle use cases from production to post-sale at scale by connecting and managing all software and data throughout every life cycle stage. A key component of this platform is the Sibros Deep Logger that provides capabilities like the following:
- Full configurability of what to record, when to record it, and how fast to record it.
- High resolution timestamps of all Controller Area Network (CAN) messages.
- Dynamic application of live log configurations to receive new data points without deploying new software.
For example, properly analyzed engine data enables true predictive maintenance for the first time, which creates the option to repair or replace components before failure happens. Another example would be the evaluation of data regarding the use of certain in-car features with the goal to redesign its interior.
Two other components of the DCP are software updates and remote commands to ECUs. The DCP on Google Cloud enables seamless integration with any vehicle architecture and provides OEMs and suppliers with the platform to manage connected vehicle data at rest and in transit using a proven and secure way on a global scale.
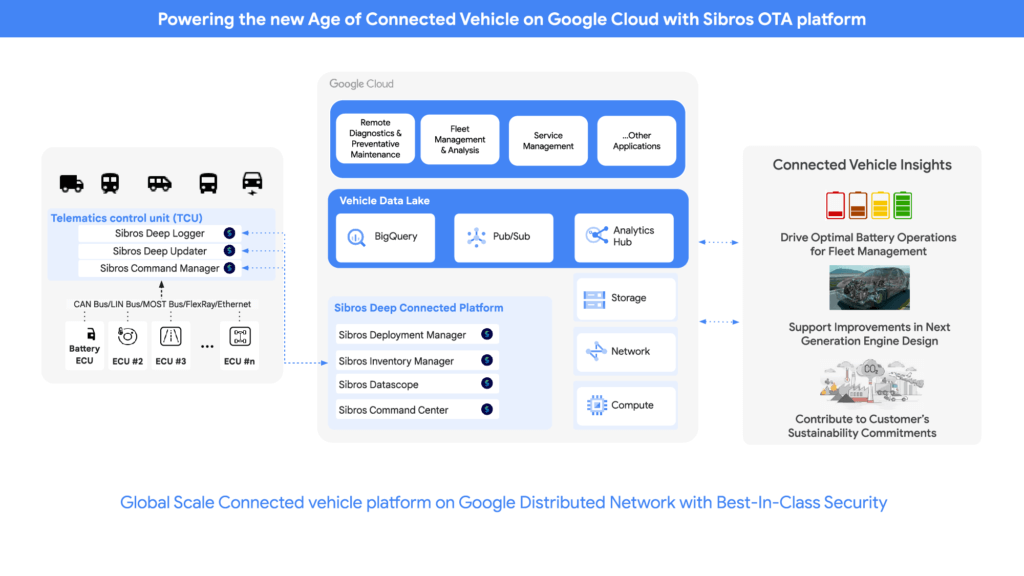
OEMs can pull data through APIs provided by Sibros into Google Data Cloud (including BigQuery) to gain access to the rich information data sets provided by the DCP within their environment and blend this data with their first party data sets to provide value insights for their business. Some of the Connected Vehicle insights that DCP information enables are:
- Damage prevention, improved operation, or development of the next generation of engines with insights from complex analyses that could consider parameters like model, engine type, mileage, overall speed, temperature, air pressure, load, services, and more.
- The combination of electric vehicle battery usage data like charging cycles, engine performance, and battery age with contributing factors as the use of the air conditioning to determine if such factors contribute to hazardous battery conditions and for improved battery development.
- Cross-organization collaboration in R&D by the provision of information on all these metrics and more from real-world driving, like engine knock data and even tire pressure.
- Google Cloud’s unified data cloud offering provides a complete platform for building data-driven applications like those from Sibros — from simplified data ingestion, processing, and storage to powerful analytics, AI, ML, and data sharing capabilities — integrated with Google Cloud. With a diverse partner ecosystem and support for multi-cloud, open-source tools and APIs, Google Cloud provides Sibros the portability and the extensibility they need to avoid data lock-in.
“Software has an ever increasing importance in the automotive world, even more so with electric vehicles and new mobility services. Google Cloud is partnering with Sibros to bring their award winning Deep Connected Platform to deliver high frequency, low latency over-the-air software updates, data logging & diagnostics capabilities to our automotive customers, leveraging the security and scale of Google Cloud. This is revolutionizing everything from development cycles to business models and customer relationships.” — Matthias Breunig, Director, Global Automotive Solutions, Google Cloud
Through Built with BigQuery, Google Cloud is helping tech companies like Sibros build innovative applications on Google’s Data Cloud with simplified access to technology, helpful and dedicated engineering support, and joint go-to-market programs.
“Sibros is looking forward to partnering with Google Cloud, which will enable vehicle manufacturers and suppliers to reach the next level in their use of data. Sibros solutions for Deep Data Logging and Updating on the Google Data Cloud, combined with Google BigQuery, will help them to mitigate risks, reduce costs, add innovative products, and introduce value-added use cases.” — Xiaojian Huang, Chief Digital Officer, Software, Sibros
Sibros and Google Cloud are driving Connected Mobility transformation to help our customers accelerate R&D innovation, power efficient operations, and unlock software-defined vehicle use cases with a full stack connected vehicle platform. Click here to learn more about Sibros on Google Cloud.
Wayfair Writes its Success Story with BigQuery for Internal Analytics

4931
Of your peers have already read this article.
4:00 Minutes
The most insightful time you'll spend today!
Editor’s note: Home-goods and furniture giant Wayfair first partnered up with Google Cloud to transform and scale its storefront—work that proved its value many times over during the unprecedented surge in ecommerce traffic during 2020. Today, we hear how BigQuery’s performance and cost optimization have transformed the company’s internal analytics to create an environment of “yes”.
At Wayfair, we have several unique challenges relating to the scale of our product catalog, our global delivery network, and our position in a multi-sided marketplace that supports both our customers and suppliers. To give you a sense of our scale we have a team of more than 3,000 engineers with tens of millions of customers. We supply more than 20 Million items using more than 16,000 supplier partners.
Serving those constituents generates a lot of analytics work. Wayfair runs over a billion ‘analytic’ database queries a year, from both humans and systems, against multi-petabyte datasets. Scaling our previous environment to meet these challenges required us to maintain dozens of copies of data for different use cases and manage complex data synchronization routines to move trillions of records each day, resulting in long development times and high support costs for our analytics projects.
Centralizing our data using Cloud Storage and BigQuery enabled us to break down existing silos and build unified pipelines for our batch and real-time operations. BigQuery shines by letting us decouple our compute and storage resources and flexibly ingest structured data in streaming and batch modes. We also benefit from the same decoupling for more complicated machine learning (ML) workflows in Dataproc and Cloud Storage. In particular, BigQuery is extremely low maintenance. From ML and easy data integrations to the integrated query cache, many out-of-the-box features have proven valuable for multiple use cases.
Beyond storage and compute, Google Cloud offers multiple tools to maximize the value of our data. For example, we can easily connect Data Studio to BigQuery for lightning-fast dashboarding of enterprise KPI reporting. When we need to dive deeper into a metric, Looker provides an interface and semantic model that empowers more business users to answer important questions — without understanding SQL or our vast dataset and table structure.
The combination of all of Google Cloud’s tools enables every Wayfairian the opportunity to self-serve their data visualization and analysis needs. We are able to support all of the requirements of our internal and external users, from descriptive analytics to alerting and ML, in a platform that blends Google’s proprietary technology with open-source standards.we have seen a greater than 90% reduction in the number of analytic queries in production that take more than one minute to run
As a result, we have seen a greater than 90% reduction in the number of analytic queries in production that take more than one minute to run, which delights our users and increases adoption of our analytics tools across the business.
Higher performance means saying “Yes” more often
We went into the BigQuery experience expecting very strong performance on large, aggregate queries and excellent scalability — the kind of performance that could enable consistent 5-15 minute processing queries and 5-10 second response times for large analytics queries.
We weren’t disappointed — we saw slightly better than linear performance profiles as record counts went up from millions to trillions for a flat resource allocation. BigQuery had the expected high performance for aggregate queries. This made our large data processing pipelines predictable and straightforward to maintain and optimize.
Below is a plot of gigabytes processed by a query against query run time in seconds; outliers are filtered and the axes are pruned to ranges where we had a large sample size. This focuses on longer-duration queries. As an example of the linear performance, a 2 terabyte query averages 5 minutes — 2.5min/terabyte — and an 18 terabyte query (9 times as much data) averages 25s — only 1.4min/terabyte. This is despite the fact that complex queries [sorting and analytic functions are particularly problematic] are more common with large data sizes. We do see increasing variability at large sizes as slot limits and other resource constraints come into play, but these factors are controllable and ultimately a business optimization decision.
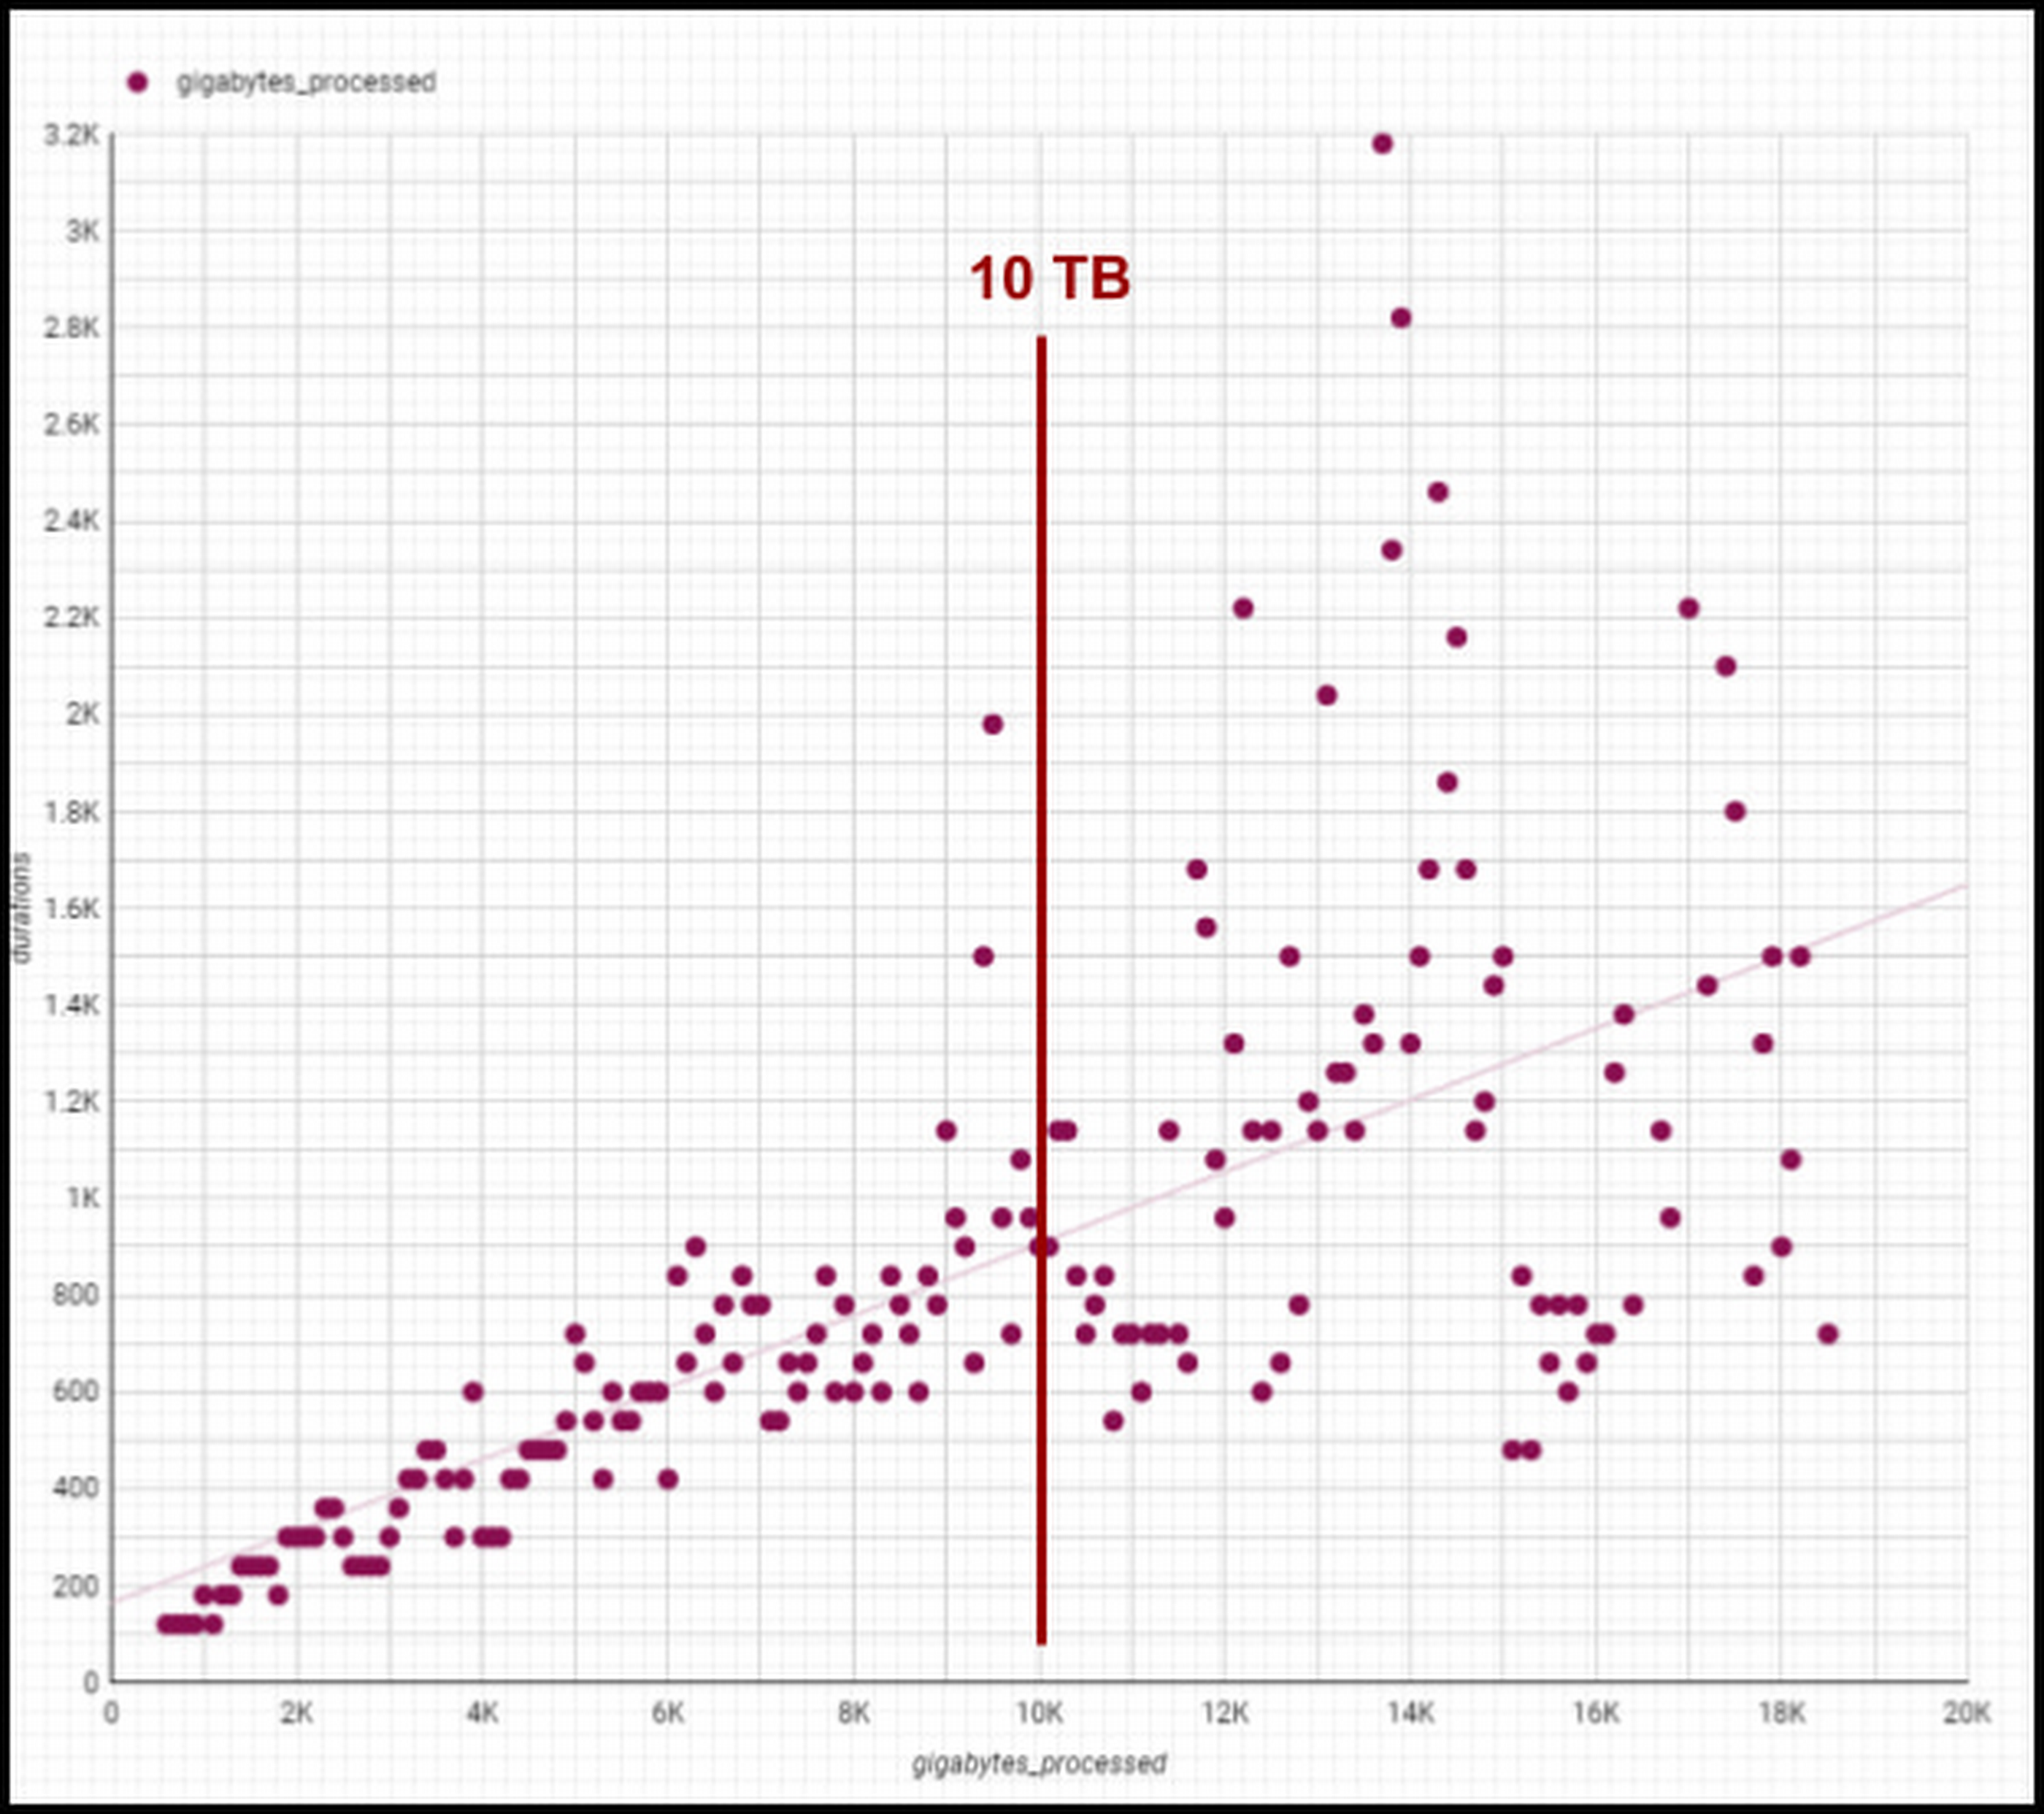
Though individual values vary greatly depending on query complexity [analytic functions/sorting can be computationally expensive], the overall trend line is below 1-1 for bytes versus duration, meaning our BigQuery query runtimes are increasing slower than our data volumes. We are still seeing sub 1:1 threshold runtimes, and we’re already at 100 PB of total data with single queries running on 50PB or more. Going strong!
One unexpected and pleasant surprise has been high performance for smaller queries, such as those required for development, interactive analytics, and internal applications we use for forecasting, segmentation, and other latency-sensitive data workflows. BigQuery’s resource management systems have provided smoother degradation and parallelism profiles than we initially expected for a multi-tenant platform.
We regularly see sub-second p50 query performance for interactive use cases, with p90 performance coming in under 10 seconds for Looker, Data Studio, and AtScale — meeting the threshold we set to avoid analysts losing focus during a business investigation. The chart below shows p50, p90, and p95 timing for core workloads, as well as the number of queries in each bucket and the number of unique users. [Looker and Atscale will use small numbers of service accounts for a large number of users].

This has enabled two important shifts in the way our customers experience analytics services:
- Delivering better user productivity. People no longer have long wait times to get results for a basic query delivering an improved overall user experience.
- Scaling our data transformation. BigQuery has proven, effective data transformation that allows us to embrace the industry shift away towards ELT (extract, load, transform) to transform raw data right within the database.
We no longer have to ask ourselves, “Can we meet the SLA for this data processing task?” The new conversation is, “Of course, we can meet it. What’s the associated cost based on how many resources we assign?” We can make cost and resource trade-offs clear to our users and say “yes” more often to requirements that have measurable business value.
Supporting cost vs. performance decisions
Democratized access to internal analytics is a powerful decision-making tool. With BigQuery’s robust tooling, the decision about how to best allocate computational resources is in the hands of the analytics groups closest to the business decision being made. If they want to spend a sprint optimizing a dashboard, they can show exactly how much money it will save. If they choose not to optimize a report, they can offset the decision with concrete cost savings and other realized value.
Wayfair teams also benefit from visibility into their committed costs by abstracting away the details of the underlying services, including BigQuery slots, the virtual CPUs used to execute SQL queries.
Take a look at this example view consumed by our teams (the metrics for these dashboards are from the BigQuery INFORMATION_SCHEMA (jobs and reservations tables):
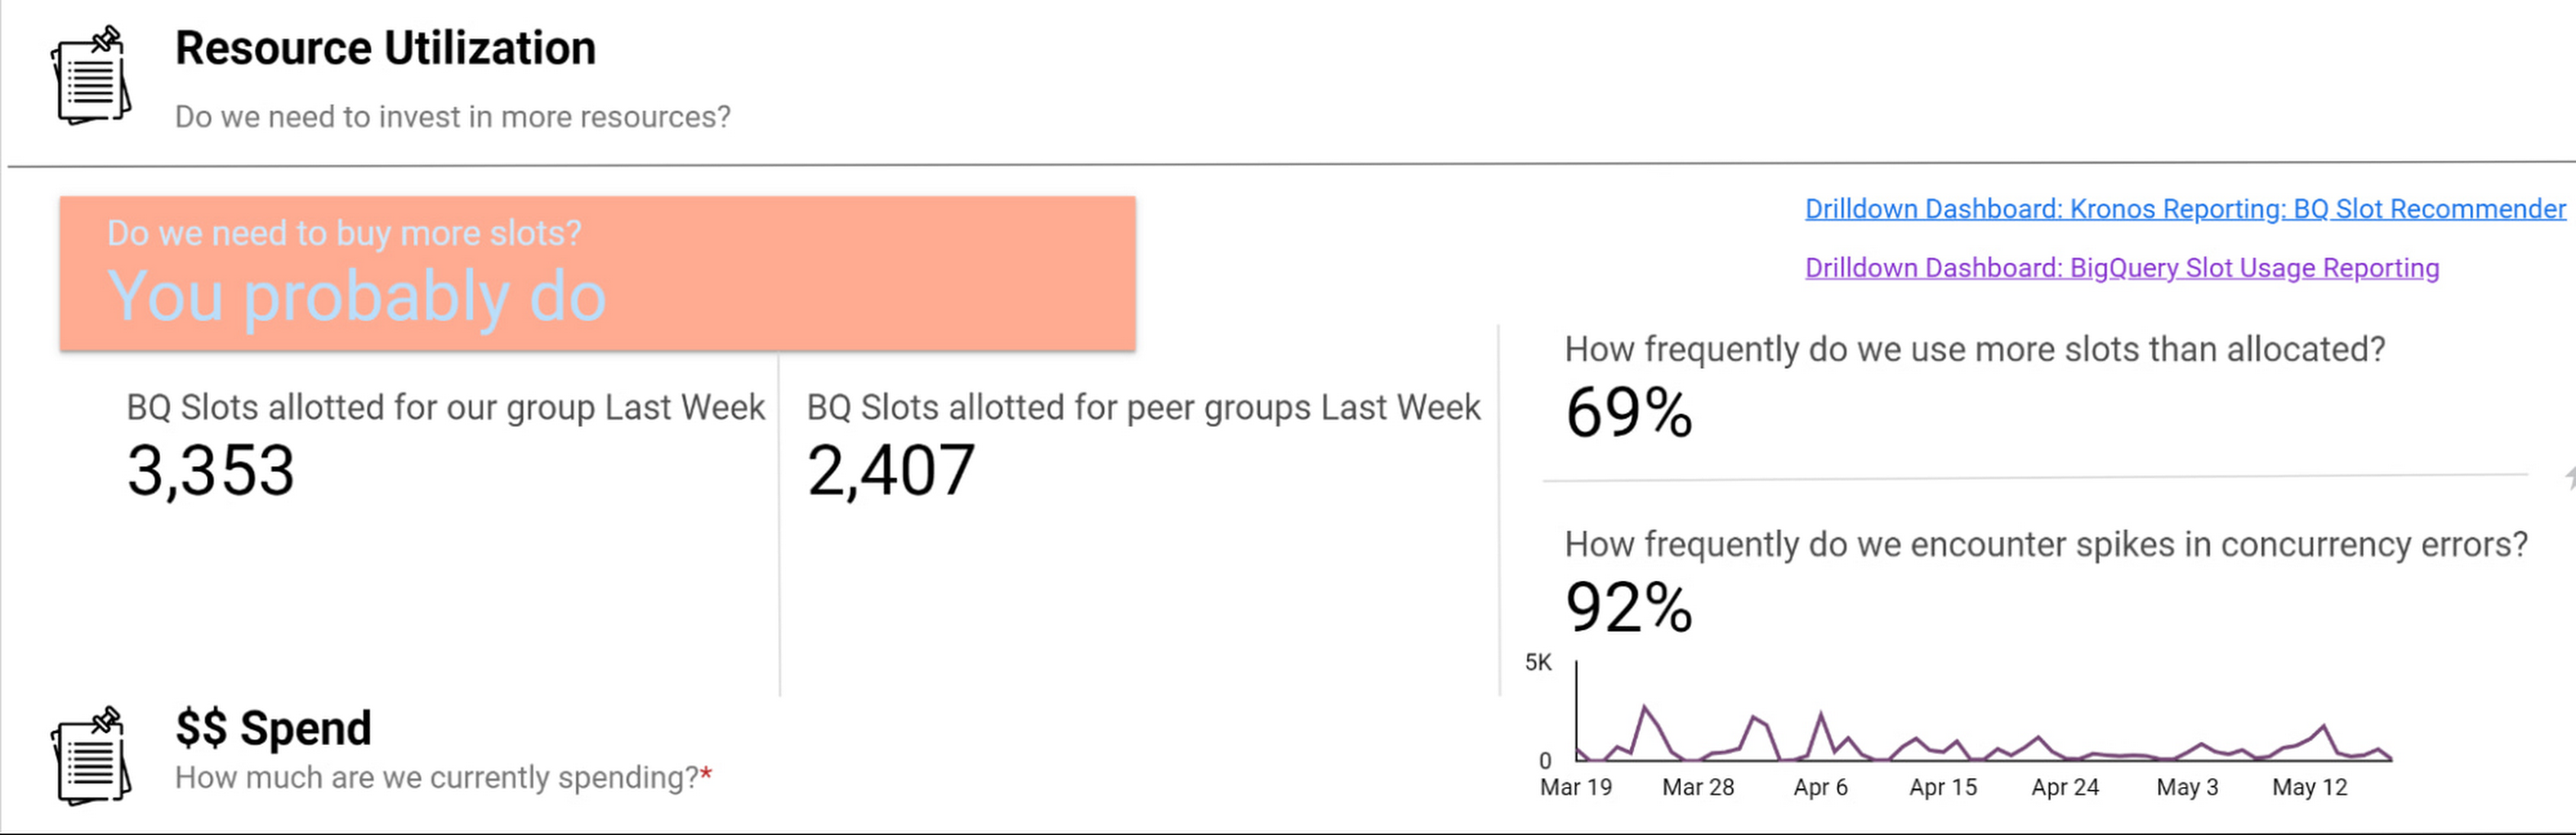
Suppose an organization wants to purchase capacity for a period of time. In that case, we provide an average cost for a slot during that time and charge them based on their slot usage for queries, multiplied by the average price.
Teams can see whether their consumption matches their reservations with a consistent, high-level number. We apply the same approach to tools like Dataproc by aggregating up the costs of component services and providing an organizational cost for those services.
How we use performance signals to improve user efficiency
Instead of overcorrecting for occasional performance fluctuations by allocating excessive resources, we try to align incentives so that people make the right choices for the business. Showback doesn’t work in a vacuum — it requires context and integrated insights. Teams need to show the cost of running a dashboard as well as the ROI is in terms of end user engagement and what peer dashboards with equivalent source datasets might cost.
We want to give users the freedom to do things the way they want and need to while also educating them on achieving their goals and using best practices to reduce their costs and improve their performance. The goal is never for all dashboards to load “less than x seconds” — we believe that any dashboard can load in x seconds when it is properly designed and resourced.
For instance, BigQuery allocates slots for a new workload quickly and efficiently, and queries that are optimized and have dedicated resources consistently complete quickly. When users experience a slowdown, it’s typically because they are sharing resources or inefficiently using their resources. Variable performance is a useful signal to help users discover opportunities to optimize queries and work more productively. We value these signals as we like to focus on the aggregate experience of all users interacting with the tool, not individual interaction.
A natural way to improve user efficiency is to reward ideal behaviors and discourage those that do not align with our analytics strategy. Some examples include splitting out high-demand reporting from ad-hoc exploration to reduce concurrency errors or encouraging people to use materialized tables instead of writing complex custom SQL. For instance, a dedicated reporting project might only include an organization’s Data Studio dashboard if it directly references a table or meets other optimization requirements. Using this approach, we give our users a high degree of freedom and experimentation at the entry-level while providing a well-documented path to scale.
Visibility into query performance improves business performance
The detailed tracking information we get from Google Cloud products is critical — Google’s robust analytics performance has enabled us to scale Data Studio to over 15,000 Wayfarians. Of course, a larger user base always comes with concerns that less sophisticated users may not appropriately optimize their queries or make the best use of the infrastructure.
Evaluating the different Data Studio dashboards helps us identify opportunities to use better query optimization practices, such as reducing custom queries, connecting directly to permanent tables, or using the BI Engine to improve dashboard performance. Recently, our team built new billing projects specific for Data Studio reporting. We can scale up a reservation dedicated to reporting about a major sales event in minutes.
Beyond everyday reporting, holidays and sales events may require higher, guaranteed performance. BigQuery’s flexible capacity commitments allow us to decide at a business level whether an urgent need requires us to reprioritize resources immediately or whether we have the time to optimize queries and rebuild dashboards to be performant. These new billing projects let us evaluate if teams need to scale up resourcing, what areas they can optimize in BigQuery, or if a new reservation is needed to resource that team separately.
Recommendations for achieving high performance at low cost
Are you wondering how to allocate BigQuery slots? Teams must see direct, immediate return on their investment in performance and optimization.
Our first rule of thumb is to align resource utilization with ownership as closely as possible. This makes it easier for teams to secure dedicated resources, even if they start out small. We’re comfortable doing this because BigQuery dynamically reassigns capacity between the targeted reservation and other consumers in milliseconds. We always get the total usage of our slots — there is no wasted capacity even when we break assignments down granularly.
Once a team has a reservation, we provide reporting that consumes various BigQuery information schema views, such as query logs and reservation information, and processes it into aggregated reporting. We look for metrics like the average slots available to a query at a point in time, overall query performance, and how long queries took to execute to pinpoint the overall health of a reservation against our business objectives. Flex slots also let us experiment easily with additional capacity, and BigQuery’s performance is so consistent that we can use straightforward models to estimate return on additional slot investment.
Other key cost optimization tips we have found helpful at Wayfair include:
- Optimize for worst-case performance. Given BigQuery’s ability to share slots, we expect teams will often see much better performance, but we find that thinking it’s more effective when teams think about the most pessimistic case when resourcing their jobs.
- Take advantage of BI Engine reservations. We like to think critically about the data and workload. BI Engine reservations are excellent for workloads that query lots of small dimension tables or a few larger tables loaded into memory. In cases like that, such as with OLAP tools using pre-computed aggregates, we’ve seen BI engine investments drive a 25% reduction in average query time—excellent ROI.
- Leverage Looker for large, longitudinal datasets. Since Looker supports a wide range of use cases, we see a broader range of performance — p50 is still under a second, but p95 can get as high as a minute. For these cases, we recommend modeling user patterns [first of month, first day of week] and dynamically allocating more slots for these periods while deprioritizing batch workloads in the key windows.
- Lean in heavily on the BQ cache for broad-based reporting. To avoid a Monday morning reporting lag, We use the BigQuery cache to avoid Monday morning report loading lags. Up to 30% of our Data Studio queries hit the BQ cache, ensuring our Data Studio p95 consistently stays under 10 seconds.
- Use slots-per-job to improve experience. In our reporting, we find that the most valuable view is slots-per-job. We look for dips in slots available for jobs as this situation often correlates strongly with poor user experiences. For example, our reporting showed us that Looker has the highest volumes of queries and users on Mondays and during each month’s first two business days. We used this information to scale up slots to support these periods of highest demand, delivering on performance SLAs to support business users.

- Get a global picture of usage. We manage slots in a central tool. Teams input their requirements into a calendar to indicate when they want higher or lower capacity to inform our flex slot purchases and annual commitments. It might seem like dozens of relatively inconsistent workloads at the team level, but the picture changes when you look at demand across a week (or our entire business). Understanding global usage makes it easy for us to model baseline capacity recommendations for serving year slots versus flexible demands.
Reaping the rewards of BigQuery
From our first initial undertaking with Google Cloud to transform our storefront, we had a lot of confidence in the underlying technology offerings and the teams that ran them and their ability to meet our unique requirements. But our experience using BigQuery for internal analytics at Wayfair has exceeded our already high expectations.
BigQuery’s fast, dynamic allocation of resources and ability to transform data in place are important to our mission of maintaining consistently high performance for our users while closely managing costs. Moreover, our visibility into query and dashboard performance through BigQuery’s DSP views and other performance metrics have helped us make clearer connections between performance goals and the costs required to meet them — and guide our analysts across the company towards attaining high performance on every project.
More Relevant Stories for Your Company

Wunderkind Leverages Google Cloud to Address the Growing Needs of its Customer Base
Editor’s note: We’re hearing here how martech provider Wunderkind easily met the scaling demands of their growing customer base on multiple use cases with Cloud Bigtable and other Google Cloud data solutions. Wunderkind is a performance marketing channel and we mostly have two kinds of customers: online retailers, and publishers like

Google Leads the Pack in Big Data NoSQL Market: Forrester Research
NoSQL has become critical for all businesses to support modern business applications. It has gone from supporting simple schemaless apps to becoming a mission-critical data platform for large Fortune 1000 companies. It has already disrupted the database market, which was dominated for decades by relational database vendors. Today, half of

Revolutionizing Healthcare Operations with Data Engine Accelerators
Healthcare leaders are increasingly challenged to drive operational improvements throughout their facilities, and inefficiencies can cost organizations both time and money and impact patient outcomes. Additionally, staffing shortages and employee burnout remain a major concern in healthcare. Addressing these challenges can help healthcare providers improve organizational operations, patient experiences and

Enhancing Data Governance through Automation with Dataplex and BigLake
Unlocking the full potential of data requires breaking down the silo between open-source data formats and data warehouses. At the same time, it is critical to enable data governance team to apply policies regardless of where the data happens, whether - on file or columnar storage. Today, data governance teams
