





How to Decide Whether to Run a Database on Kubernetes
5608
Of your peers have already read this article.
3:30 Minutes
The most insightful time you'll spend today!
Today, more and more applications are being deployed in containers on Kubernetes—so much so that we’ve heard Kubernetes called the Linux of the cloud.
Despite all that growth on the application layer, the data layer hasn’t gotten as much traction with containerization. That’s not surprising, since containerized workloads inherently have to be resilient to restarts, scale-out, virtualization, and other constraints. So handling things like state (the database), availability to other layers of the application, and redundancy for a database can have very specific requirements. That makes it challenging to run a database in a distributed environment.
However, the data layer is getting more attention, since many developers want to treat data infrastructure the same as application stacks.
Operators want to use the same tools for databases and applications, and get the same benefits as the application layer in the data layer: rapid spin-up and repeatability across environments. In this blog, we’ll explore when and what types of databases can be effectively run on Kubernetes.
Before we dive into the considerations for running a database on Kubernetes, let’s briefly review our options for running databases on Google Cloud Platform (GCP) and what they’re best used for.
- Fully managed databases. This includes Cloud Spanner, Cloud Bigtable and Cloud SQL, among others. This is the low-ops choice, since Google Cloud handles many of the maintenance tasks, like backups, patching and scaling. As a developer or operator, you don’t need to mess with them. You just create a database, build your app, and let Google Cloud scale it for you. This also means you might not have access to the exact version of a database, extension, or the exact flavor of database that you want.
- Do-it-yourself on a VM. This might best be described as the full-ops option, where you take full responsibility for building your database, scaling it, managing reliability, setting up backups, and more. All of that can be a lot of work, but you have all the features and database flavors at your disposal.
- Run it on Kubernetes. Running a database on Kubernetes is closer to the full-ops option, but you do get some benefits in terms of the automation Kubernetes provides to keep the database application running. That said, it is important to remember that pods (the database application containers) are transient, so the likelihood of database application restarts or failovers is higher. Also, some of the more database-specific administrative tasks—backups, scaling, tuning, etc.—are different due to the added abstractions that come with containerization.
Tips for running your database on Kubernetes
When choosing to go down the Kubernetes route, think about what database you will be running, and how well it will work given the trade-offs previously discussed.
Since pods are mortal, the likelihood of failover events is higher than a traditionally hosted or fully managed database. It will be easier to run a database on Kubernetes if it includes concepts like sharding, failover elections and replication built into its DNA (for example, ElasticSearch, Cassandra, or MongoDB). Some open source projects provide custom resources and operators to help with managing the database.
Next, consider the function that database is performing in the context of your application and business. Databases that are storing more transient and caching layers are better fits for Kubernetes. Data layers of that type typically have more resilience built into the applications, making for a better overall experience.
Finally, be sure you understand the replication modes available in the database. Asynchronous modes of replication leave room for data loss, because transactions might be committed to the primary database but not to the secondary database(s). So, be sure to understand whether you might incur data loss, and how much of that is acceptable in the context of your application.
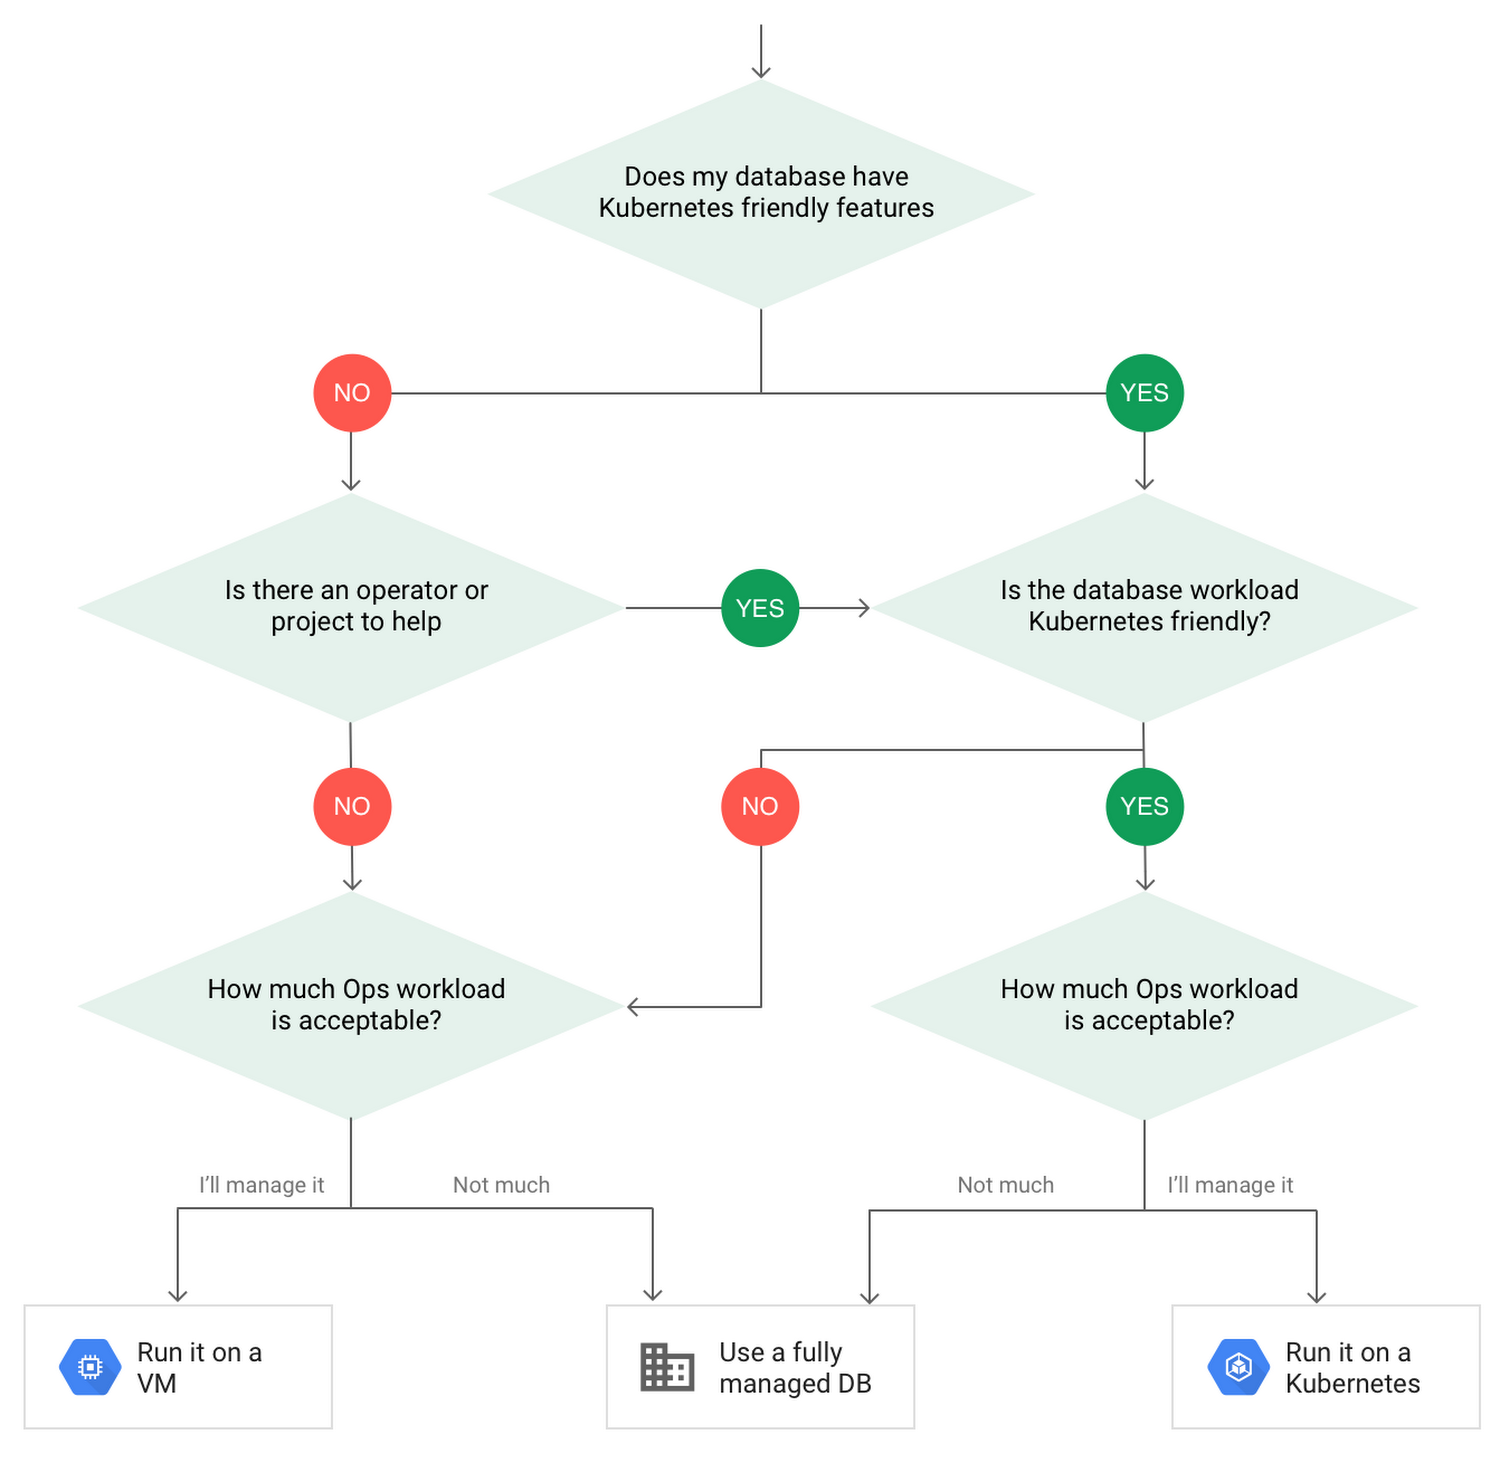
After evaluating all of those considerations, you’ll end up with a decision tree looking something like this:
How to deploy a database on Kubernetes
Now, let’s dive into more details on how to deploy a database on Kubernetes using StatefulSets.
With a StatefulSet, your data can be stored on persistent volumes, decoupling the database application from the persistent storage, so when a pod (such as the database application) is recreated, all the data is still there.
Additionally, when a pod is recreated in a StatefulSet, it keeps the same name, so you have a consistent endpoint to connect to. Persistent data and consistent naming are two of the largest benefits of StatefulSets. You can check out the Kubernetes documentation for more details.
If you need to run a database that doesn’t perfectly fit the model of a Kubernetes-friendly database (such as MySQL or PostgreSQL), consider using Kubernetes Operators or projects that wrap those database with additional features. Operators will help you spin up those databases and perform database maintenance tasks like backups and replication. For MySQL in particular, take a look at the Oracle MySQL Operator and Crunchy Data for PostgreSQL.
Operators use custom resources and controllers to expose application-specific operations through the Kubernetes API. For example, to perform a backup using Crunchy Data, simply execute pgo backup [cluster_name]. To add a Postgres replica, use pgo scale cluster [cluster_name].
There are some other projects out there that you might explore, such as Patroni for PostgreSQL. These projects use Operators, but go one step further. They’ve built many tools around their respective databases to aid their operation inside of Kubernetes. They may include additional features like sharding, leader election, and failover functionality needed to successfully deploy MySQL or PostgreSQL in Kubernetes.
While running a database in Kubernetes is gaining traction, it is still far from an exact science. There is a lot of work being done in this area, so keep an eye out as technologies and tools evolve toward making running databases in Kubernetes much more the norm.
When you’re ready to get started, check out GCP Marketplace for easy-to-deploy SaaS, VM, and containerized database solutions and operators that can be deployed to GCP or Kubernetes clusters anywhere.
Countries can Tackle Food Wastage Crisis Using Google’s Data Analytics

4975
Of your peers have already read this article.
4:00 Minutes
The most insightful time you'll spend today!
With over ⅓ of the food in the USA ending up as waste according to the USDA, it is a compelling challenge to address this travesty. What will happen to hunger, food prices, trash reduction, water consumption, and overall sustainability when we stop squandering this abundance?

Beginning with the departure from the farm to the back of the store, the freshness clock continues to run. Grocers work very hard to purchase high quality produce items for their customers and the journey to the shelf can take a toll in both quality and remaining shelf life. Suppliers focus on delivering their items through the arduous supply chain journey to the store with speed and gentle handling. The baton is then passed to the store to unload and present the items to customers with care to sell through each lot significantly before the expiration or sell by date. This is to ensure that the time spent in the customer’s home is ample to ensure a great eating experience as well. Food waste is a farm to fork problem with opportunity at every step of the chain, but today we will focus on the segment that the grocery industry oversees.
With the complexities of weather, geopolitical issues, distribution, sales variability, pricing, promotions, and inventory management, it seems daunting to impact waste. Fortunately, data analytics and machine learning in the cloud is a powerful weapon in the fight against food waste. Data Scientists harness knowledge to draw meaning from data turning that data into decision driving information.
One key Google has been working on to accelerate value is to break down data silos and leverage machine learning to realize better outcomes, using our Google Data Cloud platform. This enables better planning through demand forecasting, Inventory management, assortment planning, and dynamic pricing and promotions.
That sounds great but how does it work?
Let’s walk through a day in the life journey to see how the integrated Google Data Cloud platform can change the game for good. Our friendly fictitious grocer FastFreshFood is committed to selling high quality perishable items to their local market. Their goal is to minimize food waste and maximize revenue by selling as much perishable fresh food as possible before the sell by date. Our fictitious grocer in partnership with Google Cloud could build a solution that will take a significant bite out of their food waste volume and better satisfy customers.
- Sales through the register and online are processed in real time with Datastream, Dataflow to keep an accurate perpetual inventory by minute of every single item.
- A Demand forecasting model using machine learning algorithms in BigQuery then identifies needs for back room replenishment, so Direct Store Delivery and daily store Distribution Centers manage ordering more efficiently to ensure just the right amount of each product each day.
- Realtime reporting dashboards in Looker with alerting capabilities enable the system to operate with strong associate support and understanding. The reporting suite shows inventory levels into the future, daily orders, and at risk items.
The pricing algorithm could also alert store leadership concerning any items that will not sell through and suggest real time in store specials resulting in zero waste at shelf and maximized revenue.

This approach is not just for perishable categories and is a pattern that works well for in-store produced items and center store items. The key point is that by bringing ML/AI to difficult business problems grocers are reinventing what is possible for both their profitability and sustainability.
The technical implementation of this design pattern in Google Cloud leverages Datastream, Dataflow, BigQuery and Looker products, it is detailed in a technical tutorial accompanying this blog post.
In partnership with Google Cloud, retailers can solve complex problems with innovative solutions to achieve higher quality, lower cost, and provide great customer experiences. To learn more from this and other use cases, please visit our Design Patterns website.
Curious to learn more?
We’re excited to share what we know about tackling food waste at Google, a topic we’ve been working on in the last decade as we’ve embarked on reducing our own food waste in our operations in over 50 countries in the world. The Google Food for Good team works exclusively on Google Cloud Platform with our partners on this topic. Two additional articles below.
Silos are for food, not for data – tackling food waste with technology
This business Cloud blog directly addresses information silos that currently exist across many nodes in the food system and how to break down cultural and organizational barriers to sharing.
“Unsiloing” data to work toward solving food waste and food insecurity
This follow-on technical Cloud blog articulates the path to setting up data pipelines, translating between data sets (not everyone calls a tomato a tomato!) and making sense of emergent insights.
New to Cloud Firestore? Here are Some Basics You Need to Know

3547
Of your peers have already read this article.
5:00 Minutes
The most insightful time you'll spend today!
Learning to use a new database can be daunting, even more so if you don’t already have technical knowledge about databases. In this article, I will break down some database basics, terms you should know, what Firestore is, how it works, how it stores data, and how to get started using it with the assumption that you don’t have any existing database knowledge.
Before we dive into what Cloud Firestore is, let’s discuss some key database terms you should know. Feel free to skip this section if you are already familiar with the basics of Relational and non-relational databases.
What is a database?
A database is software that allows you to easily access, manage, modify, update, control and organize data. The way you want to store information can impact what type of database you choose. There are two major categories of databases, Relational and non-relational.
Relational Database
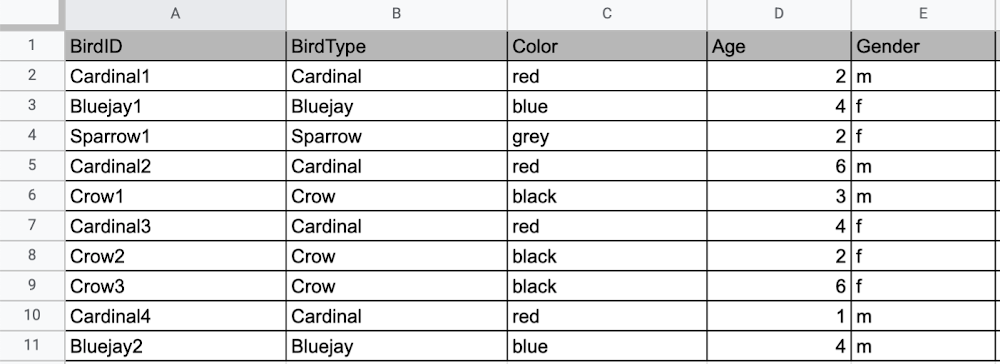
A relational database can be thought of like a spreadsheet. You can store information in your spreadsheet like this:
Now, what happens if I want to store information about where Sparrow1 lives, in my spreadsheet, but I don’t care about where the other birds live? I would have to add another column to my spreadsheet, called home, that would only contain data for the sparrow. That would look like this:
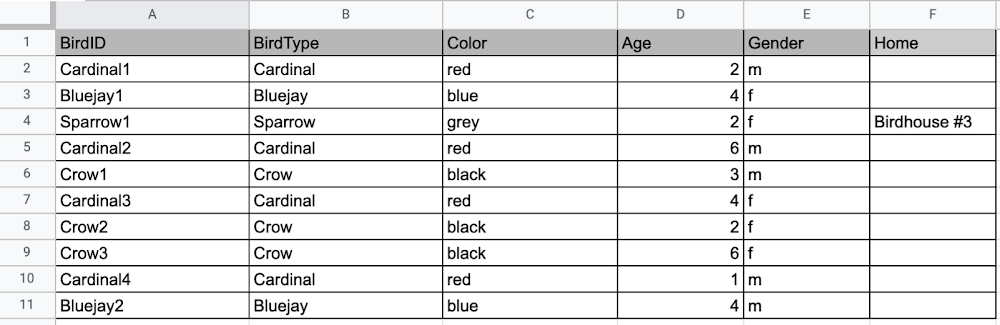
Even though I only want to know information about where the sparrow lives, I am required to have blank spaces in the column for all of the other animals. This is because in a relational database, you have a specific structure of your data called a schema. Just like in a spreadsheet, every item you are storing information on must have a place to put information about the bird’s home, even if you only want that information for one bird. This is enforced by the schema, which is essentially the column headers you put in the sheet and dictates a strict structure for the data, which has pros and cons.
The strict structure of a relational database allows your application to know what kind of data exists, to know what the data type is, and to enforce rules such as requiring data to be unique, or enforcing type of data stored etc. A schema, by design, forces the data in each row to have the same characteristics, which means it is not very flexible, unless you change the schema for the database. That means if you want to add different data that doesn’t fit your existing schema, you have to change the schema. As we discussed above, if you want to change the schema we are using to store information, such as Home, there is some information that will be stored for all rows, even if you don’t want to store anything. The amount of wasted storage is different between database engines, data types etc. Another thing to consider about Relational databases is that at scale, some traditional Relational databases will require more advanced deployments to handle the scale.
Changing the schema of a relational database can be highly disruptive, especially for busy workloads because it requires running scripts to change the schema and coordinating it carefully with the code changes in the app. Due to locking, you might even experience downtime in some cases. Now contrast that with a non-relational document database like Firestore, where you don’t have to worry about schema changes in the databases or downtime as a result of it.
Also, when you have a lot of data that you want to collect and it only applies to a few things in your database, having extra space with no information in it can become wasteful because it uses up storage space in many cases. A non-relational database can help get around this problem.
Non-relational databases
Generally speaking, a non-relational database stores information in a different format than a Relational database. There are 4 major categories of non-relational databases that you will hear most frequently.
- Column-Family
- Document (Firestore)
- Key-Value
- Graph
Since this post is focusing on Firestore, in this section we will dive into what a document database is, how it is used, and when to use it.
Document database (Firestore)
A document database can be thought of as a multi layered collection of entities, such as this:
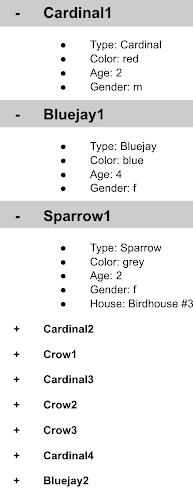
As you can see, when the list is all collapsed, you can only see the information at the top; in this case, that is the BirdID (Cardinal1, Bluejay1, Sparrow1, Cardinal2, Crow1 etc. When I open the list I see “word: word”. For example, the document ID Sparrow1, points to a document with “Type: Sparrow”. I also see “Color: grey”, “Age: 2”, “Gender: f” and “Home: Birdhouse #3”
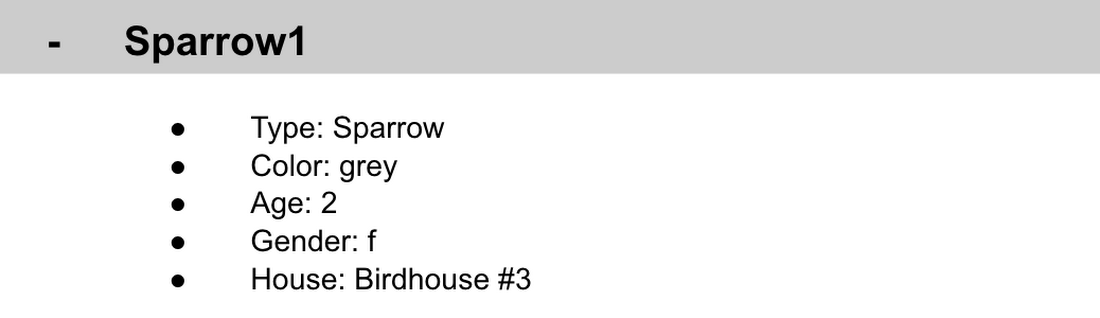
This is known as a key value pair. For “Type: Sparrow”, Type is the key and Sparrow is the value. All of the keys in the Sparrow1 document are: Type, Color, Age, Gender, House. All of the values in the Sparrow1 document are: Sparrow, grey, 2, f, Birdhouse #3.
Similarly to how the key gives you context, it allows you to ask the computer for a specific piece of information, such as the age of the bird. It is important to decide on a specific key term you will use for each piece of data you collect so your data can be easily read programmatically. This is called an implicit schema, an implied understanding of how data is stored that is not enforced by the database. Let’s go over what happens when we use an implicit schema.
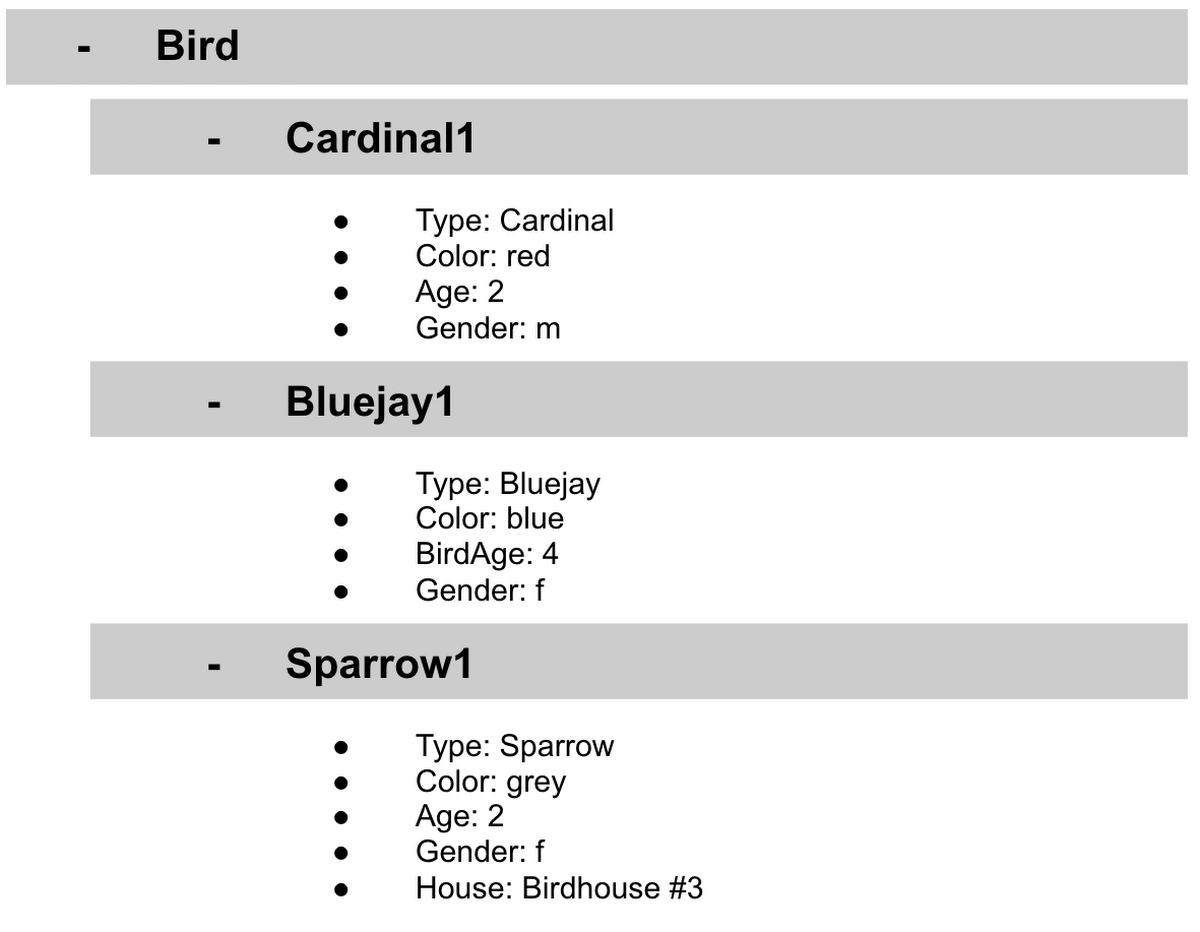
Under Cardinal1, you see Type, Color, Age, and Gender; however, under Sparrow1 you also see House. This is possible because in a non-relational database you don’t have a schema that requires you to store the same information about every bird in your database; instead, you can store the specific information that you need for each bird, regardless of what is stored for other birds. This is a great benefit in terms of flexibility, but because of this flexibility, maintaining standard naming conventions is very important.
Now, let’s discuss why using standard naming conventions is so important. In the example above, if I ask a human: “What is the age of Cardinal1?”, they would probably tell me 2. If I asked them: “What is the Age of Bluejay1?”, they would probably tell me 4. These are both correct answers, but they are only correct because a human is able to assume what Age means. A computer, on the other hand, can’t make assumptions. If I ask a computer: “What is the Age of Cardinal1?” it would say 2, but if I ask it: “What is the Age of Bluejay1?” it would not know. This is because the computer is looking for the keyword Age and it isn’t able to use any context clues to determine what other words might mean Age. However, if I asked the computer: “What is the BirdAge of Bluejay1?”, the computer would tell me 4. Why do I care that I need to tell the computer to look for BirdAge to get the age of blujay one, but to look for Age to get the age of Cardinal one? I care because it means I would have to write two entirely different sets of instructions (i.e software code) to get the age of Cardinal1 and the age of Bluejay1 if I am not careful in how I structure my data. But when I structure my data well, this is not an issue and is infact a benefit by adding added flexibility.
What we see from this example, is that even without a strict schema, we can (and should) define conventions for document formats. If conventions aren’t defined, things can get unwieldy quickly.
How information is accessed
Now, let’s discuss how the information is accessed. If I wanted to know information about which birds are blue in our drop down list example, I would need to expand every section of the list to check if the bird is blue or not. As you can imagine, once you start to get a lot of birds in your database, it becomes cumbersome to open every drop down and see if the bird is blue. Luckily, Firestore lets you run these types of queries against the data (See more here) and receive all the documents that satisfy your conditions. On the other hand, if I wanted to know all of the information about Cardinal1, I could just open the drop down for Cardinal1 and I would have all of the information about that bird.
Now let’s start using some Firestore specific terminology. For the example we just discussed:Collections
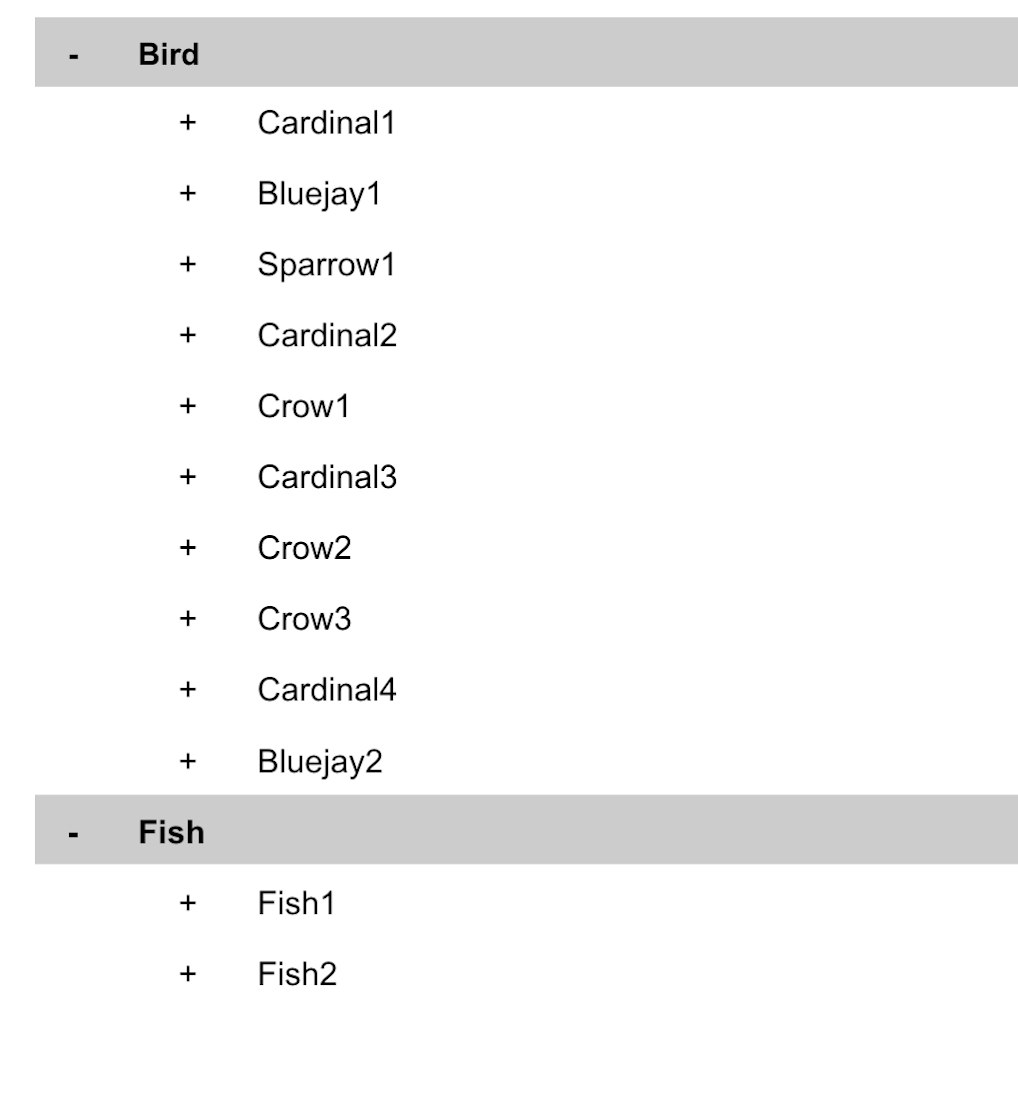
- In Firestore, your data lives in collections. You can think of collections as tabs in a spreadsheet.
- Collections can be used to organize data. For example, if I decide that I want to collect data about birds and fish, the data about birds could be put in a birds collection, and the data about fish could be put in a Fish collection. ex:
- This is the unit of storage that Firestore uses. In our example, each bird is its own document. Documents reside in collections. This is what one document would contain:
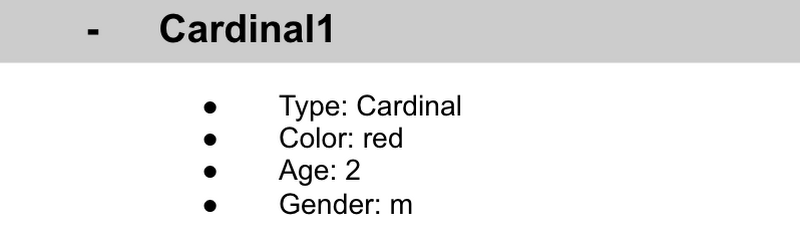
- Each Document corresponds to a row in the sheet. The following diagram demonstrates that each column header maps to a property name in the document and that each value in a row maps to a value in the document.
- Each document must be identified by a unique identifier. In our example, that is BirdID. Notice that the value for BirdID is stored at the top level of the list, so when the document is closed, you can only see Cardinal1 and Cardinal1 is not also stored within the document.
- All documents can be uniquely identified by their location. Let’s think through this in words first before we move to code. If I want to tell someone to get data about the sparrow from the drop down lists, I would need to tell them:
- In the bird drop down list, can you please get all the information under Sparrow1 and put it on a piece of paper called sparrow1Info?
- Now let’s try that again using Firestore terms.
- From the birds collection, can you please get the document for sparrow1 from the Firestore database (db) and save it as sparrow1Info?
- Now let’s try it in code.
- var sparrow1Info = db.collection(‘birds’).doc(‘sparrow1’);
- A subcollection is a collection associated with a document. Using our example of the drop down list, we can add a collection called sightings that stores documents about each sighting of the specific bird. This is what that would look like:
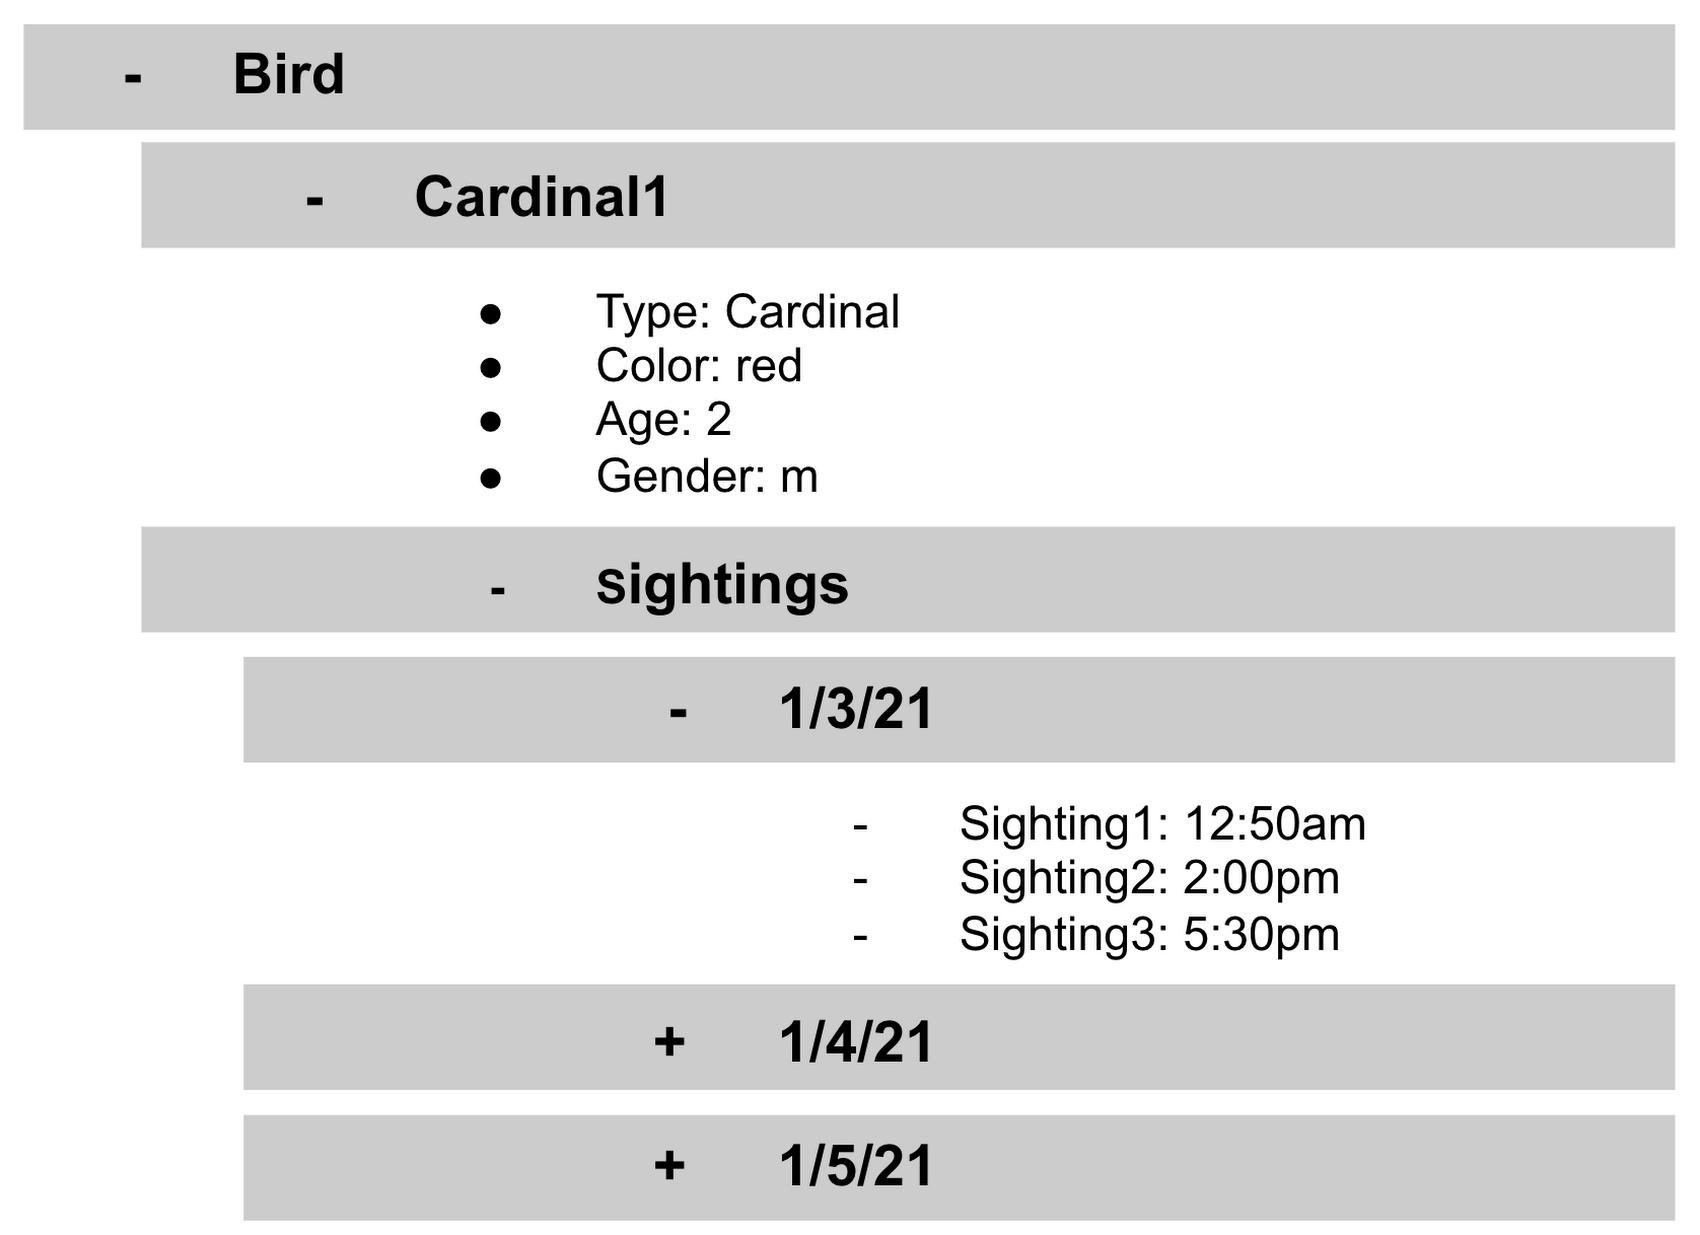
- It is important to note that you don’t need to have the same subcollections on all documents. For example, Cardinal1 can be the only document that has a subcollection of Sightings.
How to search on Google about Firestore
The hardest part of learning a new technology can often be knowing the right terms to put into Google search to get the answers you are looking for. Here are some key terms that can help you get started
Your question:
How should I arrange my data to store it in Firestore?
Search:
Document database implicit schema design
Your Question:
What other databases are similar to firestore?
Search:
What are some document databases
Your Question:
How do I get all documents in the Birds collection?
Search:
How to use wildcards in Firestore
What next?
Try this guide to get started building your first application that uses firestore: https://firebase.google.com/docs/firestore/quickstart
Tyson Foods’ Story of Unlocking Opportunities by Integrating Real-time Analytics with AI and BI

6476
Of your peers have already read this article.
3:00 Minutes
The most insightful time you'll spend today!
As data environments become more complex, companies are turning to streaming analytics solutions that analyze data as it’s ingested and deliver immediate, high-value insights into what is happening now. These insights enable decision makers to act in real time to take advantage of opportunities or respond to issues as they occur.
While understanding what is happening now has great business value, forward-thinking companies are taking things a step further, using real-time analytics integrated with artificial intelligence (AI) and business intelligence (BI) to answer the question, “what might happen in the future?” Arkansas-based Tyson Foods has embraced AI/BI analytics to enable predictive insights that unlock new opportunities and drive future growth.
Creating a digital twin for connected intelligence company wide
Before using AI/BI, Tyson’s analytics capabilities consisted of traditional BI solutions focused on KPIs and simplifying data so that humans could understand it. Tyson wanted to leverage its data to uncover ways to improve current processes and grow its business. But with BI alone, Tyson struggled to use data to run the simulations and scenarios essential to make educated decisions. To keep growing, it had to embrace the complexity of its data, building ways to analyze it and use it to inform decision making.
Tyson’s on-premises analytics solutions limited its ability to be aggressive and make intelligent, timely, prescriptive decisions. The solution was to create a digital twin to scale optimizations within business processes, moving from local optimizations to system-wide connected optimizations. Doing so meant shifting entirely to cloud computing, with an initial focus on building the ingestion component of the digital twin platform.
Investing in a digital twin enabled Tyson to accelerate new capabilities like supply chain simulation “what-if” scenarios, prescriptive price elasticity recommendations, and improvement of customer intimacy.
Solving the ingestion problem for faster time to insights
Before its migration to Google Cloud, analytics projects that Tyson suffered from uncertainty over how to obtain the data. This problem was prolific and caused project times to be extended for weeks or even months due to the need to write and support one-off data ingestion processes at the front end. This problem also prevented the IT team from delivering analytics solutions fast enough for the business to take full advantage of them.
To solve this analytics problem, the team created Data Ingestion Compute Engine (DICE). DICE is a Google Cloud-hosted, open-source, cloud-native ingestion platform developed to provide configuration-based, no-ops, code-free ingestion from disparate enterprise data systems, both internal and external. It is centered on three high-level goals:
- Accelerate the speed of delivery of IT analytics solutions
- Enable growth of IT capabilities to produce meaningful insight
- Reduce long-term total cost of ownership for ingestion solutions
Creating DICE ingestion platform with Google Cloud services
Teams use DICE to set up secure data ingestion jobs in minutes without having to manage complex connections or write, deploy, and support their own code. DICE enables unbound scale, highly parallel processing, DevSecOps, open source, and the implementation of Lambda Data Architecture.
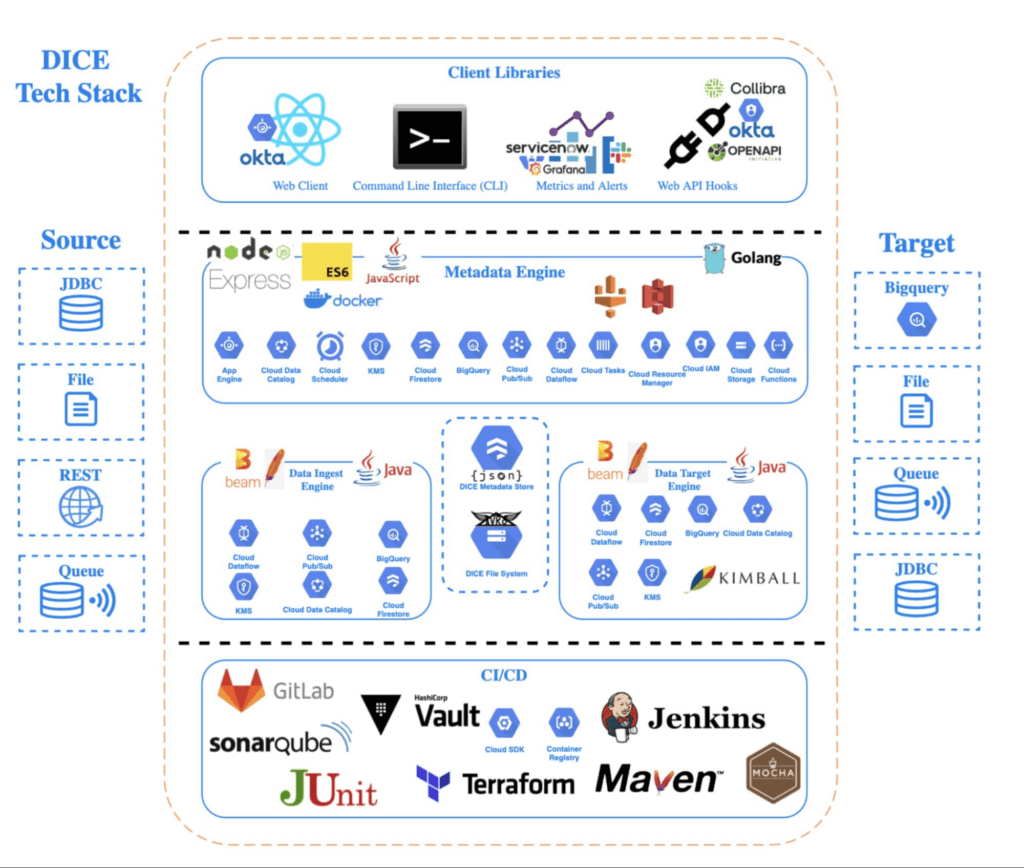
A DICE job is the logical unit of work in the DICE platform, consisting of immutable and mutable configurations persisted as JSON documents stored in Firestore. The job exists as an instruction set for the DICE data engine, which is Apache Beam running Dataflow to instruct which data to pull, how to pull it, how often to pull it, how to process it, when it changes, and where to direct it.
Two of DICE’s primary layers include the metadata engine and the data engine. The metadata engine is responsible for the creation and management of DICE job configuration and orchestration. It is made up of many microservices that interact with multiple Google Cloud services, including the job configuration creation API, job build configuration helper API, and job execution scheduler API.
The data engine is responsible for the physical ingestion of data, the change detection processing of that data, and the delivery of that data to specified targets. The data engine is Java code that uses the Apache Beam unified programming model and runs in Dataflow. It is comprised of streaming, jobs, and Dataflow flex template batch jobs. Logically, the data engine is segmented across three layers: the inbound processing layer, the DICE file system layer, and the target processing layer, which takes the data from the DICE file system and moves it to targets.
Rolling DICE for thousands of ingestion jobs each day
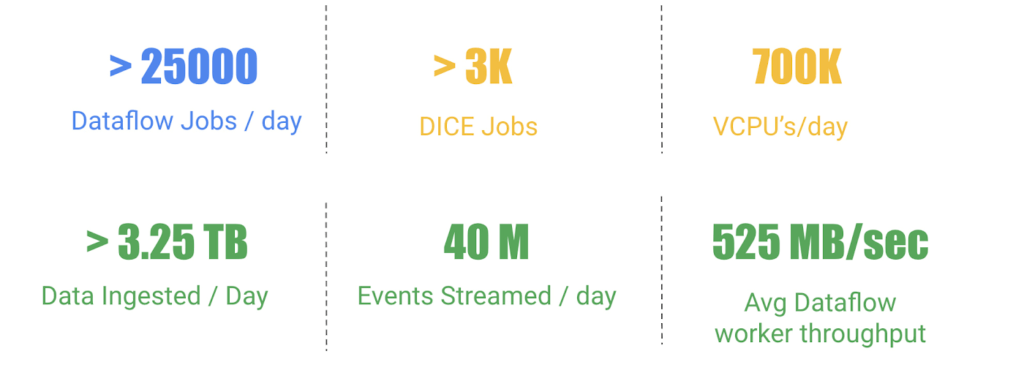
DICE was first deployed to a production environment in November 2019, and just two years later, it has more than 3,000 data ingestion jobs from more than a hundred disparate data systems, both internal and external to Tyson Foods. Most of these jobs run multiple times a day. On a daily basis the DICE environment sees more than 25,000 Dataflow jobs running and an average of 3.25 terabytes of new data being ingested.
DICE supports ingestion from many different types of technologies, including BigQuery, SQL Server, SAP HANA, Postgres, Oracle, MySQL, Db2, various types of file systems, and FTP servers. Additionally, DICE supports target platform technologies for ingestion jobs that include multiple JDBC targets, multiple file system targets, and BigQuery and queue-based store and forward technologies.
The platform continues to see linear growth of DICE jobs, all while keeping platform costs relatively flat. With increasing demand for the platform, Tyson’s IT team is constantly enhancing DICE to support new sources and targets.
This intelligent platform keeps adding new value and makes it simple for Tyson to take advantage of its data. This innovation is a necessity in this fast-changing world of digital business in which companies must transform a high volume of complex data into actionable insight.
BigQuery Omni: Your Solution for Multi-Cloud Geospatial Analytics

1492
Of your peers have already read this article.
6:30 Minutes
The most insightful time you'll spend today!
As we become increasingly reliant on technology to make decisions, geospatial data is becoming more critical than ever. It is a powerful resource that can be used to solve a variety of problems, from tracking the movement of goods, identifying interest areas and potential areas of disaster.
Geospatial data incorporates data with a geographic component, such as latitude and longitude coordinates, addresses, postal codes, or place names, and can be obtained from a variety of sources, including satellites, sensors, and surveys, making it an incredibly powerful tool with a broad range of applications.
One of the key features of BigQuery, Google Cloud’s serverless enterprise data warehouse, is its ability to analyze geospatial data. However, oftentimes geospatial data sits in a variety of public clouds, not just Google Cloud. To access it effectively, you need a multi-cloud analytics solution that lets you capitalize on the distinct capabilities of each cloud platform, while extracting insights and value from data sitting across multiple cloud platforms.
BigQuery Omni is a multi-cloud analytics solution that enables the analysis of data stored across public cloud environments, including Google Cloud, Amazon Web Services (AWS) and Microsoft Azure, without the need to transfer the data. With BigQuery Omni, users can employ the same SQL queries and tools used to analyze data in Google Cloud to analyze data in other clouds, making it easier to gain insights from all data, regardless of the storage location. For businesses using multiple clouds, BigQuery Omni is an excellent tool to unify analytics and optimize the value of data.
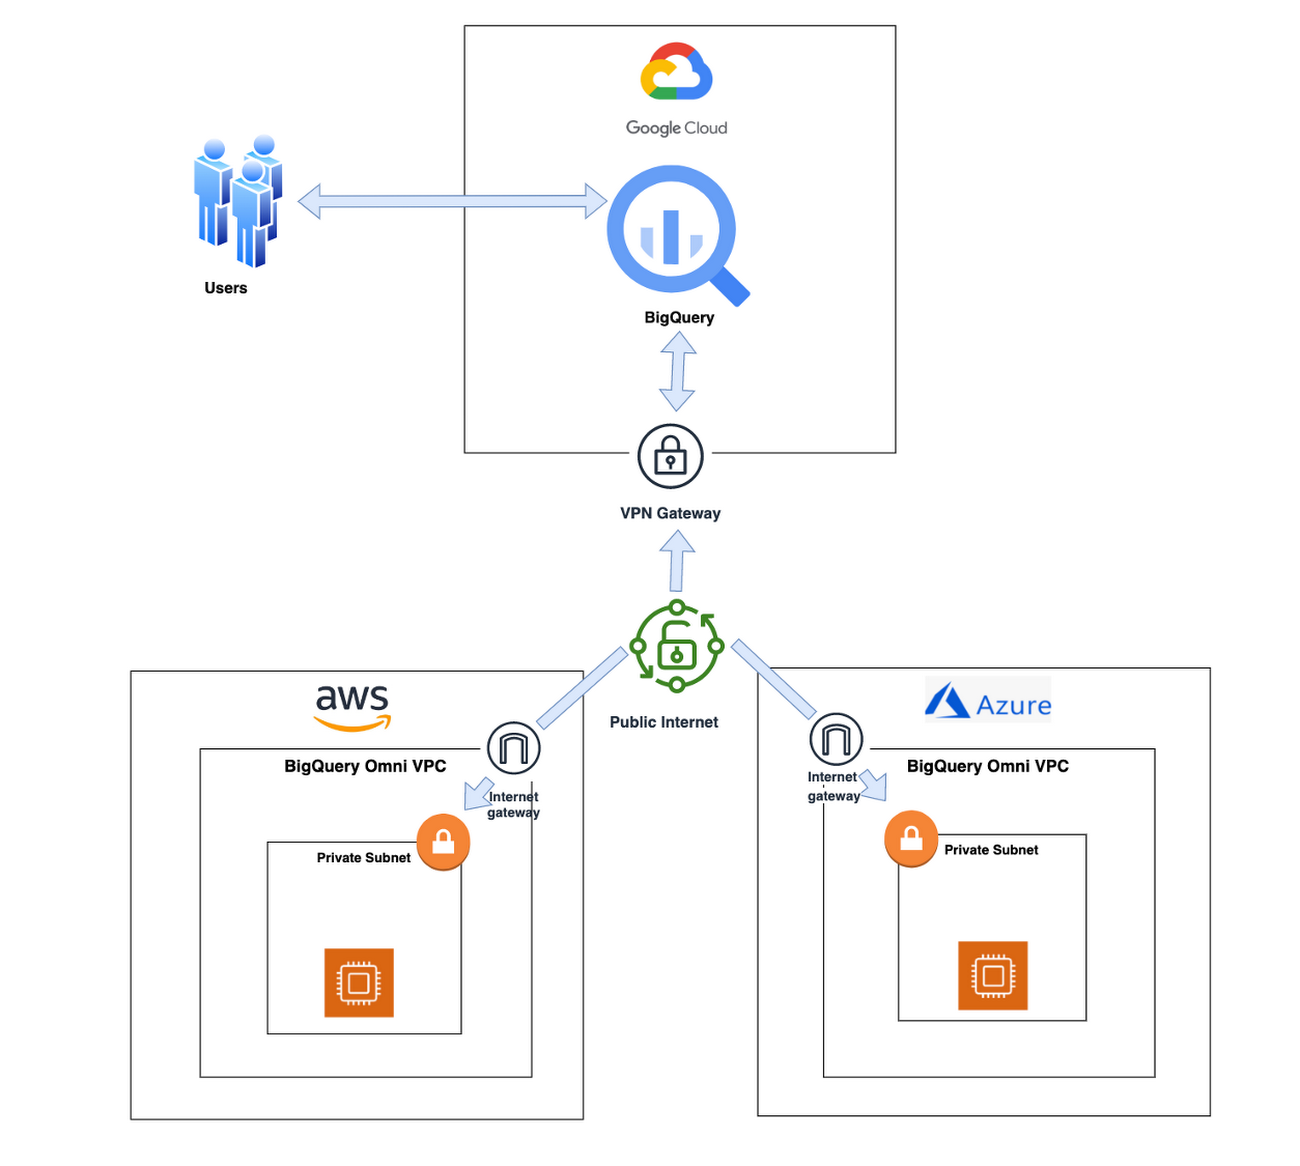
With BigQuery Omni, organizations can analyze location-based information or geographic components, such as latitude and longitude coordinates, addresses, postal codes, or place names without even copying their data to Google Cloud. For example, you could use BigQuery Omni to analyze data from a fleet of delivery vehicles to track their location and identify potential problems.
BigQuery Omni and geospatial data analysis
If you are working with geospatial data, BigQuery Omni is a powerful tool that can help you to get insights from your data. It is scalable, reliable, and secure, making it a great option for unifying your analytics and getting the most out of your data.
Here are a few examples of ways organizations might use BigQuery Omni for geospatial data:
- A transportation company could use BigQuery Omni to analyze data from GPS sensors in its vehicles to track the movement of its fleet and identify potential problems.
- A retail company could use BigQuery Omni to analyze data from its point-of-sale systems to track customer behavior and identify trends.
- A government agency could use BigQuery Omni to analyze data from its weather sensors to track the movement of storms and identify areas at risk of flooding.
BigQuery Omni and geospatial data can be used together to gain insights into a variety of business problems. Specifically, some of the advantages of using BigQuery Omni and geospatial data include:
- Access to quality geospatial data: BigQuery supports loading of newline-delimited GeoJSON files and provides built-in support for loading and querying geospatial data. Data from public data sources like BigQuery public datasets, the Earth Engine catalog, and the United States Geological Survey (USGS) can be easily integrated into your BigQuery environment. Earth Engine has an integrated data catalog with a comprehensive collection of analysis-ready datasets, including satellite imagery and climate data. This data can be combined with proprietary data sources such as SAP, Oracle, Esri ArcGIS Server, Carto, and QGIS.
- Loading and preprocessing of geospatial data: BigQuery has built-in support for loading and querying geospatial data types, and you can use partner solutions such as FME Spatial ETL to load data.
- Working with different geospatial data types and formats: BigQuery supports a variety of file types and formats including WKT, WKB, CSV and GeoJSON.
- Coordinate reference systems: BigQuery’s geography data type is globally consistent. That means that your data is registered to the WGS84 reference system and your analyses can span a city block or multiple continents.
Overall, geospatial analytics with BigQuery Omni provides a wide range of technical capabilities for processing and analyzing geospatial data, making it a powerful tool for businesses that need to work with location-based data.
Analyzing geospatial data with BigQuery Omni
Imagine a retailer who has a large chain of department stores with locations all over the country. They are looking to expand their business and want to identify areas with high sales potential. They want a way to get a better understanding of their sales volume within specific geographic boundaries. To achieve this goal, the retailer turns to the GIS (Geographic Information System) functions built into BigQuery. Here are the steps what the retailer takes to analyze this dataset:
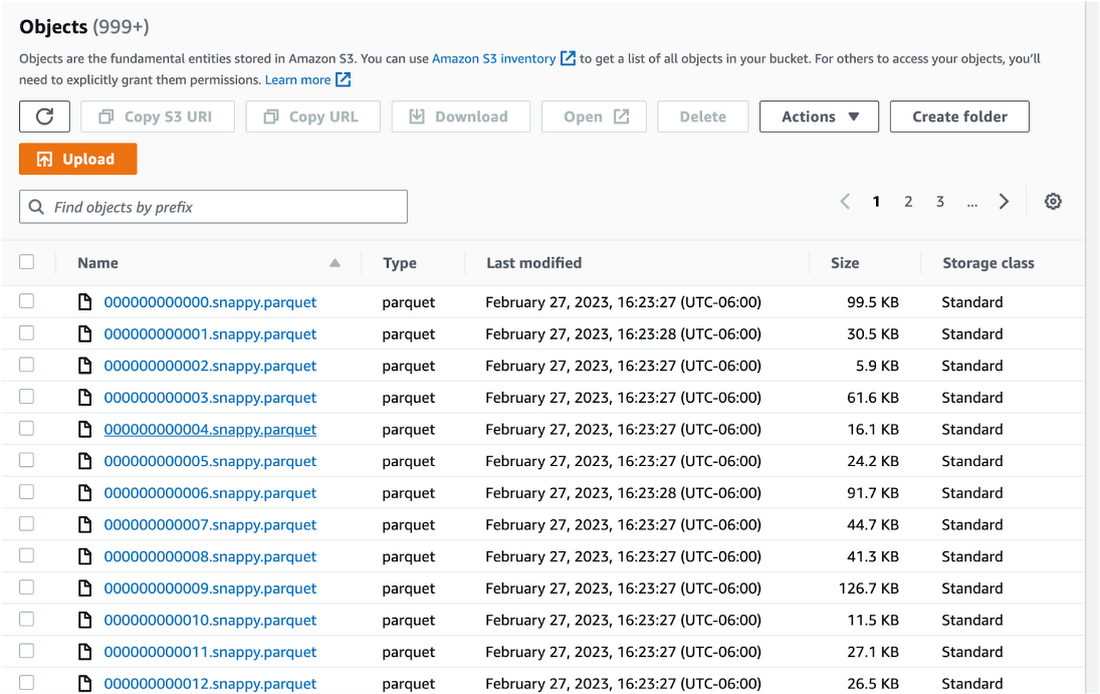
Step 1 : An initial orders dataset on AWS S3 contains 5.54 million rows, and with separate locations (300 rows) and zipcode (33144 rows) metadata files on AWS S3.
Orders Parquet files:
Location and Zipcode files:

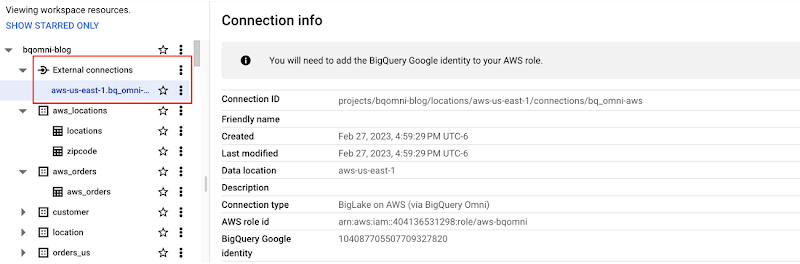
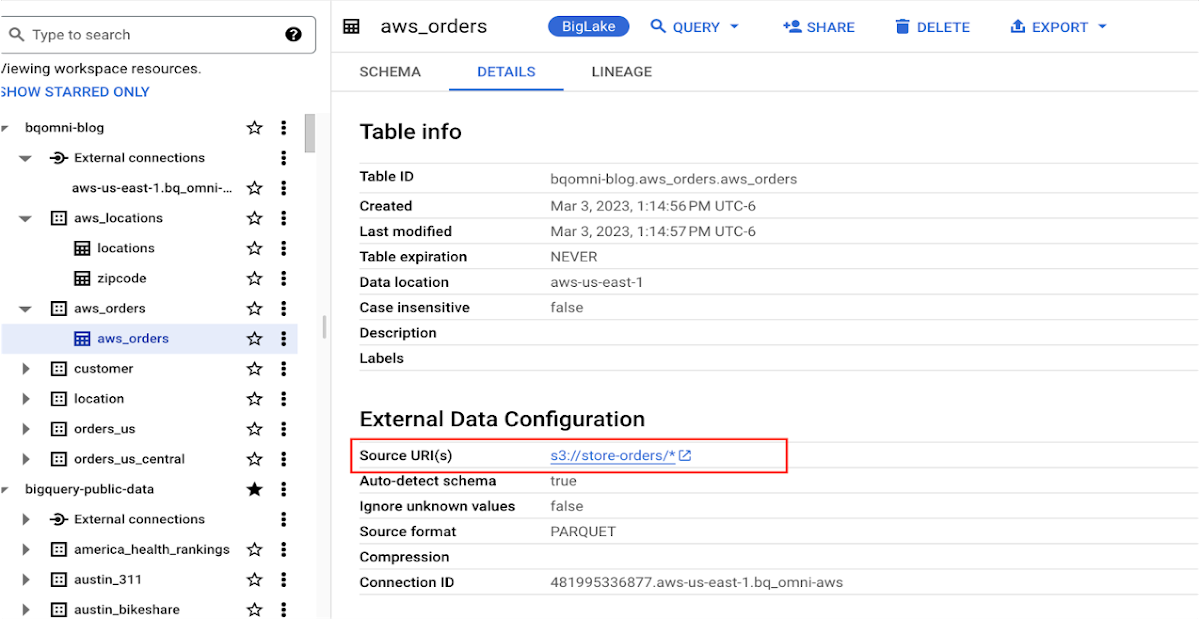
Step 2 : The retailer uses BigQuery Omni to establish a connection between the data stored in AWS and BigQuery, enabling them to access the S3 datasets externally.
External Connection for AWS
External Table for orders
External Table for locations
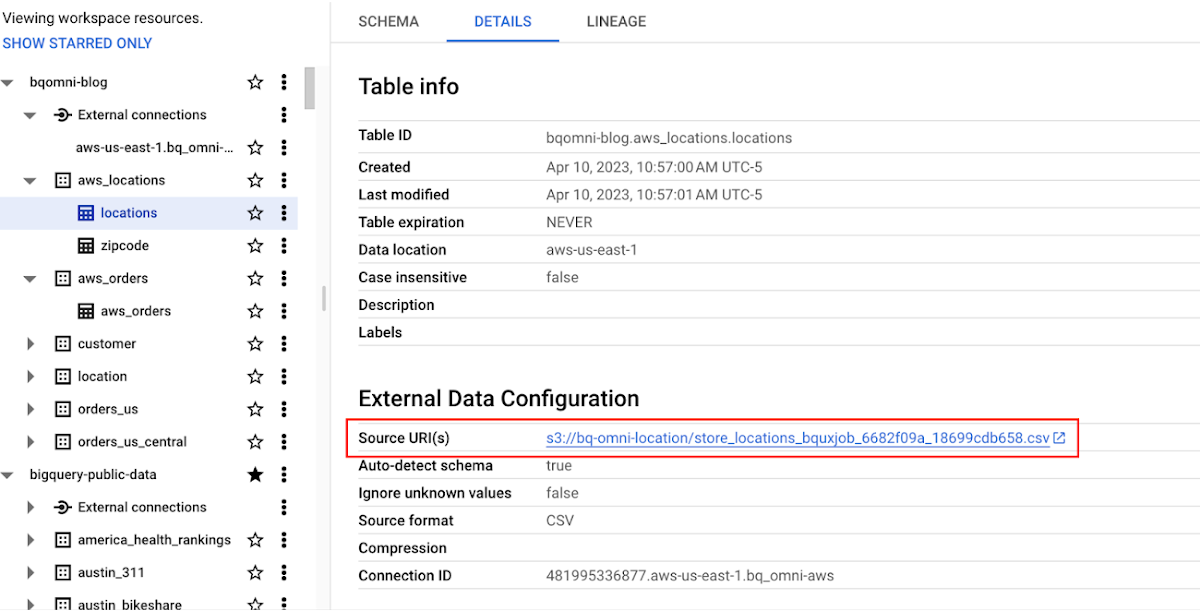
External Table for zipcode
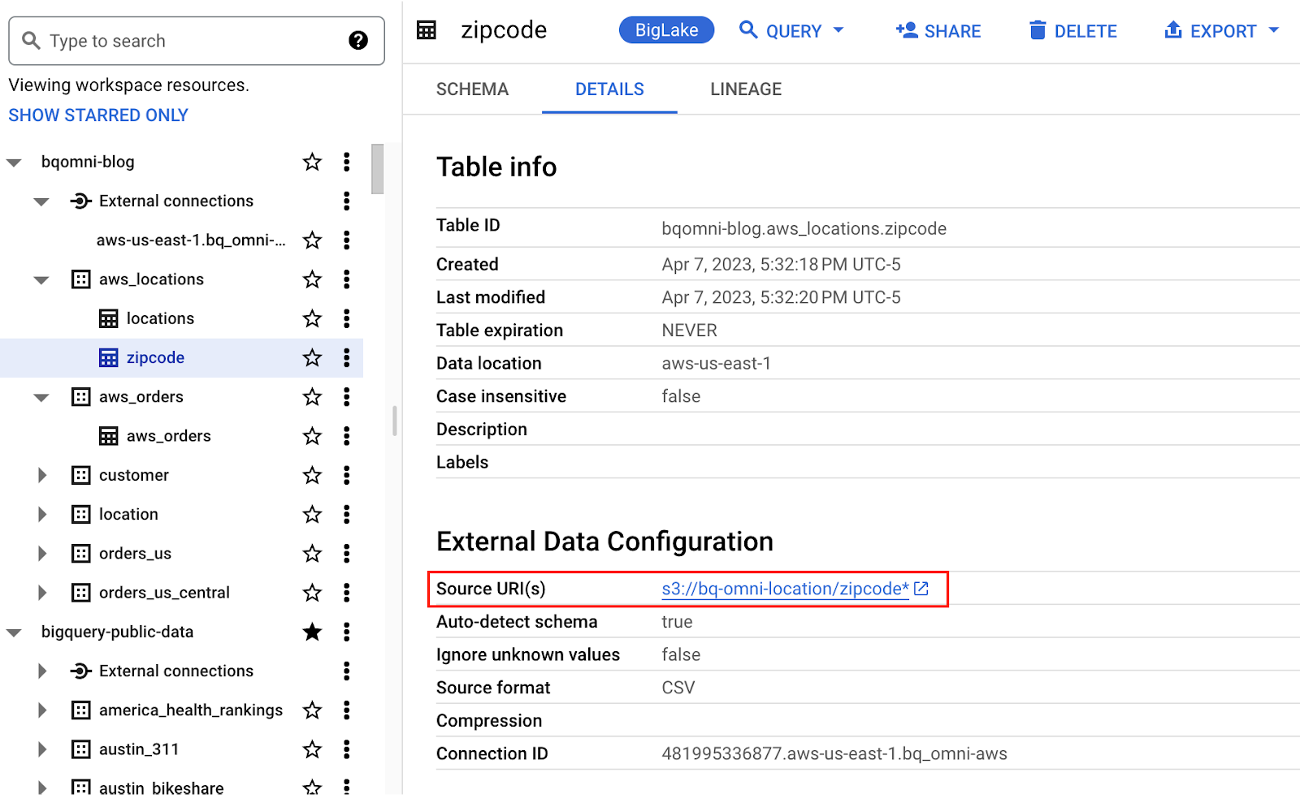
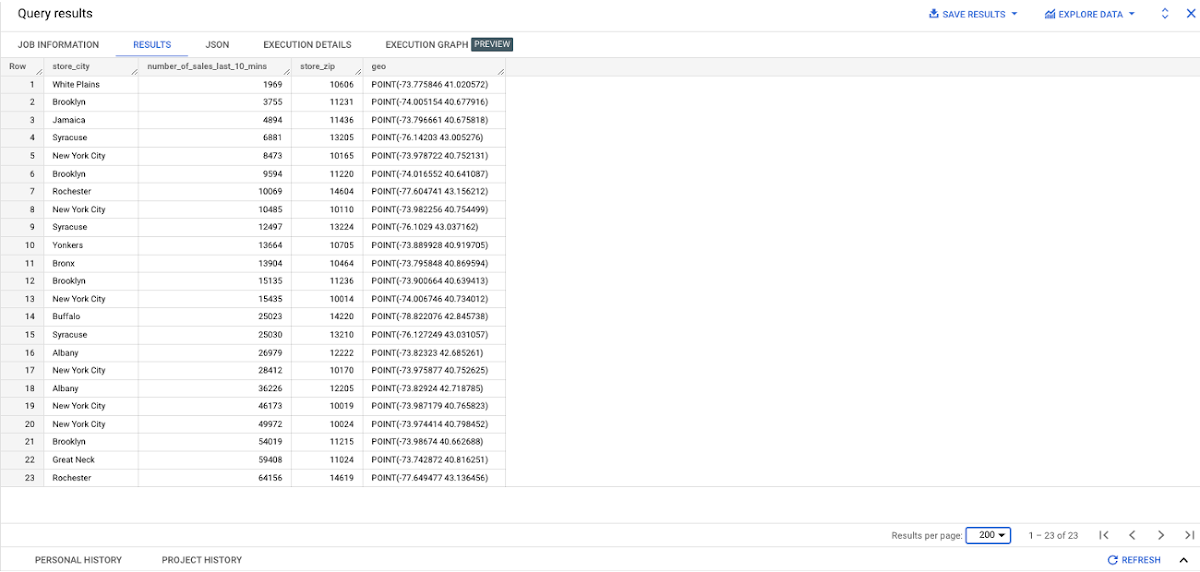
Step 3 : They combine the orders and locations datasets using BigQuery Omni, and remotely aggregate the data on AWS. Joining this dataset with geospatial datasets helps them derive geospatial coordinates.
The final aggregated dataset is reduced to 23 rows. Subsequently, they bring back the result dataset, which contains just 23 rows. This helps them reduce the extraction of millions of rows to just 23 rows for their geospatial analytics.
Select sales.store_city store_city,
sales.number_of_sales_last_10_mins number_of_sales_last_10_mins,
sales.store_zip store_zip,
 ST_GeogPoint(zip_lat_lng.longitude ,
   zip_lat_lng.latitude  ) geo
FROM (
 SELECT
   FORMAT_DATETIME("%X",
     CURRENT_DATETIME("America/Los_Angeles")) current_time,
   MAX(DATETIME(time_of_sale,
       "America/Los_Angeles")) time_of_last_sale,
   COUNT(1) number_of_sales_last_10_mins,
   locations.city store_city,
   locations.zip store_zip
 FROM
   `bqomni-blog.aws_locations.orders_small`  sales
 JOIN
   `bqomni-blog.aws_locations.locations` locations
 ON
   sales.store_id = locations.id
 GROUP BY
   locations.city,
   locations.zip ) sales
JOIN
   `bqomni-blog.aws_locations.zipcode` zip_lat_lng
ON
 cast(sales.store_zip as INT) = cast(zip_lat_lng.zipcode as INT)
 WHERE ST_WITHIN( ST_GeogPoint(zip_lat_lng.longitude , zip_lat_lng.latitude  ) ,ST_GeogFromText(zip_lat_lng.zipcode_geom ) )
 AND zip_lat_lng.state_name  = "New York"
 ORDER BY number_of_sales_last_10_mins
Aggregated Sales data by region
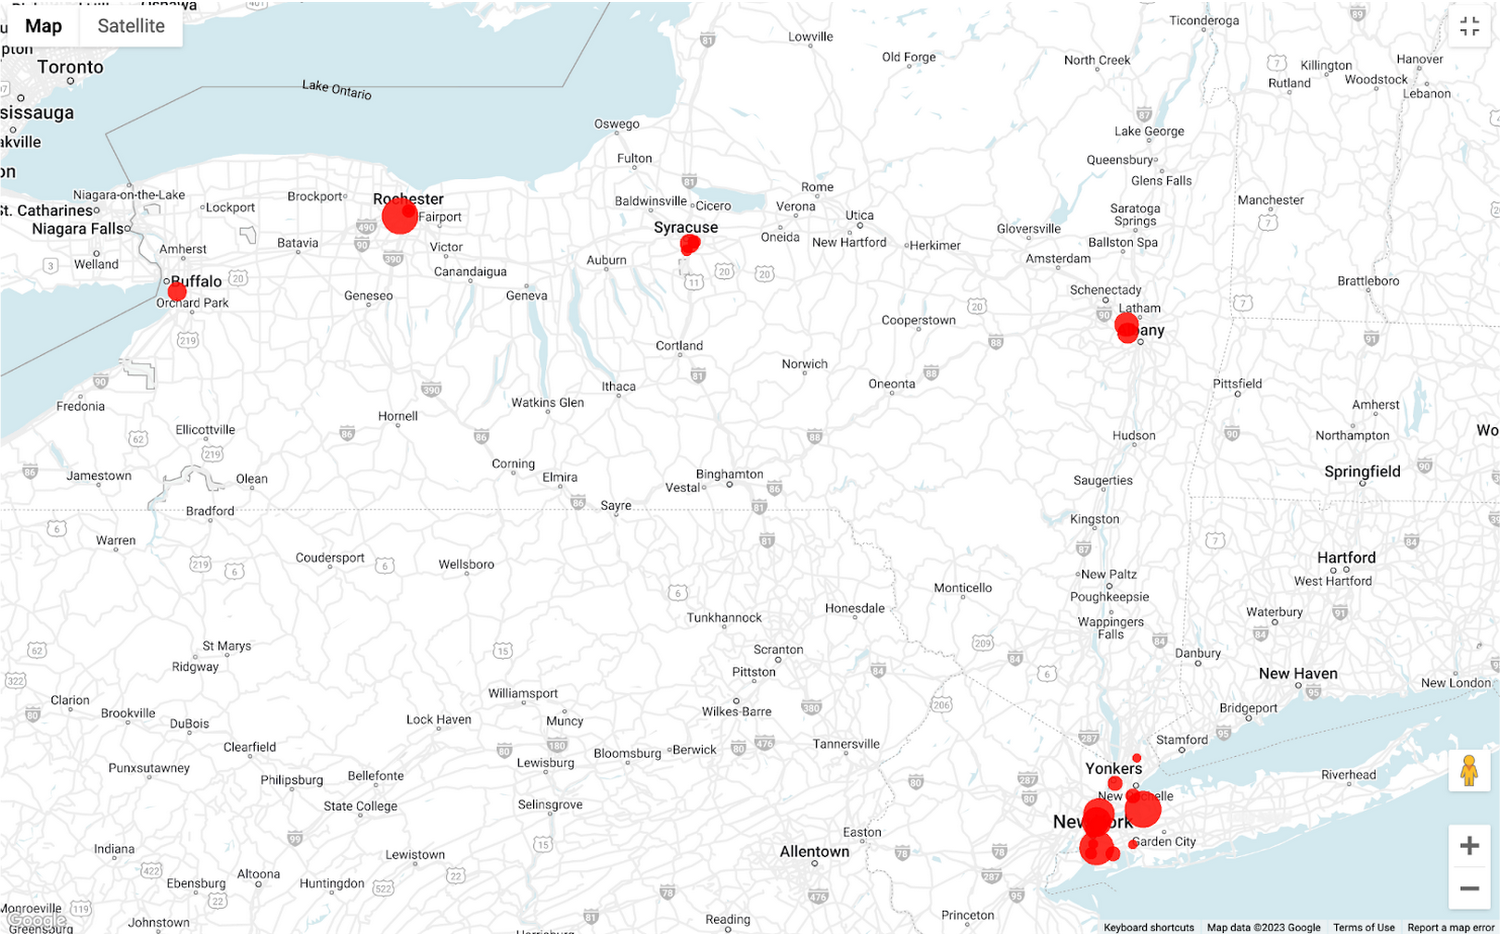
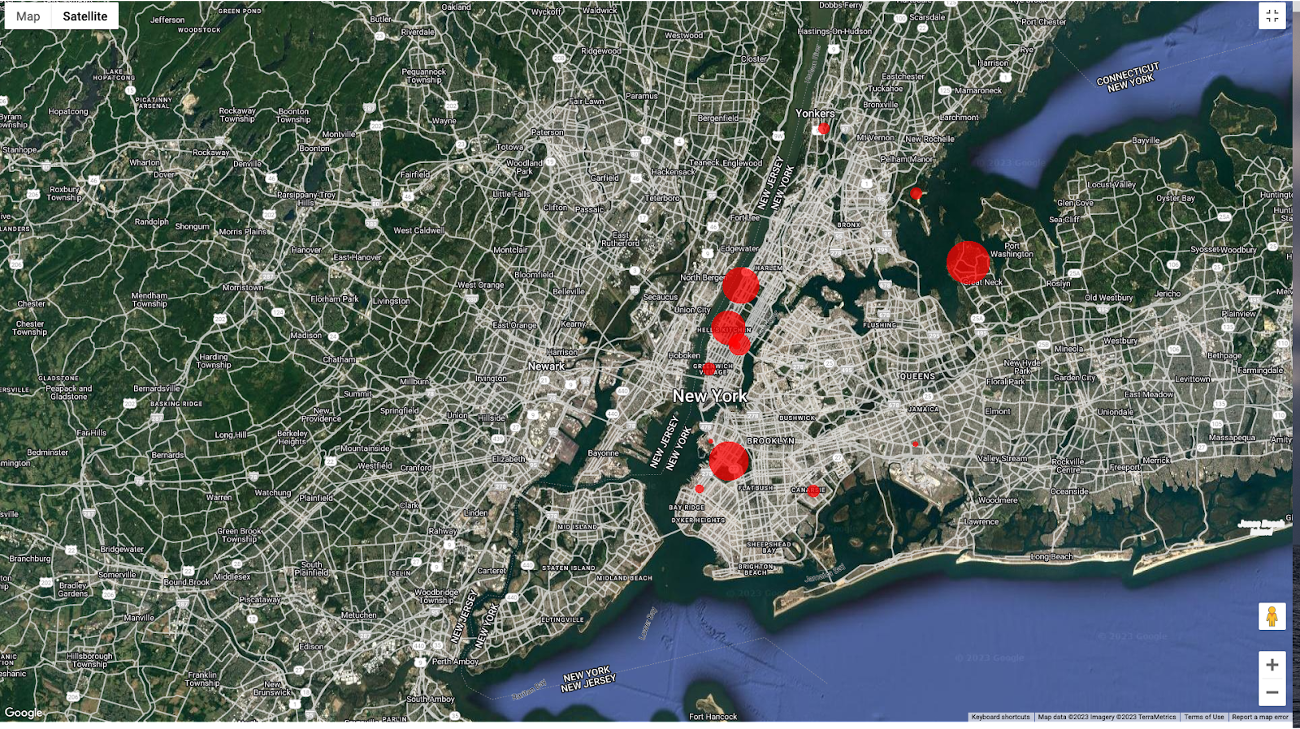
To build richer views of their sales volume data, the retailer uses BigQuery GeoViz integration, a powerful tool that allows for visualizing geographic data on maps.BigQuery Geo Viz is a web tool for visualization of geospatial data in BigQuery using Google Maps APIs. You can run a SQL query and display the results on an interactive map
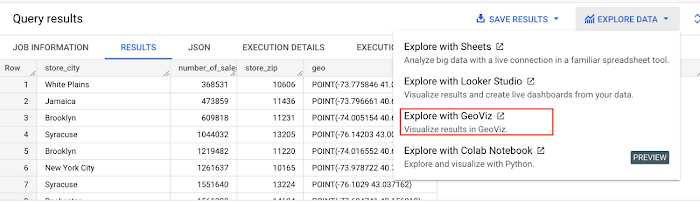
BigQuery Geo view for sales data analysis
With the geo-tagged data in place, the retailer can now see regional sales volume, sales density, distribution by department by time, and distribution within department, all powered through BigQuery.
Satellite view
Benefits of using BigQuery Omni
Beyond geospatial analysis, BigQuery Omni offers a number of benefits, including:
Reduced costs: BigQuery Omni’s ability to eliminate data transfers between clouds can help organizations reduce costs and simplify data management, making it a valuable tool for multi-cloud analytics. Also, the ability to access and analyze data across multiple clouds can reduce the need for data replication and synchronization, which can further simplify the ETL process and improve data consistency.
Unified governance: BigQuery Omni uses the same security controls as BigQuery, which include features such as encryption, access controls, and audit logs, to help protect data from unauthorized access.
Single pane for analytics: BigQuery Omni provides a single interface for querying data across all three clouds, which can simplify the process of analyzing data and reduce the need for organizations to use multiple analytics tools.
Flexibility: Analyze data stored in any of the supported cloud storage services, giving organizations the flexibility to work with the data they have regardless of where it’s located.
BigQuery Omni is a valuable tool for geospatial analysis because it allows you to analyze data from multiple sources without having to move the data. This can save you time and money, and it can also help you to get more accurate insights from your data.If you are looking for a way to improve the accuracy, efficiency, and decision-making of your business, using BigQuery Omni to analyze geospatial data can be a powerful tool.
References
- Omni-introduction
- Omni-benefits
- Omni-aws-create-connection
- Omni-azure-create-connection
- BigQuery Omni Retail Demo on Looker
- Omni-pricing
- Working with Geospatial Data
- Geospatial Analytics – Intro
Learn more about how BigQuery Omni can help your organization.
Google Cloud Helped Digitec Galaxus Personalize Over 2 Million Newsletters in a Week
8292
Of your peers have already read this article.
3:00 Minutes
The most insightful time you'll spend today!
Digitec Galaxus AG is the biggest online retailer in Switzerland, operating two online stores: Digitec, Switzerland’s online market leader for consumer electronics and media products, and Galaxus, the largest Swiss online shop with a steadily growing range of consistently low-priced products for almost all daily needs.
Known for its efficient, personalized shopping experiences, it’s clear that Digitec Galaxus understands what it takes to deliver a platform that is interesting and relevant to customers every time they shop.
The problem: Personalizing decisions for every situation
Digitec Galaxus already had established an engine to help them personalize experiences for shoppers when they reached out to Google Cloud. They had multiple recommendation systems in place and were also extensive early adopters of Recommendations AI, which already enabled them to offer personalized content in places like their homepages, product detail pages, and their newsletter.
But those same systems sometimes made it difficult to understand how best to combine and optimize to create the most personalized experiences for their shoppers. Their requirements were threefold:
- Personalization: They have over 12 recommenders they can display on the app, however they would like to contextualize this and choose different recommenders (which in turn select the items) for different users. Furthermore they would like to exploit existing trends as well as experiment with new ones.
- Latency: They would like to ensure that the solution is architected so that the ranked list of recommenders can be retrieved with sub 50 ms latency.
- End-to-end easy to maintain & generalizable/modular architecture: Digitec wanted the solution to be architected using an easy to maintain, open source stack, complete with all MLops capabilities required to train and use contextual bandits models. It was also important to them that it is built in a modular fashion such that it can be adapted easily to other use cases which have in mind such as recommendations on the homepage, Smartags and more .
To improve, they asked us to help them implement a machine learning (ML) contextual bandit based recommender system on Google Cloud taking all the above factors into consideration to take their personalization to the next level.
Contextual bandits algorithms are a simplified form of reinforcement learning and help aid real-world decision making by factoring in additional information about the visitor (context) to help learn what is most engaging for each individual. They also excel at exploiting trends which work well, as well as exploring new untested trends which can yield potentially even better results. For instance, imagine that you are personalizing a homepage image where you could show a comfy living room couch or pet supplies.
Without a contextual bandit algorithm, one of these images would be shown to someone at random without considering information you may have observed about them during previous visits. Contextual bandits enable businesses to consider outside context, such as previously visited pages or other purchases, and then observe the final outcome (a click on the image) to help determine what works best.
Creating a personalization system with contextual bandits
While Digitec Galaxus heavily personalizes their website homepages, they are very very sensitive and also require more cross-team collaboration to update and make changes.
Together with the Digitec Galaxus team, we decided to narrow the scope and focus on building a contextual bandit personalization system for the newsletter first. The digitec Galaxus team has complete control over newsletter decisions and testing various ML experiments on a newsletter would have less chance of adverse revenue impact than a website homepage.
The main goal was to architect a system that could be easily ported over to the homepage and other services offered by Digitec with minimal adaptations. It would also need to satisfy the functional and non-functional requirements of the homepage as well as other internal use cases.
Below is a diagram of how the newsletter’s personalization recommendation system works:

- The system is given some context features about the newsletter subscriber such as their purchase history and demographics. Features are sometimes referred to as variables or attributes, and can vary widely depending on what data is being analyzed.
- The contextual bandit model trains recommendations using those context features and 12 available recommenders (potential actions).
- The model then calculates which action is most likely to enhance the chance of reward (a user clicking in the newsletter) and also minimize the problem (an unsubscribe).
Calculating whether a click was a newsletter or an unsubscribe enabled the system to optimize for increasing clicks and avoid showing non-relevant content to the user (click-bait). This enabled Digitec Galaxus to exploit popular trends while also exploring potentially better-performing trends.
How Google Cloud helps
The newsletter context-driven personalization system was built on Google Cloud architecture using the ML recommendation training and prediction solutions available within our ecosystem.
Below is a diagram of the high-level architecture used:
The architecture covers three phases of generating context-driven ML predictions, including:
ML Development: Designing and building the ML models and pipeline
Vertex Notebooks are used as data science environments for experimentation and prototyping. Notebooks are also used to implement model training, scoring components, and pipelines. The source code is version controlled in Github. A continuous integration (CI) pipeline is set up to automatically run unit tests, build pipeline components, and store the container images to Cloud Container Registry.
ML Training: Large-scale training and storing of ML models
The training pipeline is executed on Vertex Pipelines. In essence, the pipeline trains the model using new training data extracted from BigQuery and produces a trained, validated contextual bandit model stored in the model registry. In our system, the model registry is a curated Cloud Storage.
The training pipeline uses Dataflow for large scale data extraction, validation, processing, and model evaluation, and Vertex Training for large-scale distributed training of the model. AI Platform Pipelines also stores artifacts, the output of training models, produced by the various pipeline steps to Cloud Storage. Information about these artifacts are then stored in an ML metadata database in Cloud SQL. To learn more about how to build a Continuous Training Pipeline, read the documentation guide.
ML Serving: Deploying new algorithms and experiments in production
The training pipeline uses batch prediction to generate many predictions at once using AI Platform Pipelines, allowing Digitec Galaxus to score large data sets. Once the predictions are produced, they are stored in Cloud Datastore for consumption. The pipeline uses the most recent contextual bandit model in the model registry to evaluate the inference dataset in BigQuery and give a ranked list of the best newsletters for each user, and persist it in Datastore. A Cloud Function is provided as a REST/HTTP endpoint to retrieve the precomputed predictions from Datastore.
All components of the code and architecture are modular and easy to use, which means they can be adapted and tweaked to several other use cases within the company as well.
Better newsletter predictions for millions
The newsletter prediction system was first deployed in production in February, and Digitec Galaxus has been using it to personalize over 2 million newsletters a week for subscribers. The results have been impressive, 50% higher than our baseline. However, the collaboration is still ongoing to improve the results even more.
“Working at this level in direct exchange with Google’s machine learning experts is a unique opportunity for us. The use of contextual bandits in the targeting of our recommendations enables us to pursue completely new approaches in personalization by also personalizing the delivery of the respective recommender to the user. We have already achieved good results in our newsletter in initial experiments and are now working on extending the approach to the entire newsletter by including more contextual data about the bandits arms. Furthermore, as a next step, we intend to apply the system to our online store as well, in order to provide our users with an even more personalized experience. To build this scalable solution, we are using Google’s open source tools such as TFX and TF Agents, as well as Google Cloud Services such as Compute Engine, Cloud Machine Learning Engine, Kubernetes Engine and Cloud Dataflow.”—Christian Sager, Product Owner, Personalization ( Digitec Galaxus)
Since the existing architecture and system is also dynamic, it will automatically adapt to new behaviours, trends, and users. As a result, Digitec Galaxus plans to re-use the same components and extend the existing system to help them improve the personalization of their homepage and other current use cases they have within the company. Beyond clicks and user engagement, the system’s flexibility also allows for future optimization of other criteria. It’s a very exciting time and we can’t wait to see what they build next!
More Relevant Stories for Your Company

Unifying Data and AI: Bringing Unstructured Data Analytics to BigQuery
Over one third of organizations believe that data analytics and machine learning have the most potential to significantly alter the way they run business over the next 3 to 5 years. However, only 26% of organizations are data driven. One of the biggest reasons for this gap is that a

DR for Cloud: Architecting Microsoft SQL Server with Google Cloud
Database disaster recovery (DR) planning is an important component of a bigger DR plan, and for enterprises using Microsoft SQL Server on Compute Engine, it often involves critical data. When you’re architecting a disaster recovery solution with Microsoft SQL Server running on Google Cloud Platform (GCP), you have some decisions to make

How Constellation Brands’ Direct-to-Customer Tech Delivers Economic Impact across Business Portfolio
Editor’s note: Today we’re hearing from Ryan Mason, Director, Head of DTC Growth & Strategy, at alcoholic beverage firm, Constellation Brands on the company’s shift to Direct-to-Consumer (DTC) sales and how Google Cloud’s powerful technology stack helped with this transformation. It’s no secret that consumer businesses have been up-ended in

Start-up Paves Way for More Inclusive Clinical Research: Honoring Black Founders of Acclinate with Google Cloud
Editor’s note: February is Black History Month—a time for us to come together to celebrate the diverse set of experiences, perspectives and identities that make up the Black experience. Over the next few weeks, we will highlight Black-led startups and how they use Google Cloud to grow their businesses. Today’s
