





DR for Cloud: Architecting Microsoft SQL Server with Google Cloud

3755
Of your peers have already read this article.
2:45 Minutes
The most insightful time you'll spend today!
Database disaster recovery (DR) planning is an important component of a bigger DR plan, and for enterprises using Microsoft SQL Server on Compute Engine, it often involves critical data.
When you’re architecting a disaster recovery solution with Microsoft SQL Server running on Google Cloud Platform (GCP), you have some decisions to make to build an effective, comprehensive plan.
Microsoft SQL Server includes a variety of disaster recovery strategies and features, such as Always On availability groups or Failover Cluster Instances.
And Google Cloud is designed from the start for resilience and availability. There are several types of data centers available within GCP where you can map SQL Server’s availability features based on your specific requirements: zones and regions. Zones are autonomous data centers co-located within a GCP region. These regions are available in different geographies such as North America or APAC.
However, there is no single disaster recovery strategy to map Microsoft SQL Server DR features to Google Cloud’s data center topology that satisfies every possible combination of disaster recovery requirements.
As a database architect, you have to design a custom disaster recovery strategy based on your specific use cases and requirements.
Our new Disaster Recovery for Microsoft SQL Server solution provides information on Microsoft’s SQL Server disaster recovery strategies, and shows how you can map them to zones and regions in GCP based on your business’s particular criteria and requirements. One example is deploying an availability group within a region across three zones (shown in the diagram below).
For successful DR planning, you should have a clear conceptual model and established terminology in place. In this solution, you’ll find a base set of concepts and terms in context of Google Cloud DR. This includes defining terms like primary database, secondary database, failover, switchover, and fallback.
You’ll also find details on recovery point objective, recovery time objective and single point of failure domain, since those are key drivers for developing a specific disaster recovery solution.
Building a DR solution with Microsoft SQL Server in GCP regions
To get started with implementing the availability features of Microsoft SQL Server in the context of Google Cloud, take a look at this diagram, which shows the implementation of an Always On availability group in a GCP region, using several zones:
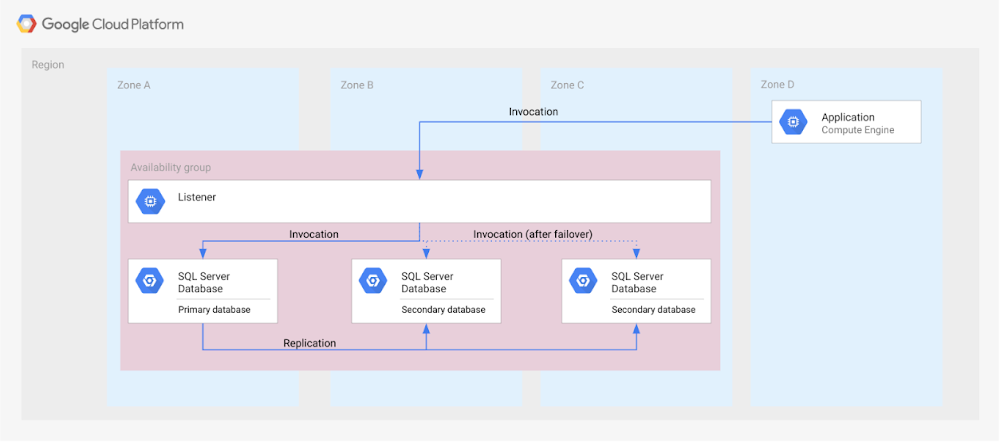
In the new solution, you’ll see other availability features, like log shipping, along with how they map to GCP. In addition, features in Microsoft SQL Server that are not deemed availability features—like server replication and backup file shipping—can actually be used for disaster recovery, so those are included as well.
Disaster recovery features of Microsoft SQL Server do not have to be used in isolation and can be combined for more complex and demanding use cases. For example, you can set up availability groups in two regions with log shipping as the transfer mechanism between the regions.
Disaster Recovery for Microsoft SQL Server also describes the disaster recovery process itself, how to test and verify a defined disaster recovery solution, and outlines a basic approach, step-by-step.

AirAsia Turns to Google Cloud to refine Pricing, Increase Revenue, and Improve Customer Experience
DOWNLOAD CASE STUDY7111
Of your peers have already downloaded this article
1:30 Minutes
The most insightful time you'll spend today!
AirAsia needed a platform incorporating products that could capture, process, analyze, and report on data, while delivering value for money and meeting its speed and availability requirements. The airline also wanted to minimise infrastructure management and system administration demands on its technology team members.
The airline conducted a proof of concept and found Google Cloud Platform—including the Google BigQuery analytics data warehouse—was the best fit.
AirAsia was impressed by the ease and flexibility with which it could extract, transform, and load customer data from its systems, websites, and mobile applications into Google BigQuery for analysis. Reporting and dashboards were quickly and effectively delivered through Google Data Studio.
“With a minimal number of people involved, we can very quickly transform an idea or thought process into a deliverable. Prior to Google Cloud Platform, bringing those ideas to fruition would have been impossible,” says Nikunj Shanti, Chief Data and Digital Officer, AirAsia.
10125
Of your peers have already watched this video.
1:00 Minutes
The most insightful time you'll spend today!
Predict User Churn on Gaming Apps with Google Analytics Data using BigQuery ML
User retention can be a major challenge for mobile game developers. According to the Mobile Gaming Industry Analysis in 2019, most mobile games only see a 25% retention rate for users after the first day. To retain a larger percentage of users after their first use of an app, developers can take steps to motivate and incentivize certain users to return. But to do so, developers need to identify the propensity of any specific user returning after the first 24 hours.
In this blog post, we will discuss how you can use BigQuery ML to run propensity models on Google Analytics 4 data from your gaming app to determine the likelihood of specific users returning to your app.
You can also use the same end-to-end solution approach in other types of apps using Google Analytics for Firebase as well as apps and websites using Google Analytics 4. To try out the steps in this blogpost or to implement the solution for your own data, you can use this Jupyter Notebook.
Using this blog post and the accompanying Jupyter Notebook, you’ll learn how to:
- Explore the BigQuery export dataset for Google Analytics 4
- Prepare the training data using demographic and behavioural attributes
- Train propensity models using BigQuery ML
- Evaluate BigQuery ML models
- Make predictions using the BigQuery ML models
- Implement model insights in practical implementations
Google Analytics 4 (GA4) properties unify app and website measurement on a single platform and are now default in Google Analytics. Any business that wants to measure their website, app, or both, can use GA4 for a more complete view of how customers engage with their business. With the launch of Google Analytics 4, BigQuery export of Google Analytics data is now available to all users. If you are already using a Google Analytics 4 property, you can follow this guide to set up exporting your GA data to BigQuery.
Once you have set up the BigQuery export, you can explore the data in BigQuery. Google Analytics 4 uses an event-based measurement model. Each row in the data is an event with additional parameters and properties. The Schema for BigQuery Export can help you to understand the structure of the data.
In this blogpost, we use the public sample export data from an actual mobile game app called “Flood It!” (Android, iOS) to build a churn prediction model. But you can use data from your own app or website.
Here’s what the data looks like. Each row in the dataset is a unique event, which can contain nested fields for event parameters.
SELECT *FROM `firebase-public-project.analytics_153293282.events_*`TABLESAMPLE SYSTEM (1 PERCENT)

This dataset contains 5.7M events from over 15k users.
SELECTCOUNT(DISTINCT user_pseudo_id) as count_distinct_users,COUNT(event_timestamp) as count_eventsFROM`firebase-public-project.analytics_153293282.events_*

Our goal is to use BigQuery ML on the sample app dataset to predict propensity to user churn or not churn based on users’ demographics and activities within the first 24 hours of app installation.

In the following sections, we’ll cover how to:
- Pre-process the raw event data from GA4
- Identify users & the label feature
- Process demographic features
- Process behavioral features
- Train classification model using BigQuery ML
- Evaluate the model using BigQueryML
- Make predictions using BigQuery ML
- Utilize predictions for activation
Pre-process the raw event data
You cannot simply use raw event data to train a machine learning model as it would not be in the right shape and format to use as training data. So in this section, we’ll go through how to pre-process the raw data into an appropriate format to use as training data for classification models.
This is what the training data should look like for our use case at the end of this section:

Notice that in this training data, each row represents a unique user with a distinct user ID (user_pseudo_id).
Identify users & the label feature
We first filtered the dataset to remove users who were unlikely to return the app anyway. We defined these ‘bounced’ users as ones who spent less than 10 mins with the app. Then we labeled all remaining users:
- churned: No event data for the user after 24 hours of first engaging with the app.
- returned: The user has at least one event record after 24 hours of first engaging with the app.
For your use case, you can have a different definition of bounce and churning. Also you can even try to predict something else other than churning, e.g.:
- whether a user is likely to spend money on in-game currency
- likelihood of completing n-number of game levels
- likelihood of spending n amount of time in-game etc.
In such cases, label each record accordingly so that whatever you are trying to predict can be identified from the label column.
From our dataset, we found that ~41% users (5,557) bounced. However, from the remaining users (8,031), ~23% (1,883) churned after 24 hours:
SELECTbounced,churned,COUNT(churned) as count_usersFROMbqmlga4.returningusersGROUP BY 1,2ORDER BY bounced

To create these bounced and churned columns, we used the following snippet of SQL code.
...#churned = 1 if last_touch within 24 hr of app installation, else 0IF (user_last_engagement < TIMESTAMP_ADD(user_first_engagement,INTERVAL 24 HOUR),1,0 ) AS churned,#bounced = 1 if last_touch within 10 min, else 0IF (user_last_engagement <= TIMESTAMP_ADD(user_first_engagement,INTERVAL 10 MINUTE),1,0 ) AS bounced,...
You can view the Jupyter Notebook for the full query used for materializing the bounced and churned labels.
Process demographic features
Next, we added features both for demographic data and for behavioral data spanning across multiple columns. Having a combination of both demographic data and behavioral data helps to create a more predictive model.
We used the following fields for each user as demographic features:
geo.countrydevice.operating_systemdevice.language
A user might have multiple unique values in these fields — for example if a user uses the app from two different devices. To simplify, we used the values from the very first user engagement event.
CREATE OR REPLACE VIEW bqmlga4.user_demographics AS (WITH first_values AS (SELECTuser_pseudo_id,geo.country as country,device.operating_system as operating_system,device.language as language,ROW_NUMBER() OVER (PARTITION BY user_pseudo_id ORDER BY event_timestamp DESC) AS row_numFROM `firebase-public-project.analytics_153293282.events_*`WHERE event_name="user_engagement")SELECT * EXCEPT (row_num)FROM first_valuesWHERE row_num = 1 #first engagement);
Process behavioral features
There is additional demographic information present in the GA4 export dataset, e.g. app_info, device, event_params, geo etc. You may also send demographic information to Google Analytics through each hit via user_properties. Furthermore, if you have first-party data on your own system, you can join that with the GA4 export data based on user_ids.
To extract user behavior from the data, we looked into the user’s activities within the first 24 hours of first user engagement. In addition to the events automatically collected by Google Analytics, there are also the recommended events for games that can be explored to analyze user behavior. For our use case, to predict user churn, we counted the number of times the follow events were collected for a user within 24 hours of first user engagement:
user_engagementlevel_start_quickplaylevel_end_quickplaylevel_complete_quickplaylevel_reset_quickplaypost_scorespend_virtual_currencyad_rewardchallenge_a_friendcompleted_5_levelsuse_extra_steps
The following query shows how these features were calculated:
WITHevents_first24hr AS (SELECTe.*FROM`firebase-public-project.analytics_153293282.events_*` eJOINbqmlga4.returningusers rONe.user_pseudo_id = r.user_pseudo_idWHERETIMESTAMP_MICROS(e.event_timestamp) <= r.ts_24hr_after_first_engagement)SELECTuser_pseudo_id,SUM(IF(event_name = 'user_engagement', 1, 0)) AS cnt_user_engagement,# ... repeated for all behavior data ...SUM(IF(event_name = 'use_extra_steps', 1, 0)) AS cnt_use_extra_steps,FROMevents_first24hrGROUP BY1
View the notebook for the query used to aggregate and extract the behavioral data. You can use different sets of events for your use case. To view the complete list of events, use the following query:
SELECTevent_name,COUNT(event_name) as event_countFROM`firebase-public-project.analytics_153293282.events_*`GROUP BY 1ORDER BYevent_count DESC
After this we combined the features to ensure our training dataset reflects the intended structure. We had the following columns in our table:
- User ID:
user_pseudo_id
- Label:
churned
- Demographic features
countrydevice_osdevice_language
- Behavioral features
cnt_user_engagementcnt_level_start_quickplaycnt_level_end_quickplaycnt_level_complete_quickplaycnt_level_reset_quickplaycnt_post_scorecnt_spend_virtual_currencycnt_ad_rewardcnt_challenge_a_friendcnt_completed_5_levelscnt_use_extra_stepsuser_first_engagement
At this point, the dataset was ready to train the classification machine learning model in BigQuery ML. Once trained, the model will output a propensity score between churn (churned=1) or return (churned=0) indicating the probability of a user churning based on the training data.
Train classification model
When using the CREATE MODEL statement, BigQuery ML automatically splits the data between training and test. Thus the model can be evaluated immediately after training (see the documentation for more information).
For the ML model, we can choose among the following classification algorithms where each type has its own pros and cons:

Often logistic regression is used as a starting point because it is the fastest to train. The query below shows how we trained the logistic regression classification models in BigQuery ML.
CREATE OR REPLACE MODEL bqmlga4.churn_logregTRANSFORM(EXTRACT(MONTH from user_first_engagement) as month,EXTRACT(DAYOFYEAR from user_first_engagement) as julianday,EXTRACT(DAYOFWEEK from user_first_engagement) as dayofweek,EXTRACT(HOUR from user_first_engagement) as hour,* EXCEPT(user_first_engagement, user_pseudo_id))OPTIONS(MODEL_TYPE="LOGISTIC_REG",INPUT_LABEL_COLS=["churned"]) ASSELECT*FROMbqmlga4.train
We extracted month, julianday, and dayofweek from datetimes/timestamps as one simple example of additional feature preprocessing before training. Using TRANSFORM() in your CREATE MODEL query allows the model to remember the extracted values. Thus, when making predictions using the model later on, these values won’t have to be extracted again. View the notebook for the example queries to train other types of models (XGBoost, deep neural network, AutoML Tables).
Evaluate model
Once the model finished training, we ran ML.EVALUATE to generate precision, recall, accuracy and f1_score for the model:
SELECT*FROMML.EVALUATE(MODEL bqmlga4.churn_logreg)

The optional THRESHOLD parameter can be used to modify the default classification threshold of 0.5. For more information on these metrics, you can read through the definitions on precision and recall, accuracy, f1-score, log_loss and roc_auc. Comparing the resulting evaluation metrics can help to decide among multiple models.Furthermore, we used a confusion matrix to inspect how well the model predicted the labels, compared to the actual labels. The confusion matrix is created using the default threshold of 0.5, which you may want to adjust to optimize for recall, precision, or a balance (more information here).
SELECTexpected_label,_0 AS predicted_0,_1 AS predicted_1FROMML.CONFUSION_MATRIX(MODEL bqmlga4.churn_logreg)

This table can be interpreted in the following way:

Make predictions using BigQuery ML
Once the ideal model was available, we ran ML.PREDICT to make predictions. For propensity modeling, the most important output is the probability of a behavior occurring. The following query returns the probability that the user will return after 24 hrs. The higher the probability and closer it is to 1, the more likely the user is predicted to return, and the closer it is to 0, the more likely the user is predicted to churn.
SELECTuser_pseudo_id,returned,predicted_returned,predicted_returned_probs[OFFSET(0)].prob as probability_returnedFROMML.PREDICT(MODEL bqmlga4.churn_logreg,(SELECT * FROM bqmlga4.train)) #can be replaced with a proper test dataset
Utilize predictions for activation
Once the model predictions are available for your users, you can activate this insight in different ways. In our analysis, we used user_pseudo_id as the user identifier. However, ideally, your app should send back the user_id from your app to Google Analytics. In addition to using first-party data for model predictions, this will also let you join back the predictions from the model into your own data.
- You can import the model predictions back into Google Analytics as a user attribute. This can be done using the Data Import feature for Google Analytics 4. Based on the prediction values you can Create and edit audiences and also do Audience targeting. For example, an audience can be users with prediction probability between 0.4 and 0.7, to represent users who are predicted to be “on the fence” between churning and returning.
- For Firebase Apps, you can use the Import segments feature. You can tailor user experience by targeting your identified users through Firebase services such as Remote Config, Cloud Messaging, and In-App Messaging. This will involve importing the segment data from BigQuery into Firebase. After that you can send notifications to the users, configure the app for them, or follow the user journeys across devices.
- Run targeted marketing campaigns via CRMs like Salesforce, e.g. send out reminder emails.
You can find all of the code used in this blogpost in the Github repository:
What’s next?
Continuous model evaluation and re-training
As you collect more data from your users, you may want to regularly evaluate your model on fresh data and re-train the model if you notice that the model quality is decaying.
Continuous evaluation—the process of ensuring a production machine learning model is still performing well on new data—is an essential part in any ML workflow. Performing continuous evaluation can help you catch model drift, a phenomenon that occurs when the data used to train your model no longer reflects the current environment.
To learn more about how to do continuous model evaluation and re-train models, you can read the blogpost: Continuous model evaluation with BigQuery ML, Stored Procedures, and Cloud Scheduler
More resources
If you’d like to learn more about any of the topics covered in this post, check out these resources:
- BigQuery export of Google Analytics data
- BigQuery ML quickstart
- Events automatically collected by Google Analytics 4
- Qwiklabs: Create ML models with BigQuery ML
Or learn more about how you can use BigQuery ML to easily build other machine learning solutions:
- How to build demand forecasting models with BigQuery ML
- How to build a recommendation system on e-commerce data using BigQuery ML
Let us know what you thought of this post, and if you have topics you’d like to see covered in the future! You can find us on Twitter at @polonglin and @_mkazi_.Thanks to reviewers: Abhishek Kashyap, Breen Baker, David Sabater Dinter.
Why and How to Migrate to Google BigQuery

5360
Of your peers have already read this article.
6:30 Minutes
The most insightful time you'll spend today!
Over the past few decades, organizations have mastered the science of data warehousing. They have increasingly applied descriptive analytics to large quantities of stored data, gaining insight into their core business operations. Conventional Business Intelligence (BI), which focuses on querying, reporting, and Online Analytical Processing, might have been a differentiating factor in the past, either making or breaking a company, but it’s no longer sufficient.
Today, not only do organizations need to understand past events using descriptive analytics, they need predictive analytics, which often uses machine learning (ML) to extract data patterns and make probabilistic claims about the future. The ultimate goal is to develop prescriptive analytics that combine lessons from the past with predictions about the future to automatically guide real-time actions.
Traditional data warehouse practices capture raw data from various sources, which are often Online Transactional Processing (OLTP) systems. Then, a subset of data is extracted in batches, transformed based on a defined schema, and loaded into the data warehouse. Because traditional data warehouses capture a subset of data in batches and store data based on rigid schemas, they are unsuitable for handling real-time analysis or responding to spontaneous queries. Google designed BigQuery in part in response to these inherent limitations.
Innovative ideas are often slowed by the size and complexity of the IT organization that implements and maintains these traditional data warehouses. It can take years and substantial investment to build a scalable, highly available, and secure data warehouse architecture. BigQuery offers sophisticated software as a service (SaaS) technology that can be used for serverless data warehouse operations. This lets you focus on advancing your core business while delegating infrastructure maintenance and platform development to Google Cloud.
BigQuery offers access to structured data storage, processing, and analytics that’s scalable, flexible, and cost effective. These characteristics are essential when your data volumes are growing exponentially—to make storage and processing resources available as needed, as well as to get value from that data. Furthermore, for organizations that are just starting with big data analytics and machine learning, and that want to avoid the potential complexities of on-premises big data systems, BigQuery offers a pay-as-you-go way to experiment with managed services.
With BigQuery, you can find answers to previously intractable problems, apply machine learning to discover emerging data patterns, and test new hypotheses. As a result, you have timely insight into how your business is performing, which enables you to modify processes for better results. In addition, the end user’s experience is often enriched with relevant insights gleaned from big data analysis, as we explain later in this series.
The migration framework
Undertaking a migration can be a complex and lengthy endeavor. Therefore, we recommend adhering to a framework to organize and structure the migration work in phases:
- Prepare and discover: Prepare for your migration with workload and use case discovery.
- Assess and plan: Assess and prioritize use cases, define measures of success, and plan your migration.
- Execute: Iterate the following steps for each use case:
- Migrate (offload): Migrate only your data, schema, and downstream business applications.
- Migrate (full): Alternatively, migrate the use case fully end-to-end. The same as Migrate (offload), with the addition of the upstream data pipelines.
- Verify and validate: Test and validate the migration to assess return on investment.
The following diagram illustrates the recommended framework and shows how the different phases are connected:

For a deeper understanding, read Migrating data warehouses to BigQuery: Introduction and overview
Firestore Cheatsheet to Unlock Application Innovation

3725
Of your peers have already read this article.
2:00 Minutes
The most insightful time you'll spend today!
Your product teams might ask – “Why does it take so long to build a feature or application?” Building applications is a heavy lift due to the technical complexity, which includes the complexity of backend services that are used to manage and store data. Every moment focused on this technical complexity is a distraction from delivering on core business value. Firestore alters this by having Google Cloud manage your backend complexity through a complete backend-as-a-service!
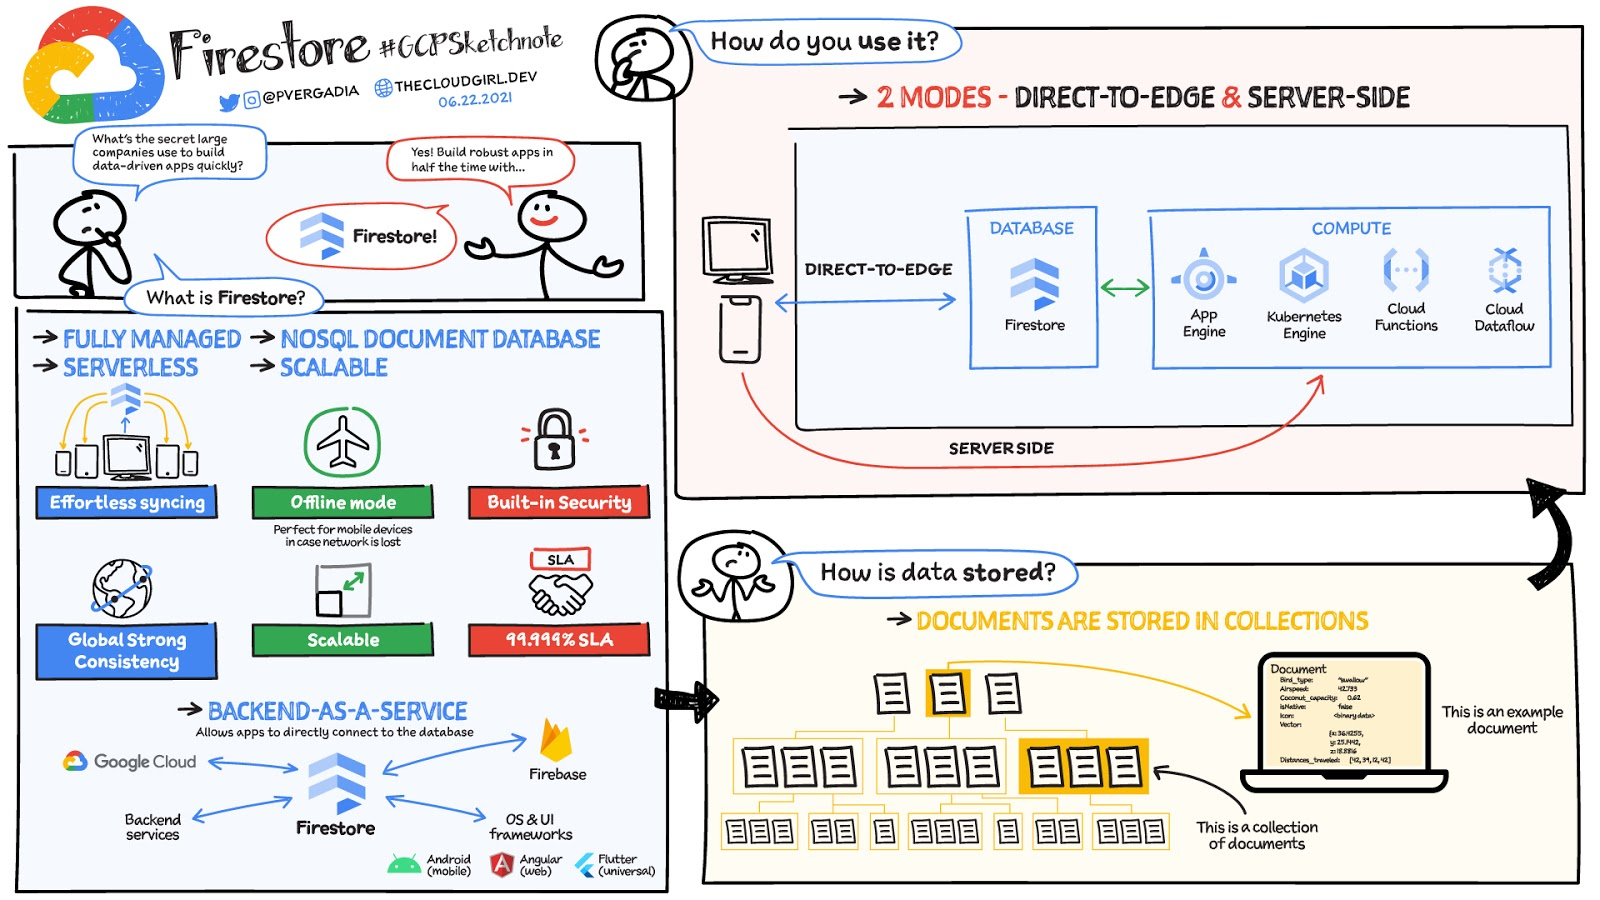
Firestore is a serverless, NoSQL document database that unlocks application innovation with simplicity, speed and confidence.
It acts as a glue that intelligently brings together the complete Google Cloud backend ecosystem, in-app services from Firebase and core UI frameworks & OS from Google.
What is Firestore?
Firestore is a serverless, fully managed NoSQL document database that scales from zero to global scale without configuration or downtime. Here’s what makes Firestore unique:
- Ideal for rapid, flexible and scalable web and mobile development with direct connectivity to the database.
- Supports effortless real time data synchronization with changes in your database as they happen.
- Robust support for offline mode, so your users can keep interacting with your app even when the internet isn’t available or is unreliable.
- Fully customizable security and data validation rules to ensure the data is always protected
- Built-in strong consistency, elastic scaling, high performance & best in class 99.999% availability
- Integration with Firebase and Google Cloud services like Cloud Functions and BigQuery, serverless data warehouse.
- In addition to a rich set of Google Cloud service integrations, Firestore also offers deep one-click integrations with a growing set of 3rd party partners via Firebase Extensions to help you even more rapidly build applications.
Document-model database

Firestore is a Document-model database. All of your data is stored in “documents” and then “collections”. You can think of a document as a JSON object. It’s a dictionary with a set of key-value mappings, where the values can be several different supported data types including strings, numbers or binary values..
These documents are stored in collections. Documents can’t directly contain other documents, but they can point to subcollections that contain other documents, which can point to subcollections, and so on. This structure brings with it a number of advantages. For starters, all queries that you make are shallow, meaning that you can grab a document without worrying about grabbing all the data underneath it. And this means that you can structure your data hierarchically in a way that makes sense to you logically, without having to worry about grabbing tons of unnecessary data.
How to use Firestore?
Firestore can be used in two modes:
- Firestore in Native Mode: This mode is differentiated by its ability to directly connect your web & mobile app to Firestore. Native Mode supports up to 10K writes per second, and over a million connections.
- Firestore in Datastore Mode: This mode supports only server-side usage of Firestore, but supports unlimited scaling, including writes.
Conclusion
Whatever your application use case may be, if you want to build a feature or an application quickly using Firestore backend-as-a-service. For a more in-depth look into Firestore check out the documentation. https://www.youtube.com/embed/moglAjmwmUQ?enablejsapi=1&
For more #GCPSketchnote, follow the GitHub repo. For similar cloud content follow me on Twitter @pvergadia and keep an eye out on thecloudgirl.dev.
Gartner Magic Quadrant: Google Cloud a Leader in Operational DB Management Systems

4037
Of your peers have already read this article.
2:15 Minutes
The most insightful time you'll spend today!
We’re pleased to announce that Gartner has named Google Cloud a Leader in its 2019 Magic Quadrant report for Operational Database Management Systems (OPDBMS). This news reflects what we hear from our customers: that Google Cloud databases are flexible, open, and easy to use.
These include our fully compatible managed services for popular database engines like MySQL, PostgreSQL, SQL Server and Redis, and scalable cloud-native relational and non-relational databases like Cloud Spanner, Cloud Bigtable, and Cloud Firestore, plus fully managed partner services like MongoDB Atlas, Elastic, and Redis Enterprise. You can also run proprietary database workloads on Google Compute Engine or via our Bare Metal Solution.
Enterprises databases in production
We’ve heard great stories from our customers about their use of Google Cloud databases to run their businesses with ease and flexibility. Our database products meet varying needs for scalability and power.
Gaming company Bandai Namco Entertainment needed fast scalability, a global network, and real-time analytics to serve users its Dragon Ball Legends game. They were initially considering sharded MySQL to handle the scale, but opted for Cloud Spanner. Because it’s strongly consistent, fully managed, and scales seamlessly, Cloud Spanner supported the game’s rollout and allowed millions of worldwide players to compete without downtime.
And media leader The New York Times found our Cloud Firestore database service as they built a truly real-time collaboration tool that lets multiple writers and editors make changes in docs at the same time, keeping track of what’s newest. Cloud Firestore is designed for just this type of task, since it supports offline and real-time sync.
E-commerce brand analytics and protection company 3PM Solutions empowers global brands to manage, protect, and grow revenue by using Google Cloud Platform services such as Cloud Bigtable. Using Google Cloud, they’ve been able to analyze 160 million customer reviews of more than 2 million sellers in less than four hours.
Leanplum built its cloud-native marketing platform on Google Cloud to help marketers personalize and orchestrate cross-channel customer engagement campaigns at scale. “
We were looking for cost-effective cloud services that can reduce engineers’ overhead associated with managing infrastructure,” says Athena Koutsonikolos, Leanplum’s VP of marketing. “Using fully managed services like Cloud SQL, developers can now focus on building what matters to our customers.”
Gartner 2019 Magic Quadrant for Operational Database Management Systems – November 25, 2019, Merv Adrian, Donald Feinberg, Henry Cook.
Gartner does not endorse any vendor, product or service depicted in its research publications, and does not advise technology users to select only those vendors with the highest ratings or other designation. Gartner research publications consist of the opinions of Gartner’s research organization and should not be construed as statements of fact. Gartner disclaims all warranties, express or implied, with respect to this research, including any warranties of merchantability or fitness for a particular purpose.
More Relevant Stories for Your Company

Harnessing the Power of Data and AI to Transform Life Science Supply Chains
Global life science supply chains are lengthy and complex with many moving parts. One small disruption can create serious delays and affect your ability to deliver therapeutics for patients. Supply chain disruptors Over the last few years, healthcare organizations have encountered a range of obstacles, from both internal and external

Quantum Metric Increases Business 10-fold
At Quantum Metric, we’re in the business of bringing our customers business insights that are based on customer experience data and analytics for mid-market and Fortune 500 companies. Our software, powered by big data, machine intelligence, and Google Cloud, helps our customers identify, quantify, prioritize and measure opportunities to improve

How Constellation Brands’ Direct-to-Customer Tech Delivers Economic Impact across Business Portfolio
Editor’s note: Today we’re hearing from Ryan Mason, Director, Head of DTC Growth & Strategy, at alcoholic beverage firm, Constellation Brands on the company’s shift to Direct-to-Consumer (DTC) sales and how Google Cloud’s powerful technology stack helped with this transformation. It’s no secret that consumer businesses have been up-ended in

Using Google Cloud’s Backup and DR Service with Logging and Monitoring Tools
Backup and DR data is a valuable business asset, and ensuring that it’s safe and accessible is essential. In particular, you want to be able to monitor your backups to ensure that the data is indeed protected and that you can quickly recover it in the event of a disaster,
