





How to Choose the Right ML Model for Your Applications
4891
Of your peers have already read this article.
2:00 Minutes
The most insightful time you'll spend today!
Many of our customers want to know how to choose a technology stack for solving problems with machine learning (ML). There are many choices for these solutions available, some that you can build and some that you can buy. We’ll be focusing on the build side here, exploring the various options and the problems they solve, along with our recommendations.
The best ML applications are trained with the largest amount of data
But first, keep in mind an important concept: the quality of your ML model improves with the size of your data. Dramatic ML performance and accuracy are driven by improvements in data size, as shown in the graph below. This is a text model, but the same principles hold for all kinds of ML models.
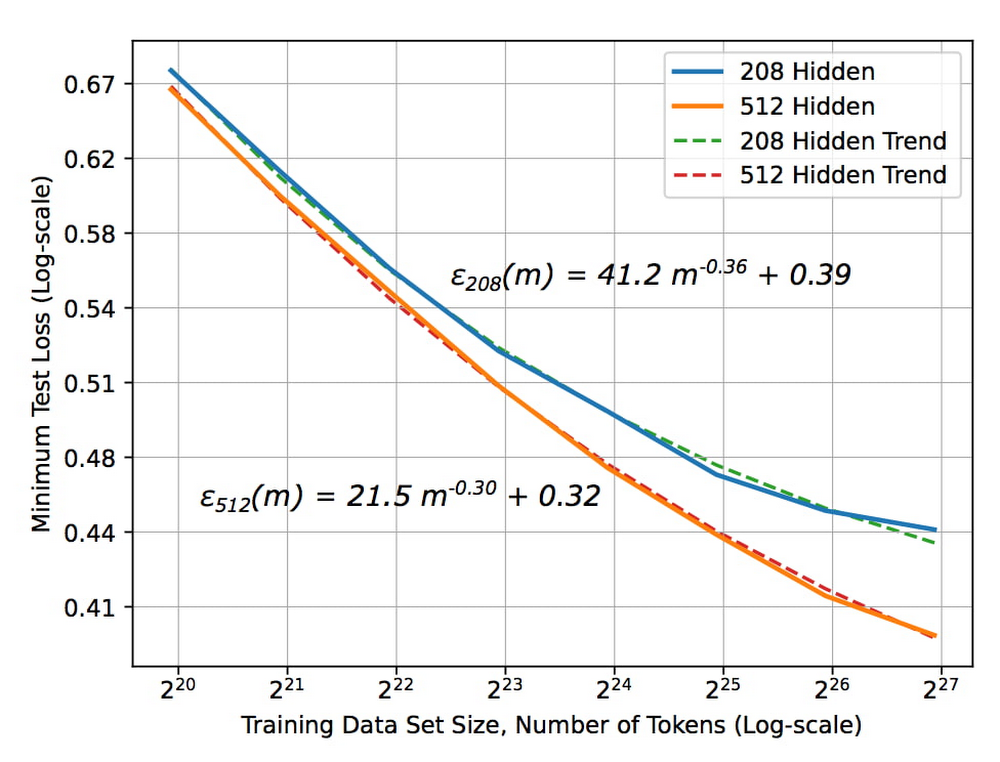
The X axis represents the size of the data set and the Y axis is the error rate. As the size of the data set increases, the error rate drops. But notice something critical about the size of the data set — the x-axis is2^20, 2^21, 2^ 22, etc. In other words, each new tic here is a doubling of the data set size. To get a linear decrease in your error rate you need to exponentially increase the size of your data set.
The blue curve in the graph represents a slightly more sophisticated ML model than the orange curve. Suppose you are deciding between two choices: create a better model or double the data set size. Assuming that these two choices cost the same, it’s better to keep gathering more data. It’s only when improvements due to data size increases start to plateau that it becomes necessary to build a better model.
Secondly, ML systems need to be retrained for new situations. For example, if you have a recommendation system in YouTube and you want to provide recommendations in Google Now, you can’t use the same recommendations model. You have to train it in the second instance on the recommendations you want to make in Google Now. So even though the model, the code, and the principles are the same, you have to retrain the model with new data for new situations.
Now, let’s combine these two concepts: you get a better ML model when you have more data, and an ML model typically needs to be retrained for a new situation. You have a choice of either spending your time building an ML model or buying a vendor’s off-the-shelf model.
To answer the question of whether to buy or whether to build, first determine if the buyable model is solving the same problem that you want to solve. Has it been trained on the same input and on similar labels? Let’s say you’re trying to do a product search, and the model has been trained on catalog images as inputs. But you want to do a product search based on users’ mobile phone photographs of the products. The model that was trained on catalog images won’t work on your mobile phone photographs, and you’d have to build a new model.
But let’s say you’re considering a vendor’s translation model that’s been trained on speeches in the European Parliament. If you want to translate similar speeches, the model works well as it uses the same kind of data.
The next question to ask: does the vendor have more data than you do? If the vendor has trained their model on speeches in the European Parliament but you have access to more speech data than they have, you should build. If they have more data, then we recommend buying their model.
Bottom line: buy the vendor’s solution if it’s trained on the same problem and has access to more data than you do.
Technology stack for common ML use cases
If you need to build, what is the technology stack you need? What are the skills your people need to develop? This depends on the type of problem you are solving. There are four broad categories of ML applications: predictive analytics, unstructured data, automation, and personalization. The recommended technology stack for each is slightly different.
Predictive analytics
Predictive analytics includes detecting fraud, predicting click-through rates, and forecasting demand.
Step one: build an enterprise data warehouse
Here, your data set is primarily structured data, so our recommended first step is to store your data in an enterprise data warehouse (EDW). Your EDW is a source of training examples and product histories tracked over time, and can break down silos and gather data from throughout your organization.
Step two: get good at data analytics
Next, you’d build a data culture, get skilled at data analytics, start to build dashboards, and enable data-driven decisions. At this point, you have all of the data and you know which pieces are trustworthy.
Step three: build ML
From your EDW, you can build your models using SQL pipelines. We recommend using BigQuery ML when doing ML with the data in your EDW. If you want to build a more sophisticated model, you can train TensorFlow/Keras models on BigQuery data. A third option is AutoML tables for state-of-the-art accuracy and for building online microservices.
Unstructured data
Examples of how our customers use ML to gain insights from unstructured data include annotating videos, identifying eye diseases, and triaging emails. Unstructured data can include videos, images, natural language, and text. Deep learning has revolutionized the way we do ML on unstructured data, whether you’re looking at language understanding, image classification, or speech-to-text.
For unstructured data, the models you use will employ deep learning. Here, the ROI heavily favors using AutoML. The amount of time that you’d spend trying to create a new ML model from scratch is almost never worth it. You can spend your money more effectively collecting more data than trying to get a slightly better model. Regardless of the type of unstructured data, our recommendation is to use AutoML for small and medium size data sizes.
But AutoML has a limit to scale. At some point, the size of your data set is going to be so large that architecture search is going to get really expensive. At that point, you may want to go to a best-of-breed model with custom retraining from TensorFlow Hub, for example. If you have data sets that are in the millions of examples, you can build your own custom neural network (NN) architectures. But determine if your data set size has started to plateau, by plotting a graph similar to the one at the top of this post. Build a custom NN architecture only after you’ve plateaued, where increasing amounts of data won’t give you a better model.
Automation
Some examples of how customers are using ML for automation include scheduling maintenance, counting retail footfall, and scanning medical forms. The key thing to keep in mind as you pick a technology stack for these problems is that you’re not building just one ML model. If you want to schedule maintenance orwant to reject transactions, for example, you’ll need to train multiple linked models.
Instead of individual models, think in terms of ML pipelines, which you can orchestrate using all of the technologies already mentioned. Then you have three choices for operationalizing, with three levels of sophistication.
- Vertex AI has turnkey serverless training and batch/online predictions. This is what is recommended for a team of data scientists. .
- Deep Learning VM Image, Cloud Run, Cloud Functions or Dataflow feature customized training and batch/online predictions. This is what is recommended if the team consists of data engineers and scientists.
- Vertex AI Pipelines are fully customizable and recommended for organizations with separate ML engineering and data science teams.
When doing automation, the individual models that you chain together into a pipeline will be a mix – some will be prebuilt, some will be customized, and others will be built from scratch. Vertex AI, by providing a unified interface for all these model types, simplifies the operationalization of these models.
Personalization
ML application examples of personalization include customer segmentation, customer targeting, and product recommendations. For personalization, we again recommend using an EDW, because customer segmentation uses structured marketing data. For product recommendations, you will similarly have prior purchases and web logs in your EDW., You can power clustering applications, or recommendation systems like matrix factorization, and create embeddings directly from your EDW for sophisticated recommendation systems.
For specific use cases, choose the technology stack based on your data size and scope. Start with BigQuery ML for its quick, easy matrix factorization approach. Once your application proves viable and you want a slightly better accuracy, then try AutoML recommendations. But once your data set grows beyond the capabilities of AutoML recommendations, consider training your own custom TensorFlow and Keras models.
To summarize, successful ML starts with the question, “Do I build or do I buy?” If an off-the-shelf solution exists that was trained with similar data and with access to more data than you have, then buy it. Otherwise build it, using the technology stack recommended above for the four categories of ML applications.
Learn more about our artificial intelligence (AI) and ML solutions and check out sessions from our Applied ML Summit on-demand.
3371
Of your peers have already watched this video.
31:30 Minutes
The most insightful time you'll spend today!
Contact Center AI: The State of the Union
Did you know 31% of CIOs say that they have already deployed conversational AI platforms? And that this represents a 50% year on year growth?
Much of this is driven by customer preferences. By 2023, customers will prefer speech interfaces to initiate self-service activities. Additionally, by 2023, 40 percent of contact center interactions will be fully automated by AI.
Here are the facts: The latest advances in voice AI are opening the door to a massive transformation of customer experiences. The revolution driven by Contact Center AI (CCAI) is here today and you can benefit from it quickly.
Hear about the state of the Google CCAI offering through real-life customer stories.

4914
Of your peers have already downloaded this article
1:30 Minutes
The most insightful time you'll spend today!
Artificial intelligence and machine learning are already transforming the technological landscape. From digital assistants to image-recognition software to self-driving cars, what was once the stuff of science fiction is now becoming a reality. But what exactly does it mean for marketing and advertising executives?
It could get us closer to one of advertising’s most-sought goals: relevance at scale. Before then, we’re going to see changes to the way we do business.
Technological advances have always created new opportunities for storytelling and marketing. Just as the advent of TV brought an era of truly mass advertising and reach, and the internet and mobile brought a new level of targeting and context, AI will change how people interact with information, technology, brands, and services.
A big part of the opportunity for marketers is how AI will help us fully realize personalization—and relevance—at scale. With platforms like Search and YouTube reaching billions of people everyday, digital ad platforms finally can achieve communication at scale. This scale, combined with customization possible through AI, means we’ll soon be able to tailor campaigns to consumer intent in the moment. It will be like having a million planners in your pocket.
Find out how you can achieve relevance at scale. Download now!
IKEA’s AI-driven Personalized and Real-time Recommendations Up its Conversion Rates and Average Order Value

4886
Of your peers have already read this article.
3:00 Minutes
The most insightful time you'll spend today!
Background
At IKEA we have multiple places in our customer journey in various channels where different kinds of personalization can deliver a superior customer experience. Product recommendations in the shopping basket, content recommendations in editorial sections, inspirational recommendations on product pages and more. After a while in the broader “recommendations” team there was a decision to split the team to have one sub-team focused on product recommendations. The pandemic altered customer behavior and needs as well. At that inflection point we decided to change our way of working and dive head-first into a more scientific approach to handle the operational complexities of delivering high quality product recommendations at scale. We deemed this necessary to improve our level of personalization and to have a holistic understanding of our customers.
Data Driven Decisions
The first step was to radically improve our ability to get high-quality quantitative information to understand how our ‘recommendation’ solutions affected personalization. We did this through high volume A/B testing on customer behaviour and after initial experimentation, we had a few key learnings:
- The mix of both UX and algorithms are really important for a cohesive customer experience.
- The quality of personalization can’t be measured in silos. Statistical significance can be attained by testing several groups of recommendations at once.
Once we came up with a solid framework for gathering data and acknowledged how little we knew about our customers, we were able to explore an incredible number of creative options – nothing was off the table. This was a very humbling experience, in that it opened up new perspectives for personalization, a more curious and less confined way of thinking. We learned to trust the data because it might show you things you don’t expect.
Experimentation and Learning Framework
Our teams created ways to quickly deploy experimental modifications to our existing solution. This enabled experimentation in the front-end with the user experience, including details in headings and images. This also covered tweaks in the backend with anything from detailed manual additions or removals of recommendations to mixing and matching of various algorithms both home grown and from Recommendations AI.
This flexibility came with an overhead–more complexity and cost relative to directly retrieving recommendations from Recommendations AI. However, the benefit was that we were no longer dependent on manual evaluation of what made for a good recommendation system. We aligned on a data-driven and qualitative approach to provisioning recommendations and significantly accelerated our experimentation timeline. Together with optimization of the CI/CD pipeline this enabled the team to take an idea or hypothesis from inception to A/B testing with customers in less than half an hour.
Recommendations AI Experiments
Our team’s infrastructure was already running on GCP and when we received early access to Recommendations AI, the requirements to get started were minimal and that allowed us to start with initial tests requiring minimal effort and investment.
We started with a few use-cases and identified places where our existing recommendation algorithms needed improvement or complementary recommendations. We also explored additional ways where more useful information could be presented to the customers through personalized recommendations.
Recommendations AI Model Combinations
While Recommendations AI might be considered a simple API to get a set of product recommendations, as we dove deeper into the solution it became apparent that it could be tweaked in several different ways to offer many fine tuning configurations to meet business goals. While too much fine tuning and customization could lead to subpar performance, in general we found that it was a great strategy to give us several versions of ML powered recommendations to work with. The further you personalize the experience, the more options you have to likely pick the best one for the customer.
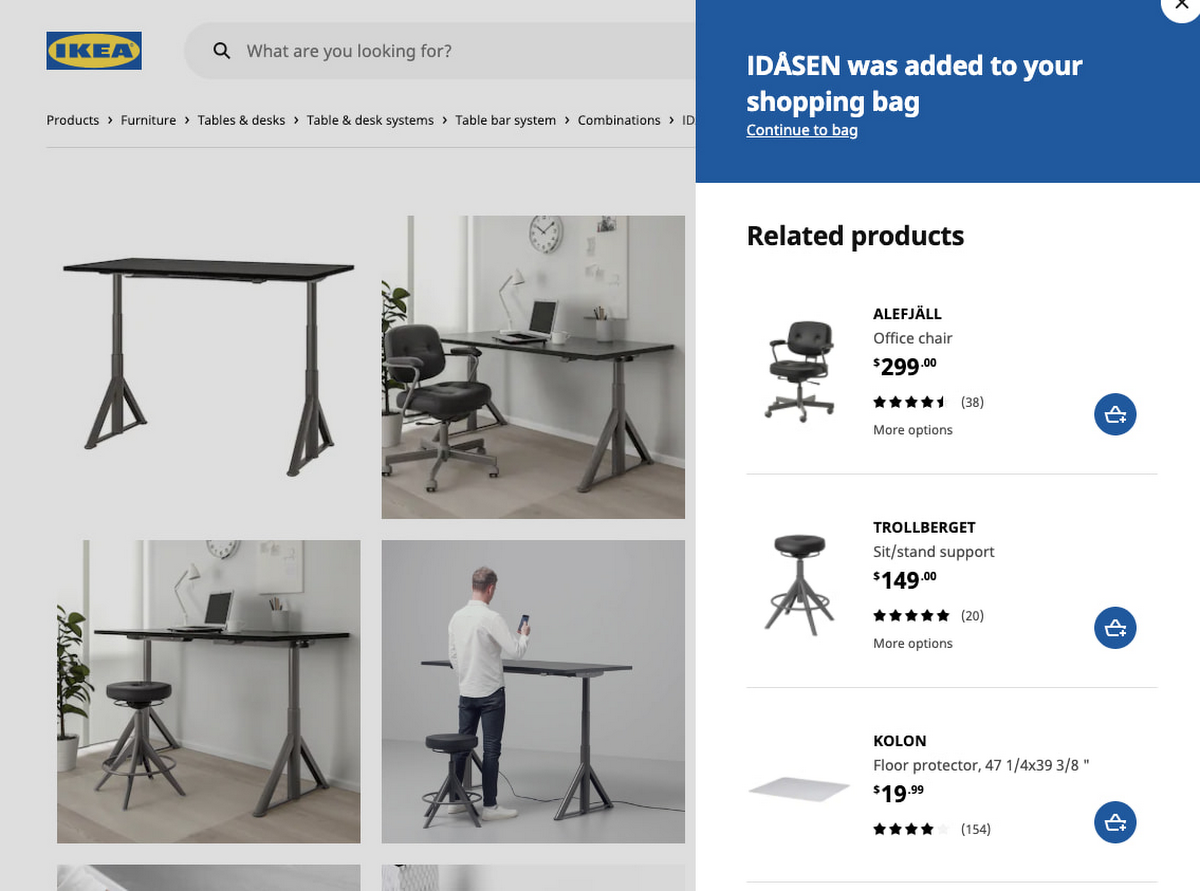
Recommendations AI models like ‘Recommended for you’, ‘Frequently Bought Together’ and ‘Others you may like’; are coupled with business goals like optimizing for conversion rate, click through rate and revenue. We experimented with many different model combinations and custom rules. All this was easily configurable right in the GCP console. One of the simplest custom configurations we used was to only recommend items that were in stock, and when items were out of stock we looked at similar items that were available to augment the experience.
Collaboration with Google
Our collaboration with Google Cloud accelerated our learning process during experimentation. We worked closely together early in the product development. Additionally, their model provided flexibility to change direction and allow for more options than we had previously. Ultimately, this provided us a way to drastically improve our time to market with a product that produced tremendous results that we could not have accomplished on our own.
Results and Takeaways
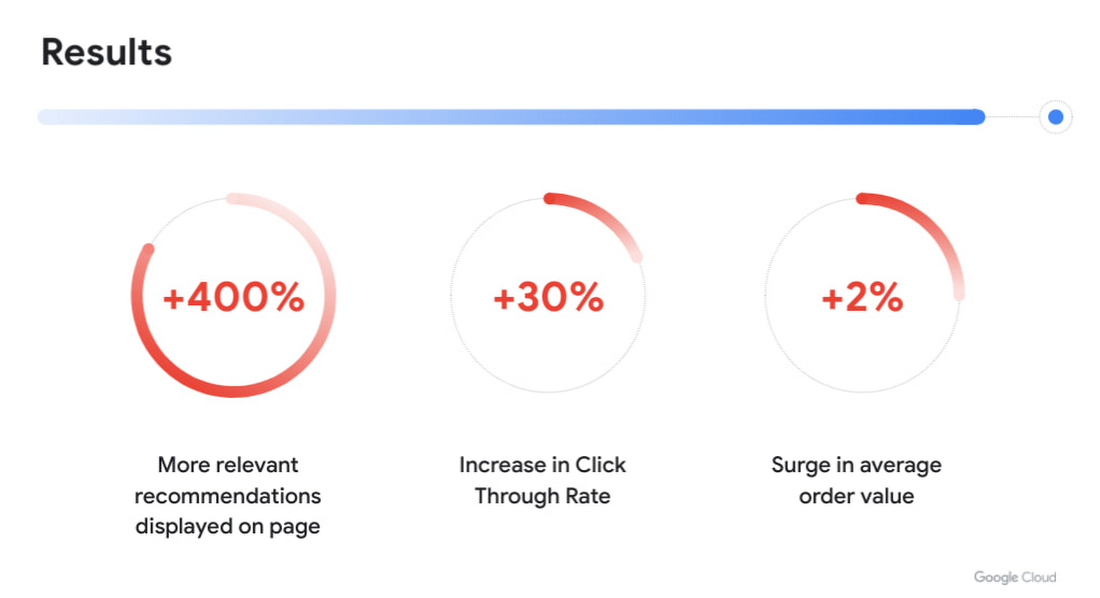
With more personalized and real-time recommendations available we saw great success. We were able to increase the number of relevant recommendations displayed on a page by +400%. To accommodate the wider repertoire of recommendations we had to change the user experience. For example, in some places we had horizontally scrolling displays of product recommendations which were much easier for customers to use.
Another consequence of displaying more personalized recommendations was tangible improvement to conversion rate and average order value. Recommendations AI algorithms helped customers in two ways:
- Customers were able to find products that they liked quickly and establish their preferred choice among other options more quickly as well, giving them confidence to make a purchase through much fewer clicks. Even though we previously already had well tuned recommendations of several types, with Recommendations AI we measured +30% improvement in click through rates.
- Average order value saw a +2% surge with numerous examples of how Recommendations AI could help customers find both attractive and directly complementary products, expanding the customer purchase from a single product to an entire home furnishing solution.
As a direct effect of having stronger business results, the team started exploring more places in the customer journey where our growing buffet of recommendations could be used. We’d start with an initial experiment to answer if displaying recommendations in the specific context made sense at all. Frequently the data that emerged from these experiments prodded us to iterate further on what additional types of recommendations would be most appropriate to show to the customer as the customer’s behaviour evolved. Today, most of IKEA’s site recommendations are powered by Recommendations AI.
One key takeaway is that for some types of personalized recommendations there are benefits to using advanced algorithms that require a lot of high level data science and engineering competence to build since they outperform simplistic approaches. In some places, simplistic approaches work very well and in others the right decision is to not have product recommendations at all. For an effective use of product recommendations you need to have all the above options and the ability to tell when to use which one.
Next steps
When working with something so tightly related to customer experience, there is a constant change in user behaviour and new learnings to observe and adapt to. Product recommendations are rarely the main stand alone experience and frequently something that is used to help and enhance an experience. We see a lot of value in having a large toolbox of possible options and a team with a relentless focus on collaboration to improve the customer experience. We’re working directly with the Recommendations AI team and experimenting with several new features that we’re excited about.
In the future we see opportunities of improving the customer journey through a more visual experience that inspires the customer rather than relying on customers to use their imagination to visualize groups of products together. Vision Product Search provides that and is something we’re looking into deploying next. We’ll be sharing more about our journey with Recommendations AI at the Google Cloud Retail Summit session ‘IKEA’s Approach to Building a Powerful Recommendations Engine’ on July 27th 2021.
Best wishes to all developers from the IKEA product recommendations team & the Google Recommendations AI team!
6552
Of your peers have already watched this video.
24:00 Minutes
The most insightful time you'll spend today!
Swarovski’s Journey towards Online and Offline Conversion with Predictive Analytics
Luxury brand and leader in crystals and glass production, Swarovski has charmed customers with its exquisite collections for over 125 years. To understand their customers better and map their online behaviors, Swarovski had to overcome prediction hurdles as majority of the purchases are not frequent or habitual. They are mostly impulse buys or have no rational behind the purchase in order for the brand to accurately map customers’ interest and delight them with relevant personalization or website customization strategy.
Swarovski used a machine learning (ML) model to predict the most performing SKUs and list of products based on both online and offline indicators to target buyers. A score was assigned to each product in the list and was personalized at the country level that delivered relevant insights. Swarovski is aiming to expand the product listing page to personalize at customer level. Watch the video to dive deep into Swarovski’s data analytics efforts to answer complex questions, reporting and prediction using both online and offline data.
New Capabilities in BigQuery to Ease Anomalies Detection in the Absence of Labeled Data

6347
Of your peers have already read this article.
4:00 Minutes
The most insightful time you'll spend today!
When it comes to anomaly detection, one of the key challenges that many organizations face is that it can be difficult to know how to define what an anomaly is. How do you define and anticipate unusual network intrusions, manufacturing defects, or insurance fraud? If you have labeled data with known anomalies, then you can choose from a variety of supervised machine learning model types that are already supported in BigQuery ML. But what can you do if you don’t know what kind of anomaly to expect, and you don’t have labeled data? Unlike typical predictive techniques that leverage supervised learning, organizations may need to be able to detect anomalies in the absence of labeled data.
Today we are announcing the public preview of new anomaly detection capabilities in BigQuery ML that leverage unsupervised machine learning to help you detect anomalies without needing labeled data. Depending on whether or not the training data is time series, users can now detect anomalies in training data or on new input data using a new ML.DETECT_ANOMALIES function (documentation), with the following models:
- Autoencoder model, now in Public Preview (documentation)
- K-means model, already GA (documentation)
- ARIMA_PLUS time series model, already GA (documentation)
How does anomaly detection with ML.DETECT_ANOMALIES work?
To detect anomalies in non-time-series data, you can use:
- K-means clustering models: When you use
ML.DETECT_ANOMALIESwith a k-means model, anomalies are identified based on the value of each input data point’s normalized distance to its nearest cluster. If that distance exceeds a threshold determined by the contamination value provided by the user, the data point is identified as an anomaly. - Autoencoder models: When you use
ML.DETECT_ANOMALIESwith an autoencoder model, anomalies are identified based on the reconstruction error for each data point. If the error exceeds a threshold determined by the contamination value, it is identified as an anomaly.
To detect anomalies in time-series data, you can use:
- ARIMA_PLUS time series models: When you use
ML.DETECT_ANOMALIESwith an ARIMA_PLUS model, anomalies are identified based on the confidence interval for that timestamp. If the probability that the data point at that timestamp occurs outside of the prediction interval exceeds a probability threshold provided by the user, the datapoint is identified as an anomaly.
Below we show code examples of anomaly detection in BigQuery ML for each of the above scenarios.
Anomaly detection with a k-means clustering model
You can now detect anomalies using k-means clustering models, by running ML.DETECT_ANOMALIES to detect anomalies in the training data or in new input data. Begin by creating a k-means clustering model:
Language: SQL
CREATE MODEL `mydataset.my_kmeans_model`OPTIONS(MODEL_TYPE = 'kmeans',NUM_CLUSTERS = 8,KMEANS_INIT_METHOD = 'kmeans++') ASSELECT* EXCEPT(Time, Class)FROM`bigquery-public-data.ml_datasets.ulb_fraud_detection`;
With the k-means clustering model trained, you can now run ML.DETECT_ANOMALIES to detect anomalies in the training data or in new input data.
To detect anomalies in the training data, use ML.DETECT_ANOMALIES with the same data used during training:
Language: SQL
SELECT*FROMML.DETECT_ANOMALIES(MODEL `mydataset.my_kmeans_model`,STRUCT(0.02 AS contamination),TABLE `bigquery-public-data.ml_datasets.ulb_fraud_detection`);

To detect anomalies in new data, use ML.DETECT_ANOMALIES and provide new data as input:
Language: SQL
SELECT*FROMML.DETECT_ANOMALIES(MODEL `mydataset.my_kmeans_model`,STRUCT(0.02 AS contamination),(SELECT * FROM `mydataset.newdata`));

How does anomaly detection work for k-means clustering models?
Anomalies are identified based on the value of each input data point’s normalized distance to its nearest cluster, which, if exceeds a threshold determined by the contamination value, is identified as an anomaly. How does this work exactly? With a k-means model and data as inputs, ML.DETECT_ANOMALIES first computes the absolute distance for each input data point to all cluster centroids in the model, then normalizes each distance by the respective cluster radius (which is defined as the standard deviation of the absolute distances of all points in this cluster to the centroid). For each data point, ML.DETECT_ANOMALIES returns the nearest centroid_id based on normalized_distance, as seen in the screenshot above. The contamination value, specified by the user, determines the threshold of whether a data point is considered an anomaly. For example, a contamination value of 0.1 means that the top 10% of descending normalized distance from the training data will be used as the cut-off threshold. If the normalized distance for a datapoint exceeds the threshold, then it is identified as an anomaly. Setting an appropriate contamination will be highly dependent on the requirements of the user or business.
For more information on anomaly detection with k-means clustering, please see the documentation here.
Anomaly detection with an autoencoder model
You can now detect anomalies using autoencoder models, by running ML.DETECT_ANOMALIES to detect anomalies in the training data or in new input data.
Begin by creating an autoencoder model:
Language: SQL
CREATE MODEL `mydataset.my_autoencoder_model`OPTIONS(model_type='autoencoder',activation_fn='relu',batch_size=8,dropout=0.2,hidden_units=[32, 16, 4, 16, 32],learn_rate=0.001,l1_reg_activation=0.0001,max_iterations=10,optimizer='adam') ASSELECT* EXCEPT(Time, Class)FROM`bigquery-public-data.ml_datasets.ulb_fraud_detection`;
To detect anomalies in the training data, use ML.DETECT_ANOMALIES with the same data used during training:
Language: SQL
SELECT*FROMML.DETECT_ANOMALIES(MODEL `mydataset.my_autoencoder_model`,STRUCT(0.02 AS contamination),TABLE `bigquery-public-data.ml_datasets.ulb_fraud_detection`);

To detect anomalies in new data, use ML.DETECT_ANOMALIES and provide new data as input:
Language: SQL
SELECT*FROMML.DETECT_ANOMALIES(MODEL `mydataset.my_autoencoder_model`,STRUCT(0.02 AS contamination),(SELECT * FROM `mydataset.newdata`));

How does anomaly detection work for autoencoder models?
Anomalies are identified based on the value of each input data point’s reconstructed error, which, if exceeds a threshold determined by the contamination value, is identified as an anomaly. How does this work exactly? With an autoencoder model and data as inputs, ML.DETECT_ANOMALIES first computes the mean_squared_error for each data point between its original values and its reconstructed values. The contamination value, specified by the user, determines the threshold of whether a data point is considered an anomaly. For example, a contamination value of 0.1 means that the top 10% of descending error from the training data will be used as the cut-off threshold. Setting an appropriate contamination will be highly dependent on the requirements of the user or business.
For more information on anomaly detection with autoencoder models, please see the documentation here.
Anomaly detection with an ARIMA_PLUS time-series model

With ML.DETECT_ANOMALIES, you can now detect anomalies using ARIMA_PLUS time series models in the (historical) training data or in new input data. Here are some examples of when might you want to detect anomalies with time-series data:
Detecting anomalies in historical data:
- Cleaning up data for forecasting and modeling purposes, e.g. preprocessing historical time series before using them to train an ML model.
- When you have a large number of retail demand time series (thousands of products across hundreds of stores or zip codes), you may want to quickly identify which stores and product categories had anomalous sales patterns, and then perform a deeper analysis of why that was the case.
Forward looking anomaly detection:
- Detecting consumer behavior and pricing anomalies as early as possible: e.g. if traffic to a specific product page suddenly and unexpectedly spikes, it might be because of an error in the pricing process that leads to an unusually low price.
- When you have a large number of retail demand time series (thousands of products across hundreds of stores or zip codes), you would like to identify which stores and product categories had anomalous sales patterns based on your forecasts, so you can quickly respond to any unexpected spikes or dips.
How do you detect anomalies using ARIMA_PLUS? Begin by creating an ARIMA_PLUS time series model:
Language: SQL
CREATE OR REPLACE MODEL mydataset.my_arima_plus_modelOPTIONS(MODEL_TYPE='ARIMA_PLUS',TIME_SERIES_TIMESTAMP_COL='date',TIME_SERIES_DATA_COL='total_amount_sold',TIME_SERIES_ID_COL='item_name',HOLIDAY_REGION='US') ASSELECTdate,item_description AS item_name,SUM(bottles_sold) AS total_amount_soldFROM`bigquery-public-data.iowa_liquor_sales.sales`GROUP BYdate,item_nameHAVINGdate BETWEEN DATE('2016-01-04') AND DATE('2017-06-01')AND item_name IN ("Black Velvet", "Captain Morgan Spiced Rum","Hawkeye Vodka", "Five O'Clock Vodka", "Fireball Cinnamon Whiskey");
To detect anomalies in the training data, use ML.DETECT_ANOMALIES with the model obtained above:
Language: SQL
SELECT*FROMML.DETECT_ANOMALIES(MODEL `mydataset.my_arima_plus_model`,STRUCT(0.8 AS anomaly_prob_threshold));

To detect anomalies in new data, use ML.DETECT_ANOMALIES and provide new data as input:
Language: SQL
WITHnew_data AS (SELECTdate,item_description AS item_name,SUM(bottles_sold) AS total_amount_soldFROM`bigquery-public-data.iowa_liquor_sales.sales`GROUP BYdate,item_nameHAVINGdate BETWEEN DATE('2017-06-02')AND DATE('2017-10-01')AND item_name IN ('Black Velvet','Captain Morgan Spiced Rum','Hawkeye Vodka',"Five O'Clock Vodka",'Fireball Cinnamon Whiskey') )SELECT*FROMML.DETECT_ANOMALIES(MODEL `mydataset.my_arima_plus_model`,STRUCT(0.8 AS anomaly_prob_threshold),(SELECT*FROMnew_data));

For more information on anomaly detection with ARIMA_PLUS time series models, please see the documentation here.
Thanks to the BigQuery ML team, especially Abhinav Khushraj, Abhishek Kashyap, Amir Hormati, Jerry Ye, Xi Cheng, Skander Hannachi, Steve Walker, and Stephanie Wang.
More Relevant Stories for Your Company
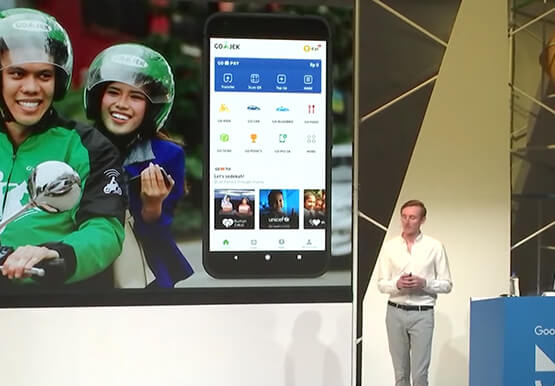

The Strange Phenomenon AI Revealed at Ride-Hailing Company Go-Jek
Go-Jek, Indonesia’s first billion-dollar startup, has seen an incredible amount of growth in both users and data over the past two years. Many of the ride-hailing company's services are backed by machine learning models hosted on Google Cloud Platform. Models range from driver allocation, to dynamic surge pricing, to food

Discover Gen App Builder: Transform Search and Conversational Experiences Through Generative AI
If you’ve been exploring recently-launched consumer generative AI tools like Bard and thinking about how to build similar experiences for your business, Generative AI App Builder, or Gen App Builder for short, is here to get you started.Gen App Builder is part of Google Cloud’s recently announced generative AI offerings and lets developers,

Contact Center AI & Automation Anywhere Help Virtual Agents Deliver Next Level CX
With the advent of the pandemic, contact center traffic has increased by as much as 300%, taxing center capabilities. To help handle the surge, and keep up with heightened customer demands, many customer experience providers have deployed automation in the form of virtual agents that serve as the first—and, sometimes the

Rubin Observatory Leverages Google Cloud to Power Astronomical Research
This week, the Vera C. Rubin Observatory is launching the first preview of its new Rubin Science Platform (RSP) for an initial cohort of astronomers. The observatory, which is located in Chile but managed by the U.S. National Science Foundation’s NOIRLab in Tucson, AZ and SLAC in California, is jointly funded by the NSF and the U.S. Department
