





Rubin Observatory Leverages Google Cloud to Power Astronomical Research

6091
Of your peers have already read this article.
2:00 Minutes
The most insightful time you'll spend today!
This week, the Vera C. Rubin Observatory is launching the first preview of its new Rubin Science Platform (RSP) for an initial cohort of astronomers. The observatory, which is located in Chile but managed by the U.S. National Science Foundation’s NOIRLab in Tucson, AZ and SLAC in California, is jointly funded by the NSF and the U.S. Department of Energy. The platform provides an easy-to-use interface to store and analyze the massive datasets of the Legacy Survey of Space and Time (LSST), which will survey a third of the sky each night for ten years, detecting billions of stars and galaxies, and millions of supernovae, variable stars, and small bodies in our Solar System.
The LSST datasets are unprecedented in size and complexity, and will be far too large for scientists to download to their personal computers for analysis. Instead, scientists will use the RSP to process, query, visualize, and analyze the LSST data archives through a mixture of web portal, notebook, and other virtual data analysis services. An initial launch with simulated data, called Data Preview 0, builds on the Rubin Observatory’s three-year partnership with Google to develop an Interim Data Facility (IDF) on Google Cloud to prototype hosting of the massive LSST dataset. This agreement marks the first time a cloud-based data facility has been used for an astronomy application of this magnitude.
Bringing the stars to the cloud
For Data Preview 0, the IDF leverages Cloud Storage, Google Kubernetes Engine (GKE), and Compute Engine to provide the Rubin Observatory user community access to simulated LSST data in an early version of the RSP. The simulated data were developed over several years by the LSST Dark Energy Science Collaboration to imitate five years of an LSST-like survey over 300 square degrees of the sky (about 1,500 times the area of the moon). The resulting images are very realistic: they have the same instrumental characteristics, such as pixel size and sensitivity to photons, that are expected from the Rubin Observatory’s LSST Camera, and they were processed with an early version of the LSST Science Pipelines that will eventually be used to process LSST data. “This will be the first time that these workloads have ever been hosted in a cloud environment. Researchers will have an opportunity to explore an early version of this platform,” says Ranpal Gill, senior manager and head of communications at the Rubin Observatory.
Broadening access for more researchers
Over 200 scientists and students with Rubin Observatory data rights were selected to participate in Data Preview 0 from a pool of applicants that represents a wide range of demographic criteria, regions, and experience level. Participants will be supported with resources such as tutorials, seminars, communication channels, and networking opportunities—and they will be free to pursue their own science at their own pace using the data in the RSP.
“The revolutionary nature of the future LSST dataset requires a commensurately innovative system for data access and analysis paired with robust support for scientists,” says Melissa Graham, lead community scientist for the Rubin Observatory and research scientist in the astronomy department at the University of Washington. “I’m personally excited to enhance my own skills by using the RSP’s tools for big data analysis, while also helping others to learn and to pursue their LSST-related science goals during Data Preview 0.”
At the same time, the fact that the RSP is hosted in the cloud provides researchers at smaller institutions access to state-of-the-art astronomy infrastructure that is comparable to that of the largest national research centers.
The launch benefits the observatory too: the development team can learn what researchers are interested in while also testing and debugging the platform. Graham says that “the platform is still in active development so researchers using it will be able to follow along in the progress, and provide feedback on ways that we can optimize the development of the tools.”
Next steps
The LSST aims to begin the ten-year survey in 2023-24 and expects it to include 500 petabytes of data. Through the cloud, Google aims to help make this extraordinary project scalable and accessible to researchers everywhere. To learn more about Data Preview 0, watch this video.
Want to ramp up your own research in the cloud? We offer research credits to academics using Google Cloud for qualifying projects in eligible countries. You can find our application form on Google Cloud’s website or contact our sales team.
You Can Quantify and Maximize Value of Your Org’s AI/ML and Analytics Teams!

4434
Of your peers have already read this article.
1:30 Minutes
The most insightful time you'll spend today!
Investing in Artificial Intelligence (AI) can bring a competitive advantage to your organization. If you’re in charge of an AI or Data Science team, you’ll want to measure and maximize the value that you’re providing. Here is some advice from our years of experience in the field.
A checklist to embark on a project:
As you embark on projects we’ve found it’s good to have the following areas covered:
- Have a customer. It’s important to have a customer for your work, and that they agree with what you’re trying to achieve. Be sure to know what value you’re delivering to them.
- Have a business case. This will rely on estimates and assumptions, and may take no more than a few minute’s work. You should revise this, but always know what justifies your team’s effort, and what you (and your customer) expect to get in return.
- Know what process you will change or create. You’ll want to put your work in production, so you have to be clear about what business operations are changing or created around your work and who needs to be involved to make it happen
- Have a measurement plan. You’ll want to show that ongoing work is impacting some relevant business indicator. Measure and show incremental value. The goal of these measurements is to establish what has changed because of your project that would otherwise not have changed. Be sure to account for other factors like seasonality or other business changes that may affect your measurements.
- Use all the above to get your organization’s support for your team and your work.
What measures to use?
As you start the work, what measures and indicators can you use to show that your team’s work is useful for your organization?
How many decisions you make. A major function of ML is to automate and optimize decisions: which product to recommend, which route to follow, etc. Use logs to track how many decisions your systems are making.
Changes to revenue or costs. Better and quicker decisions often lead to increased revenue or savings. If possible, measure it directly, otherwise estimate it (for example fuel costs saved from less distance traveled, or increased purchases from personalized offers).
As an example, the Illinois Department of Employment Security is using Contact Center AI to rapidly deploy virtual agents to help more than 1 million citizens file unemployment claims. To measure success the team tracked the two outcomes: (1) the number of web inquiries and voice calls they were able to handle, and (2) the overall cost of the call center after the implementation. Post implementation, they were able to observe more than 140,000 phone and web inquiries per day and over 40,000 after-hours calls per night. They also anticipate an estimated annual cost savings of $100M based on an initial analysis of IDES’s virtual agent data (see more in the link to case study).
Implementation costs. The other side of increased revenue or savings, is to put your achievements in the context of how much they cost. Show the technology costs that your team incurs and, ideally, how you can deliver more value, more efficiently.
How much time was saved. If the team built a routing system then it saved travel time, if it built an email classifier then it saved reading time, etc. Quantify how many hours were given back to the organization thanks to the efficiency of your system.
In the medical field, quicker diagnostics matter. Johns Hopkins University’s Brain Injury Outcomes (BIOS) Division has focused on studying brain hemorrhage aiming to improve medical outcomes. The team identified the time to insights as a key metric in measuring business success. They experimented with a range of cloud computing solutions like Dataflow, Cloud Healthcare API, Compute Engine, and AI Platform for distributed training to accelerate iterations. As a result, in their recent work they were able to accelerate insights from scans from approximately 500 patients from 2,500 hours to 90 minutes.
How many applications your team supports. Some of your organization’s operations don’t use ML (say reconciling financial ledgers) but others do. Know how many parts of your organization benefit from the optimization and automation your team builds.
User experience. You may be able to measure your customer’s experience: fewer complaints, better reviews, reduced latency, more interactions, etc. This is valid both for internal and external stakeholders. At Google we measure usage and regularly ask for feedback on any internal system or process.
One of our customers, The City of Memphis, is using VisionAI and ML to tackle a common but very challenging issue: identifying and addressing potholes. The implementation team identified the percentage increase of potholes identified as one of the key metrics along with accuracy and cost savings. The solution captures video footage from it’s public vehicles and leverages Google Cloud capabilities like Compute Engine, AI Platform, and BigQuery to automate the review of videos. The project increased pothole detection by 75% with over 90% accuracy. By measuring and demonstrating these outcomes, the team proved the viability of a cost-effective, cloud-based machine learning model and is looking into new applications of AI and ML that will further improve city services and help it build a better future for its 652,000 residents.
Acknowledgements
Filipe and Payam would like to thank our colleague and co-author Mona Mona (AI/ML Customer Engineer, Healthcare and lifesciences) who contributed equally to the writing.

How Domino’s Increased Monthly Revenue By 6% with Google Marketing Platform
DOWNLOAD CASE STUDY5781
Of your peers have already downloaded this article
1:30 Minutes
The most insightful time you'll spend today!
Pizza purveyor Domino’s is dominating delivery sales around the world. Today, Domino’s is the most popular pizza delivery chain operating in the U.K., the Republic of Ireland, Germany, and Switzerland — and sales just keep growing.
In these regions in 2014, Domino’s sold 76 million pizzas and generated £766.6 million (1.02 billion USD) in revenue — a 14.6% increase from the previous year.
In the U.K. and Ireland, online sales are increasing 30% year over year and currently account for almost 70% of all sales. Notably, 44% of those online sales are now made via mobile devices.
Multi-Device Purchasing Means Fresh Opportunities
Domino’s is a consistent digital innovator. Much of the company’s success stems from early investments in ecommerce and mobile commerce platforms that help people easily purchase pizzas from different devices.
Domino’s sold its first pizza online in 1999. It then launched an iPhone app in 2010, quickly followed by apps for Android and iPad in 2011, and a Windows app in 2012. By late 2014, Domino’s customers could even order pizzas from Xboxes.
The Domino’s marketing team had assembled a variety of tools to measure marketing performance, keeping pace with the company’s rapid innovations. Unfortunately, measuring siloed analytics and channel-focused tools restricted the team’s ability to fully understand all of the different paths to purchase.
Find out how they worked around this challenge with Google Marketing Platform. Download the case study!
Google’s Latest ‘Carbon Footprint’ can Flag Users about Carbon Emission Levels from their Cloud Usage

7108
Of your peers have already read this article.
4:00 Minutes
The most insightful time you'll spend today!
Google Cloud is proud to support our customers with the cleanest cloud in the industry. For the past four years, we’ve matched 100% of our electricity use with renewable energy purchases, and we were the first company of our size to commit going even further by running on carbon-free energy 24/7 by 2030. As we work to achieve 24/7 carbon-free energy, we help you take immediate action to decarbonize your digital applications and infrastructure. We’re also working with our customers across every industry to develop new solutions for the unique climate change challenges that organizations face. Today, we’re excited to expand our portfolio of carbon-free solutions and announce new partnerships that will help every company build a more sustainable future.
First, we’re launching Carbon Footprint, a new product that provides customers with the gross carbon emissions associated with their Google Cloud Platform usage. Now available to every GCP user for free in the Cloud Console, this tool helps you measure, track and report on the gross carbon emissions associated with the electricity of your cloud usage. Of course, the net operational emissions associated with your Google Cloud usage is still zero. With growing requirements for Environmental Social and Governance (ESG) reporting, companies are looking for ways to show their employees, boards and customers their progress against climate targets. Using Carbon Footprint, you have access to the gross energy related emissions data you need for internal carbon inventories and external carbon disclosures, with one click.
Built in collaboration with customers like Atos, Etsy, HSBC, L’Oréal, Salesforce, Thoughtworks and Twitter, our Carbon Footprint reporting introduces a new standard of transparency to support you in meeting your climate goals. You can monitor your gross cloud emissions over time, by project, by product and by region, giving IT teams and developers metrics that can help them reduce their carbon footprint. Our detailed calculation methodology is published so that auditors and reporting teams can verify that their cloud emissions data meets GHG Protocol guidance.

“The power of knowledge combined with the power of technology innovation plays a vital role in proactively responding to the climate crisis we are facing. With Google Carbon Footprint reporting, Atos feeds emissions data in our Decarbonization Data Platform, demonstrating potential emissions reductions from the Google Cloud Platform to our customers. This reporting opens up new levels of emissions transparency, trajectory planning, and data insight to support our customers in meeting, and potentially accelerating towards, their climate goals.”—Nourdine Bihmane, Head of Decarbonization Business Line, Atos
“The capability to measure and understand the environmental footprint of our Public Cloud usage is among the key axis of our sustainable tech roadmap. With Google Cloud Carbon Footprint, we are now able to directly follow the impact of our sustainable infrastructure approach and architecture principles.”—Hervé DUMAS, Sustainability IT Director, L’Oreal
While digital infrastructure emissions are just one part of your environmental footprint, accurately accounting for IT carbon emissions is necessary to measure progress against the carbon reduction targets required to avert the worst consequences of climate change. To help you account for emissions beyond our cloud and across your organization, we’re excited to partner with Salesforce Sustainability Cloud, integrating our Google Cloud Platform emissions data into their carbon accounting platform.
“As we face unprecedented climate challenges, companies across the globe need to embed sustainability into the core of their business in order to meet growing customer and stakeholder expectations, and reduce their environmental impact. Together, Google Cloud and Salesforce Sustainability Cloud can help our joint customers accelerate their path to Net Zero, leveraging data-driven insights and visualizations to track and reduce their carbon emissions to drive sustainable change.”—Ari Alexander, GM of Salesforce Sustainability Cloud.
From information to action
With the gross energy-related emissions footprint of data associated with your Google Cloud usage now available, we’re committed to providing tools to not only measure your carbon footprint, but help you reduce it. We recently launched low-carbon region icons to help you choose cleaner regions to locate your Google Cloud resources. New users who see the icons are over 50% more likely to choose clean regions over others, ensuring their applications emit less carbon over time.
For current Google Cloud users, we’re pleased to announce that Active Assist Recommender will include a new sustainability impact category, extending its original core pillars of cost, performance, security, and manageability. Starting with the Unattended Project Recommender, you’ll soon be able to estimate the gross carbon emissions you’ll save by removing your idle resources. Unattended Project Recommender uses machine learning to identify, with a high degree of confidence, projects that are likely abandoned based on API and networking activity, billing, usage of cloud services, and other signals, and provides actionable recommendations on how to remediate those abandoned projects. By deleting these projects, not only can you reduce costs and mitigate security risks, but you can also reduce your carbon emissions. In August, Active Assist analyzed the aggregate data from all customers across our platform, and over 600,000 gross kgCo2e was associated with projects that it recommended for cleanup or reclamation. If customers deleted these projects they would significantly reduce future gross carbon emissions. Check out this blog to learn more about Active Assist.

Solutions for climate resilience
Many of our customers face difficult questions about how their business impacts the natural environment today, and how it will be affected by climate change in the future. Answering these questions requires rich datasets about the planet, better analytics tools and smarter models to predict potential outcomes. For over a decade Google Earth Engine has supported scientists and developers with hyperscale computing power and the world’s largest catalog of satellite image data. Today, we are delighted to announce the preview of Earth Engine as part of Google Cloud Platform. Now, you can access Earth Engine and combine it with other geospatial-enabled products like BigQuery. By extending Earth Engine’s powerful platform to enterprises through Google Cloud, we are bringing the best of Google together.
Over the past year we’ve worked with a number of organizations to use Earth Engine technology with tools like BigQuery and the Cloud AI Platform to develop new solutions for responsible commodity sourcing, sustainable land management and carbon emissions reduction. Earth Engine enables companies to track, monitor and predict changes in the Earth’s surface due to extreme weather events or human-caused activities, thus helping them save on operational costs, mitigate and better manage risks, and become more resilient to climate change threats. This new offering will wrap the unique data, insights and functionality of Earth Engine with a fully-managed, enterprise-grade experience and reliability.
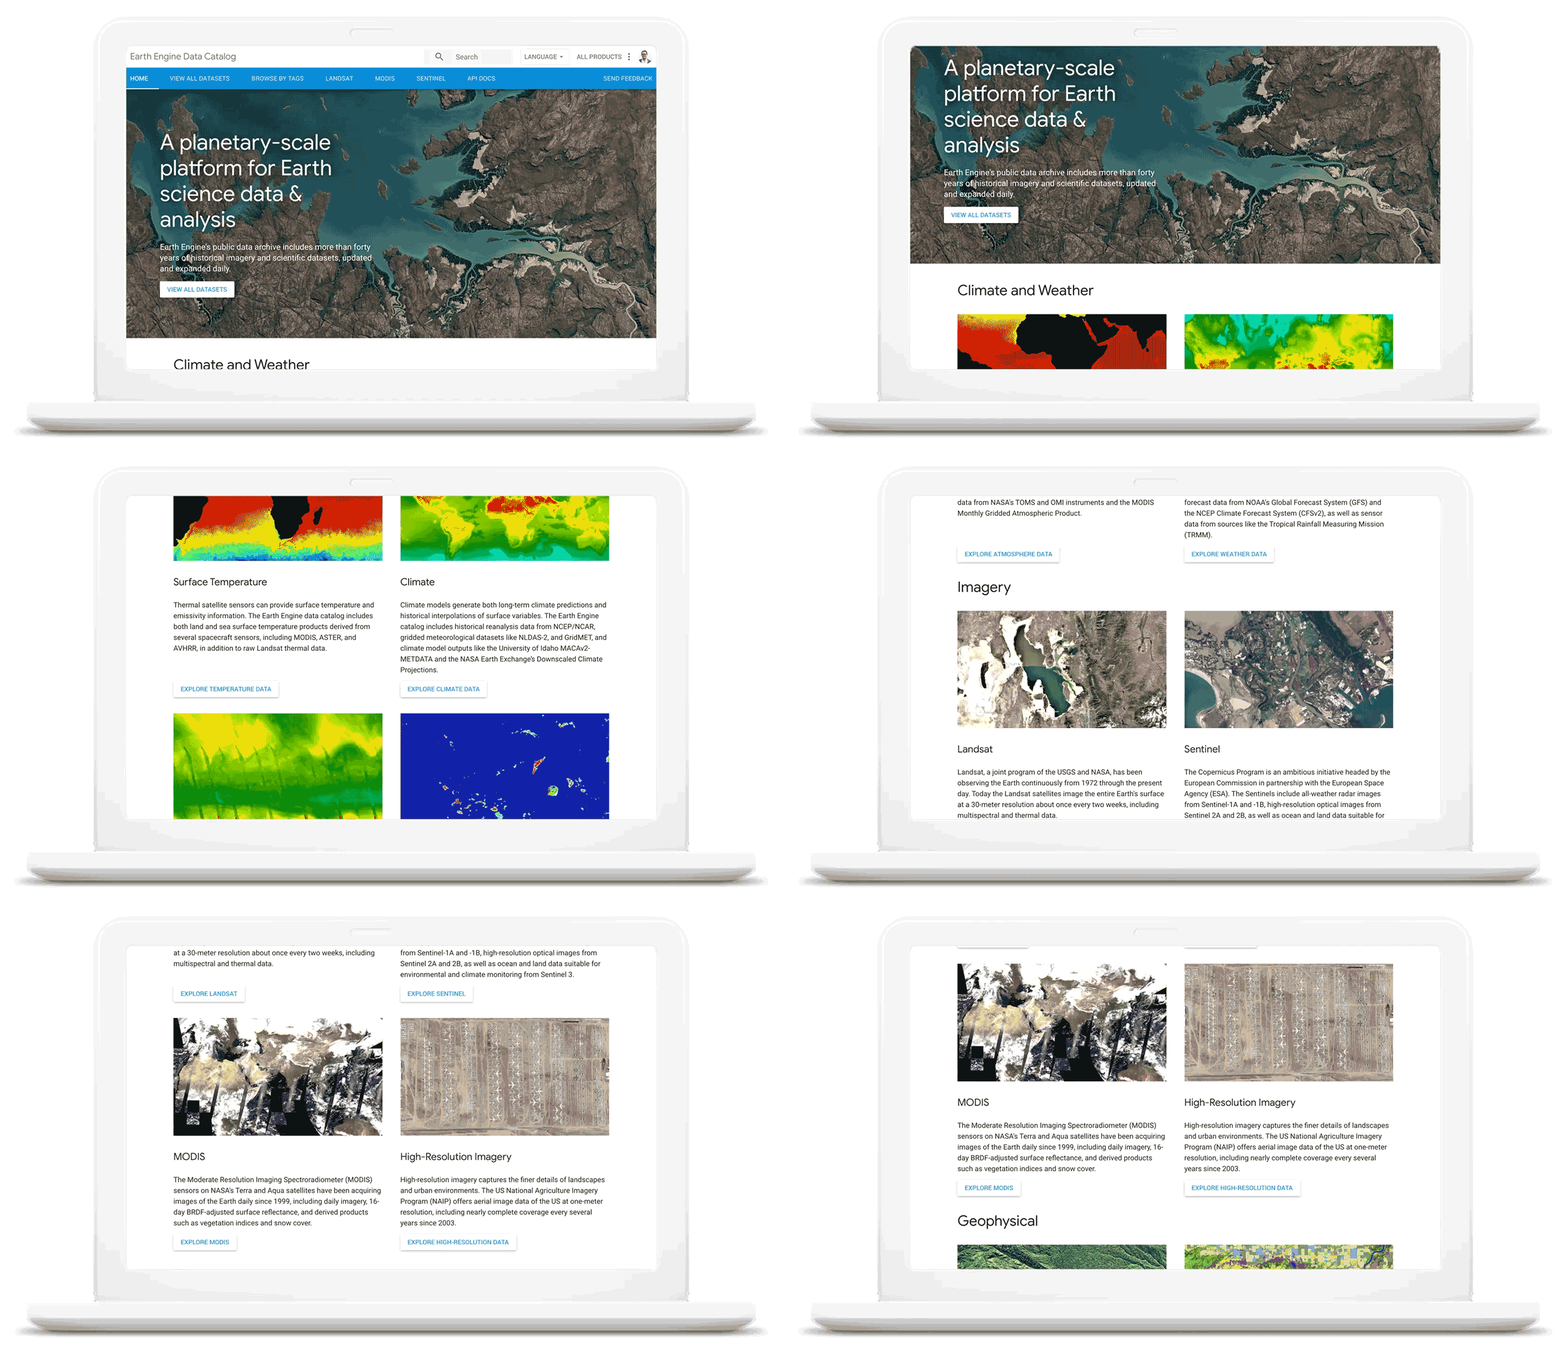
As we work with our customers to accelerate their sustainability initiatives, earth observation data is proving critical to effectively plan for the long-term impacts of climate change. To extend our geospatial and sustainability use cases we’re also expanding our partnerships with CARTO, Climate Engine, Geotab, NGIS, and Planet to bring their data and core applications to Google Cloud.
These partners will each make their existing platforms and datasets available globally on Google Cloud, giving you low-latency and reliable access to critical data and applications that will inform your sustainability initiatives. By integrating water availability, agricultural data, weather risks, and extensive daily satellite imagery into Earth Engine and BigQuery, you can achieve more ambitious goals for the sustainability of your business and our planet.
Committing to help you meet your climate goals
With each of these tools, we’re working to reduce the barriers you face in adopting more sustainable technology practices. We understand that building more sustainable applications and infrastructure is not easy. You face competing priorities, technical challenges, and the perception that climate action is costly.
It doesn’t have to be this way. Today, we are making a sustainability pledge to you: teams across Google Cloud are committing to eliminating the barriers you face in building a more sustainable digital future for your organization, and will help you take action today to realize your climate goals. We’ll do this in a number of ways:
- In digital transformation projects and workshops, sustainability teams will always have a seat at the planning table, so we can work together on using cloud technology to build a more sustainable future.
- We’re putting low-carbon signals natively into our products to help developers choose more sustainable options early in their application development.
- We’ll ensure carbon impact is measured consistently with other key performance indicators. Leveraging the social cost of carbon, the ROI models and value assessments you conduct with Google Cloud will project your emissions impact too.
- We’ll be transparent about our carbon impact, by publishing third-party reviewed reports and methodologies, so you can trust the data for your own reports and disclosures.
- We’ll continue to work with the industry on best practices, including educational resources like Sustainable IT – Decoded, a new masterclass created in partnership with Intel, that shares the expertise of sustainability thought leaders.
For the next decade we need to work together to avert the worst consequences of climate change. We’ve made tremendous progress in building technology that helps everyone do more for the planet, and we’re excited to see what you do with it. Visit this page to learn more about Google Cloud’s sustainability efforts.
An AI-Powered Cost Cutting Guide: 8 Strategies for Maximizing Profits

1723
Of your peers have already read this article.
3:30 Minutes
The most insightful time you'll spend today!
We are increasingly seeing one question arise in virtually every customer conversation: How can the organization save costs and drive new revenue streams?
Everyone would love a crystal ball, but what you may not realize is that you already have one. It’s in your data. By leveraging Data Cloud and AI solutions, you can put your data to work to achieve your financial objectives. Combining your data and AI reveals opportunities for your business to reduce expenses and increase profitability, which is especially valuable in an uncertain economy.
Google Cloud customers globally are succeeding in this effort, across industries and geographies. They are improving ROI by saving money and creating new revenue streams. We have distilled the strategies and actions they are implementing—along with customer examples and tips—in our eBook, “Make Data Work for You.” In it, you’ll find ways you can pare costs, increase profitability, and monetize your data.
Find money in your data
Our Google Cloud teams have identified eight strategies that successful organizations are pursuing to trim expenses and uncover new sources of revenue through intelligent use of data and AI. These use cases range from scaling small efficiencies in logistics to accelerating document-based workflows, monetizing data, and optimizing marketing spend.
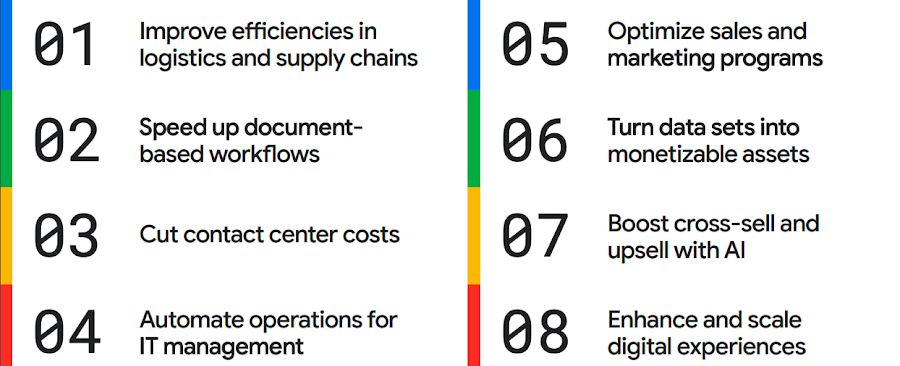
The results are impressive. They include massive cost savings and additional revenue. On-time deliveries have increased sharply at one company, and procure-to-pay processing costs have fallen by more than half at another. Other organizations have reaped big gains in ecommerce upselling and customer satisfaction.
We’ve found that businesses across every industry and around the globe are able to take action on at least one of these eight strategies. Contrary to common misperceptions, implementation does not require massive technology changes, crippling disruption to your business, or burdensome new investments.
What success looks like
If you worry your business is not ready or you need to gain buy-in from leadership, the success stories of the 15 companies in this report are helpful examples. Learning how organizations big and small, in different industries and parts of the world, have implemented these data and AI strategies makes the opportunities more tangible.
Carrefour
Among the world’s largest retailers, Carrefour operates supermarkets, ecommerce, and other store formats in more than 30 countries. To retain leadership in its markets, the company wanted to strengthen its omnichannel experience.
Carrefour moved to Google Data Cloud and developed a platform that gives its data scientists secure, structured access to a massive volume of data in minutes. This paved the way for smarter models of customer behavior and enabled a personalized recommendation engine for ecommerce services.
The company saw a 60% increase in ecommerce revenue during the pandemic, which it partly attributes to this personalization.
ATB Financial
ATB Financial, a bank in the Canadian province of Alberta, uses its data and AI to provide real-time personalized customer service, generating more than 20,000 AI-assisted conversations monthly. Machine learning models enable agents to offer clients real-time tailored advice and product suggestions.
Moreover, marketing campaigns and month-end processes that used to take five to eight hours now run in seconds, saving over CA$2.24 million a year.
Bank BRI
Bank BRI, which is owned by the Indonesian government, has 75.5 million clients. Through its use of digital technologies, the institution amasses a lot of valuable data about this large customer base.
Using Google Cloud, the bank packages this data through more than 50 monetized open APIs for more than 70 ecosystem partners who use it for credit scoring, risk management, and other applications. Fintechs, insurance companies, and financial institutions don’t have the talent or the financial resources to do quality credit scoring and fraud detection on their own, so they are turning to Bank BRI.
Early in the effort, the project generated an additional $50 million in revenue, showing how data can drive new sources of income.
How to get going now
“Make Data Work for You” will help you launch your financial resiliency initiatives by outlining the steps to get going. The process lays the groundwork for realizing your own cost savings and new revenue streams by leveraging data and AI.
Among these steps include building frameworks to operate cost efficiently, make informed decisions related to spending and optimize your data and AI budgets.
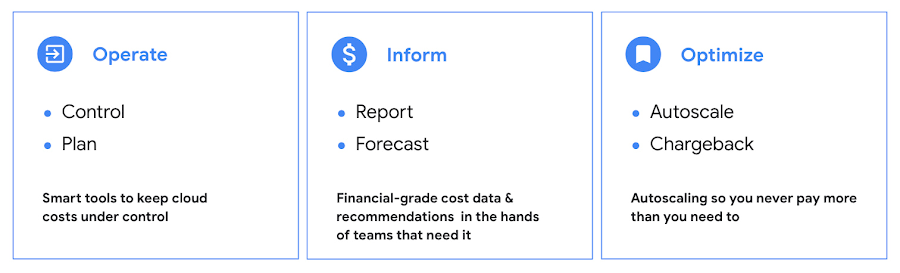
Operate: Billing that’s specific to your use-case
Control your costs by choosing data and analytics vendors who offer industry-leading data storage solutions and flexible pricing options. For example, multiple pricing options such as flat rate and pay-as-you-go allow you to optimize your spend for best price-performance.
Inform: make informed decisions based on usage
Use your cloud vendor’s dashboards or build a billing data report to gain insights on your spending over time. Make use of cost recommendations and other forecasting tools to predict what your future expenses are going to be.
Optimize: Never pay more than you use
While planning data analytics capacity, organizations often overprovision and overpay than what they actually use. Consider migrating your workloads that have unpredictable demand to a data warehousing solution that offers granular level autoscaling features so that you never have to pay for more than what you use.
There are other key moves that will set your initiative up for success including how to shorten time to value in building AI models and measuring impact. You can find details in the report.
A brighter future
The teams at Google Cloud helped the companies in “Make Data Work for You,” along with many more organizations, use their data and AI to achieve meaningful results. Download the full report to see how you can too.
Vodafone Leverages Google Cloud to Aid COVID-19 Frontline with Anonymized Insights on Population Mobility

11223
Of your peers have already read this article.
1:30 Minutes
The most insightful time you'll spend today!
Editor’s note: When Europe’s largest mobile communications company, Vodafone, was asked by the European Commission to help understand population movement across the European Union and the UK to help fight COVID-19, it was able to provide anonymized mobile network-based insights to answer the call. Here’s how Vodafone, with the support of Google Cloud, rapidly mobilized the COVID-19 frontline, while respecting its customers’ privacy.
With the emergence of COVID-19 in early 2020, the European Commission—the executive branch of the European Union (EU)—knew that technology would be instrumental in its fight to control the pandemic. With various lockdowns imposed across its member states, the Commission was keen to predict and prevent the spread of COVID-19 and to manage the related social, political and financial impacts.
Mobile network data helps track COVID-19 across the EU
Mobile networks produce location data, which can be turned into useful anonymous insights to understand population movement within a geographic area. The European Commission, working with mobile industry association GSMA (Groupe Speciale Mobile Association), asked Europe’s major mobile phone operators for help in producing insights to support the fight against COVID-19. As the largest mobile network operator within the EU, Vodafone saw this as a critical opportunity to participate.
Vodafone had previous experience of using mobile network data to support pandemic research. For example, in 2019, Vodafone provided mobility pattern analysis to help track the spread of Malaria in Mozambique. And, during the early stages of the COVID-19 pandemic (prior to working with the European Commission), Vodafone assisted the Italian and Spanish governments in understanding their citizens’ mobility patterns. Vodafone had also previously offered anonymized and aggregated population mobility insights to support public transport and tourism authorities and retail organizations in a number of countries. Consequently, Vodafone was perfectly placed to play a greater role in supporting the European Commission’s response to the pandemic.
When asked to assist the European Commission, Vodafone first considered how it could safely share its data with the governing body without providing details on the individual movements of its customers. It realized it could achieve this through an elaborate set of anonymization and aggregation techniques. Insights are aggregated from a minimum of 50 users and Vodafone only shared these anonymous insights and never the actual raw data with the Commission. As specified by the EU, these insights are then presented onto a large geographical region, typically a city or a county with thousands of people living in that area.
These insights illustrate how people move, helping to determine how lockdowns and self-isolation measures were impacting behaviors.
Using Google Cloud to collate and store population mobility data
In April 2020, Vodafone began migrating its operations, including its mobile data, to Google Cloud on servers in Europe and the UK with elaborate security safeguards, including encryption, building on a previous partnership.
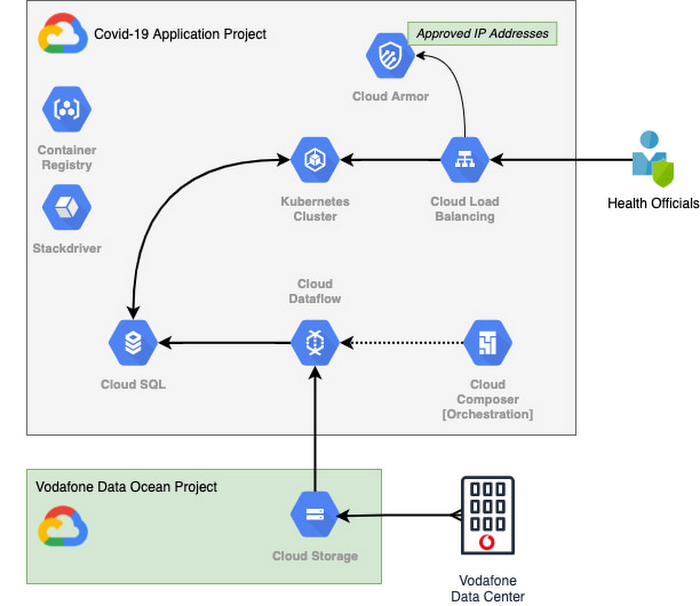
With the data residing in EU and UK data centers and not the United States, Vodafone could then retrieve anonymous insights from Google Cloud Storage instantaneously. Before supplying any information to the European Commission, however, Vodafone used Dataflow to validate the data and run a series of tests to ensure the database had accurate data, before ingesting and archiving the relevant metrics. For instant access, the data was then made available to the European Commission using a Redis database on Google Kubernetes Engine.
To ensure aggregate Vodafone customer data was always safe, secure, and anonymous, all entry points to the front-end were protected behind Google Cloud Armor, where only specific IP addresses were allowed. Using these tools, seamless data pipelines fed in predefined key performance indicators from each specified European market. While data quality measures ensured the definitions for metrics across markets were consistent and could be accurately compared.
The architecture (pictured below) shows how Vodafone integrated and anonymized its data on Google Cloud.
Live interactive dashboard shows population mobility in real-time
With its data integrated on Google Cloud, Vodafone created a live, interactive dashboard to track mobility patterns and share relevant information with the European Commission in real-time.
The European Commission Joint Research Center (JRC) was able to gather valuable information from these insights, which enabled them to see where population mobility was aiding the spread of the disease, when cross-referenced with health data. It could also assess the implications of lockdowns on different populations and forecast cross-country spreading.
Mobile data aids disease modeling for multiple stakeholders
The Vodafone data became instrumental in modeling the likely course of the disease too. For example, the University of Southampton in the UK used it to predict the outcome of different coordinated COVID-19 exit strategies across Europe. This research was published in Science Magazine in September 2020.
The Vodafone data dashboard continues to be used by individual governments, NGOs and organizations to further investigate the impacts of the pandemic and to measure the effectiveness of response strategies alongside the rollout of vaccination programs. The project also helped Vodafone win a DataIQ award for most effective stakeholder engagement.
Using the learnings from this project, Vodafone has been able to adapt its own B2B solution, called Vodafone Analytics, by adaptIng and migrating the code to work in Google Cloud Platform. This solution has been rolled out across Germany, Greece, Portugal and South Africa, and new countries are being onboarded every day. Vodafone Analytics already has more than 100 customers leveraging it for a variety of use cases—Italian fashion retailer OVS, uses it for its smart retail operation, while global real estate company, JLL, uses it to understand the footfall passing through its properties.
Working together, Vodafone and Google Cloud continue to help a range of organizations, governments, and NGOs navigate through the ongoing pandemic, optimize their operations, and help the greater good, without infringing individuals’ fundamental rights to privacy.
To learn more about Google Cloud and Vodafone, watch our full interview here.
More Relevant Stories for Your Company

Contact Center AI (CCAI) with Agent Assist can Lower Opex and Handle 28% More Chats
Contact Center AI (CCAI) brings Google’s innovation in conversational AI to solve the most challenging customer service needs while lowering operational costs. More than a thousand customers have deployed CCAI and are steadily turning it on to power their production contact centers. Today, we're excited to announce that we’ve made CCAI

ESG Report: Economic Advantages of Google BigQuery OnDemand Serverless Analytics
Traditional big data solutions require a significant upfront investment, ongoing maintenance of hardware and software, and manual provisioning to match compute and storage resources with demand. Google’s serverless analytics warehouse does away with all that extra work, helping businesses focus on what matters most: getting value from their data. Enterprise

The Data Scientist Guide to Preparing and Curating Data for AI
To design and implement a successful machine learning (ML) project, you often need to collaborate with multiple teams, including those in business, sales, research, and engineering. Understanding the essentials of gathering and preparing your data is crucial to align teams, and getting a project off the ground. Building an ML

Experts’ Guideline for Personalizing Platforms with the Right Recommendation System on Google Cloud
Over the past two decades, consumers have become accustomed to receiving personalized recommendations in all facets of their online life. Whether that be recommended products while shopping on Amazon, a curated list of apps in the Google Play store, or relevant videos to watch next on YouTube. In fact, in
