





Combining IoT and Analytics to Warn Manufacturers of Line Break Downs and Increase Profitability

7593
Of your peers have already read this article.
2:45 Minutes
The most insightful time you'll spend today!
Oden Technologies is using the Internet of Things (IoT) to improve the factories of today. The giant network of “things” (including people) connected to each other via the Internet has the potential to reduce waste, increase efficiency, and improve safety across all walks of life. Oden is leading IoT innovation in manufacturing by combining wireless connectivity, big data, and cloud computing.
The use of data to improve manufacturing is practically as old as manufacturing itself. But the computerization of manufacturing has resulted in broad and rapid changes to the way data is collected and processed, as well as the sheer volume of data available.
Oden’s goal is to help manufacturers tap into this data to quickly identify process trends and even warning signs of machine breakdown. Such visibility can reveal opportunities to improve manufacturing and maintenance processes that reduce waste and increase profit margins.
Oden designs and develops data collection devices that can plug into almost any kind of machine and can wirelessly transmit data with minimal complexity and setup time.
Once devices are installed, the Oden technology platform processes data to give manufacturers cutting-edge analytics that are easy to comprehend. Analysis produced by the platform provides factory engineers with data points such as detailed root-cause analysis down to the second, factory-wide performance in real-time, and trend analysis.
Improving cloud delivery
Oden’s previous cloud platform performed satisfactorily, but the company evaluated alternatives in search of potential reductions in cost and complexity and increases in performance.
When evaluating Google Cloud Platform, Oden discovered it would require fewer virtual machine (VM) instances for equivalent performance, which would cut costs. Furthermore, Oden could gain more sophisticated data analytics and machine learning capabilities compared with its existing cloud provider.
Today, Oden runs its entire platform on Google Cloud Platform including Google Compute Engine, Google Cloud Pub/Sub, Google Cloud Bigtable, Google Stackdriver, and Google Kubernetes Engine.
“In order to serve our customers, we need a cloud platform that can scale reliably while keeping costs low, perform under heavy loads, and consistently deliver sophisticated features such as machine learning,” says Willem Sundblad, CEO and Founder at Oden Technologies. “Google Cloud Platform is way ahead in all of these areas compared to our previous cloud provider.”
Capturing tens of millions of metrics a day
Using Google Cloud Platform, Oden can help an average factory capture and store approximately 10 million metrics on a single manufacturing line every day.
Metrics can include extremely granular detail, such as the amount of electricity going to machines, the amount of raw material consumed, and the volume of material produced. Sensors can also capture and transmit environmental information such as temperature, humidity, and dew point so that manufacturers can identify weather-related and seasonal impacts on production.
The updated Oden Cloud Platform uses Kubernetes Engine—powered by the open source Kubernetes system—to run application program interfaces (APIs) that capture data from Oden’s wireless devices on the factory floor.
Google Cloud Pub/Sub then sends the data in real time to Google Cloud Bigtable, where data is processed using Oden’s proprietary analytics tools. Google Stackdriver supports Google Cloud Platform monitoring, logging, and diagnostics, which help Oden deliver its cloud platform with confidence.
Oden Technologies builds dashboards powered by Kubernetes Engine, which pull analyzed data from Google Cloud Bigtable. The dashboards provide customers with real-time visibility into their manufacturing lines. Oden Factory Cloud dashboards allow customers to delve deeper into their data to fine-tune production processes or discover the root causes of production issues.
With the previous cloud provider, Oden required 80 VM instances to run the dashboards. With Google Cloud Platform that number has been cut to 45, which dramatically reduces costs and complexity.
“We migrated from our previous cloud provider to Google Cloud Platform in just one month,” says Willem. “Further, our storage and data analytics costs have decreased by 30%. Cost savings like these allow us to protect customers from rising expenses, keeping us focused on bringing the best products possible to market.”
Faster data access; more efficient factories
With Google Cloud Platform, Oden can now deliver a complete factory analytics picture to manufacturers. In environments where thousands of variables affect the bottom line, businesses can now automatically and perpetually record machine and performance measurement. Oden Factory Cloud gives customers access to comprehensive data insights and can eliminate reliance on onsite infrastructure investments to run their own analytics.
Because manufacturers have access to live data and can analyze production data quickly, they can troubleshoot and resolve problems in minutes rather than months. Such information helps improve product quality, minimize unplanned downtime, cut costs, and improve profitability.
“With the help of Google Cloud Platform, we are helping our customers to be data-driven, which wasn’t possible before,” adds Willem. “They now understand that data is their most important asset. That allows them to be more innovative and continually improve their production processes.”
6080
Of your peers have already watched this video.
1:30 Minutes
The most insightful time you'll spend today!
Explore the Innovations and Architecture Powering Spanner and BigQuery
Previously, databases had architectures with tightly coupled storage and compute. This resulted in higher latency, and with faster networks these constraints no longer surface. With Google Cloud’s BigQuery and CloudSpanner, the storage and compute architecture have been separated, allowing for better scalability and availability to address businesses’ high throughput data needs.
Watch the video to understand how these database and analysis products leverage Google’s distributed storage system, in-house custom network hardware and software, internal cluster management system and more!
Google’s Diversity Annual Report public dataset & BigQuery

3252
Of your peers have already read this article.
3:30 Minutes
The most insightful time you'll spend today!
Since 2014, tech companies have relied on metrics to identify trouble spots, establish baselines, and measure meaningful progress in diversity, including publishing DEI data directly through diversity annual reports. However, as our understanding of DEI has evolved over time each company’s report has diverged, creating a fragmented landscape of industry-wide data. This separation is problematic as no single company’s diversity dataset can solve tech’s DEI challenges. Instead, we need to build industry-wide systemic solutions to create sustainable change, and those start with establishing a common language for DEI data and standardizing and sharing DEI data across tech companies.
The challenge is most companies publish diversity data in a way that makes it difficult to analyze, such as using bar graphs and pie charts. Researchers, as a result, are unable to easily pull the real, detailed data or aggregate and analyze it for their unique needs (e.g. hiring trends for tech vs. nontechnical roles, representation of Asian women in leadership, and more). As we shared in our most recent Diversity Annual Report, external research shows that sustainable change will only come from solutions that encompass the entire tech industry and data transparency is a critical step in this work.
Google’s Diversity Annual Report public dataset & BigQuery
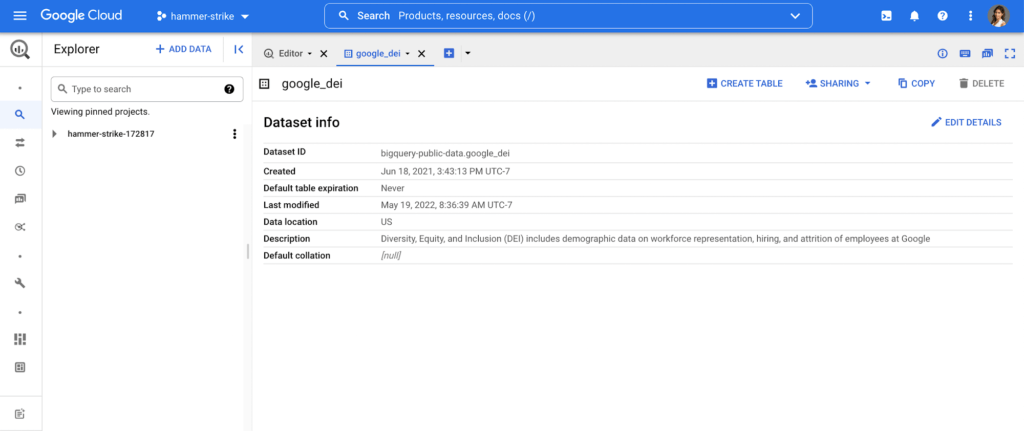
In May, we released our 2022 Diversity Annual Report, which includes demographic data on workforce representation, hiring, and attrition of employees at Google, including leadership. You can see our hiring data by race/ethnicity, gender, and intersectional hiring over time, by region, and more. In an effort to make this data more transparent and accessible for analysis, we have added it as a public dataset in BigQuery, Google Cloud’s powerful data warehousing tool. Our data is now even easier for researchers, community organizations, and industry groups to leverage and compare against external benchmarks to help contextualize our progress.
As one of the first in the industry, we are proud to have published our diversity data on BigQuery for the second year in a row. Our dataset, among others, is public, stored and paid for by Google so those who are interested can use BigQuery’s advanced analytic capabilities through the Google Cloud Public Dataset Program for free*.
Contextualizing diversity data is necessary to make meaningful conclusions
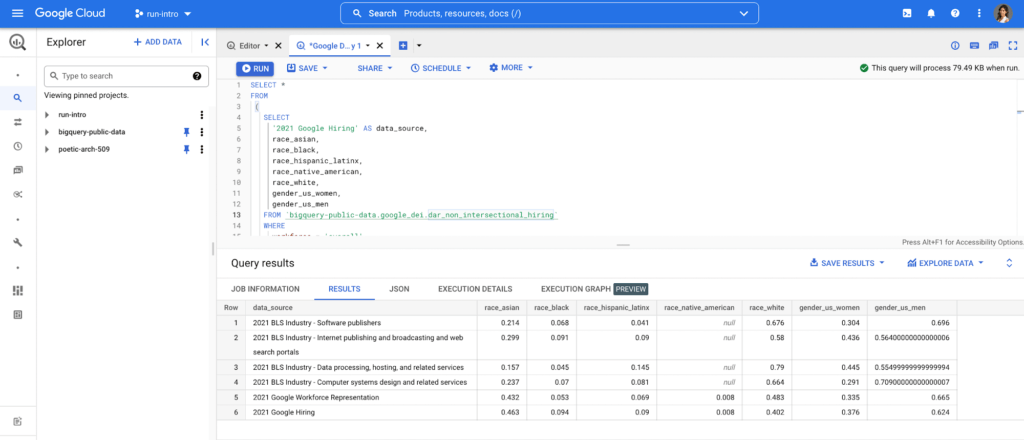
While Google’s diversity dataset can help users compare their own datasets to Google’s current and historical trends, DEI data is only useful when analyzed in the context of other relevant datasets. For example, concluding that Black+ hiring has increased from 8.8% to 9.4% has little meaning unless there is a point of reference, like US general census data, labor force participation rates or graduation rates. It’s why Google also includes other public datasets in BigQuery such as related industry DEI data, talent and graduation pools. By doing so, users can run a sample query that then compares Google’s hiring and representation to related industries (software publishers, data process services, etc.). Users can then better understand and contextualize areas of progress and opportunity, and they can more objectively identify where organizations can take a proactive role in addressing not only DEI in their companies, but also in the communities in which they call home.
Intersectional data and disaggregated baseline metrics
In the workplace, intersectional data is key to understanding the layers of exclusion and inequity that may exist for certain groups. This includes those with social identity overlap, like race, gender, and LGBTQ+, that create multiple levels of inequality or discrimination. It’s critical for DEI data to be disaggregated in a meaningful way to diagnose the true health of a system and to better understand how intersectionality contributes to the greater DEI landscape .
Google’s Diversity Annual Report public dataset includes Google’s intersectional hiring and representation data also broken down by tech, non-tech, and leadership roles. BigQuery’s friendly interface makes it easy to select the relevant parameters and join this data with other public or private datasets to help meaningfully contextualize Google’s data against the broader industry. Anyone from data scientists to DEI stewards can launch public datasets from the Google Cloud Marketplace and start querying them right away. Findings can be visualized through tools like Looker, Data Studio, or Tableau.
This is just the beginning
As DEI work continues to evolve into an industry-wide approach, we must encourage a standard of practice for collecting and reporting data across the board. At scale, data has the power to enable the tech industry to make real improvements collectively, in addition to inside our individual companies. We hope our dataset and sample queries give researchers and individuals a launchpad to become DEI practitioners of the tech industry, and ensure we have the right data to solve the right problems.
Footnote:
*The only time anyone would need to pay is for queries performed on the data after BigQuery’s 1TB/mo of free tier processing. This means that each user receives 1TB of free BigQuery processing every month, which can be used to run queries on this public dataset.
Blue Apron: Offering a better recipe for modern analytics

1647
Of your peers have already read this article.
5:30 Minutes
The most insightful time you'll spend today!
When Blue Apron had issues running its data warehouse on another cloud provider, it built an analytics platform using Looker and Google BigQuery to enable faster business decisions about food inventory.
Blue Apron’s mission is to make incredible home cooking accessible to everyone. Launched in 2012, Blue Apron is reimagining the way that food is produced, distributed, and consumed.

Google Cloud Results
- Enables near real-time business decisions to better manage food inventory and delivery by reducing query times exponentially
- Helps improve customer service and optimize business processes with faster insights
- Reduces costs while reclaiming up to a week per month of engineering
The popularity of meal kit delivery services has surged in recent years as consumer attitudes toward home cooking and grocery shopping have shifted. As a pioneer in the category, Blue Apron helps its customers create incredible home cooking experiences by sending culinary-driven recipes with high-quality ingredients and step-by-step instructions straight to customers’ doors. Blue Apron also offers a monthly wine subscription service and a la carte culinary tools and products through its marketplace.
If that sounds simple, it isn’t. Ingredients for the meal kits must be sourced at the right time, quality, and price. Orders must be packed efficiently and in exactly the right proportions. Most importantly, meal kits must be delivered to the customer fresh and on time.
To meet these criteria and make data meaningful and intuitive to its managers, one of the tools Blue Apron relies on is Looker, an analytics platform that lets business users explore data and ask sophisticated questions using familiar terms.
A Google Cloud partner and winner of the 2016 Google Cloud Global Partner Award for Solution Innovation, Looker integrates its solution with Google Cloud Platform to help customers modernize their analytics.
Blue Apron previously used Looker with a single database instance hosted on another cloud provider. As data volumes grew and queries became more complex, it became difficult to scale. Blue Apron’s only options were choosing ever-larger server classes and increasing storage throughput by purchasing a higher number of provisioned IOPS. To improve speed, scalability, and cost efficiency, Blue Apron moved its data warehouse to Google BigQuery.
“The combination of Looker and Google BigQuery is powerful, allowing us to get data-hungry analysts essential information much faster,” says Sam Chase, Tech Lead, Data Operations at Blue Apron. “Because we choose to pay by the query, it’s also flexible and cost effective—plus storage is cheap, so we can just put data in and query what we need.”
The analytics platform of the future
When you’re making business decisions about a customer’s dinner, speed matters. Looker takes full advantage of the power of Google BigQuery, making it easy to build a data exploration platform. Blue Apron’s applications publish event data to Kafka—approximately 140 million events per day—and data is then streamed into Google BigQuery, which performs lightning-fast queries on both streamed and static data. Now, business users and analytics teams can make decisions based on near real-time information in Looker, instead of waiting until the next business day for results.
“After we moved to Google BigQuery, query time was reduced exponentially. It’s an astonishing difference, allowing us to run 300 queries per day,” says Sam.
Previously, Blue Apron spent up to a week out of every month optimizing its data warehouse to attempt to improve query performance. With Google BigQuery, all maintenance is handled by Google, reclaiming 25% of up to two engineers’ time. Even when multiple people are using Looker concurrently, query performance never degrades and storage never runs out.
“Because Google BigQuery is architected as a giant, shared cluster, growth is smooth,” says Lloyd Tabb, Founder and CTO of Looker. “Like a race car going from 0 to 120 mph, there are no shift points, just smooth acceleration. To us, it looks like the future.”
An empowering, integrated toolset
Looker takes advantage of aggressive caching and support for date-based table partitioning in Google BigQuery to increase performance, simplify the load process, and improve data manageability. By partitioning data by time, Blue Apron can also take advantage of better long-term storage pricing without sacrificing query performance. When using Google BigQuery with Looker, analysts can easily see how much data is going to be scanned before each query is run.
Blue Apron is also using Looker for Google BigQuery Data Transfer Service to provide actionable analytics for all of the company’s Google marketing data from Google AdWords and DoubleClick by Google in one place to understand campaign performance across channels, saving its data operations team months of work. Using Looker Blocks, marketers can quickly make sense of the data with reports and dashboards, and set alerts when campaign performance hits certain thresholds.
Looker Blocks for Google AdWords and DoubleClick by Google provide all the analysis you’d get straight from the Google console, plus additional value-add analysis that’s impossible to replicate without SQL. Complex metrics such as ROI on ad spend, flexible multi-touch attribution, and predictive lifetime value empower marketers with a better understanding of their customers and where to spend their next dollar.
In addition to these turnkey dashboards and pieces of analysis, marketers can customize views to meet their unique needs and workflows. These capabilities help the Blue Apron marketing team make decisions regarding the allocation of spend to maximize customer acquisition and retention.
“Everyone at Blue Apron is excited about using Google BigQuery with Looker,” says Sam. “Business users and marketers are more empowered to look for answers, instead of waiting for analytics teams. Because users know they can get results rapidly, our business processes are evolving and improving.”
For data cleansing and transformation, Blue Apron uses Google Cloud Dataproc to run fully managed Apache Spark clusters on Google Cloud Platform. It’s also leveraging Google BigQuery integration with Google Workspace to bring data into Google Sheets for further distribution and analysis.
“Transferring data between Google tools is fast because it all happens on the Google network,” says Sam. “We can pull data from Google BigQuery, run transformations with Spark, and then write it back to Google BigQuery. That’s very helpful in providing our business users and data analysts with the richest, most current data.”
A perfect match for better insights
As Blue Apron seeks to expand its reach and deepen its engagement with customers, it is making Google BigQuery and Looker available to more users, providing a high-quality interactive analytics experience. “Our ability to pull a lot of data in and compute fast results affects everyone in our company,” says Sam. “Using Google BigQuery and Looker to iterate quickly and build new models to make our operations more efficient will directly impact our customers.”
For Looker, Google BigQuery represents the next step in data warehouse evolution. “Google BigQuery is a perfect match for Looker, combining easy setup with near infinite scale-out and elasticity,” says Lloyd. “People can make smarter decisions faster that directly benefit their business and customers.”
PaGaLGuY Turns to Google Cloud Platform to Power Leading India Education Network

8147
Of your peers have already read this article.
2:30 Minutes
The most insightful time you'll spend today!
Founded in 2006, PaGaLGuY started as a forum that enabled students, typically aged between 20 and 30 to discuss and seek advice on academic issues. By 2011, PaGaLGuY had increased its traffic to about 250,000 page views per month. The business is now one of India’s largest education networks and provides an app that users can download to their Android and iOS devices.
Over the past six years, PaGaLGuY has extended its service to include video advice from experts on education topics and grown the number of views of its pages to 1.5 million per day. As Head of Technology for the business, Sandeep Kalidindi has played a key role in ensuring PaGaLGuY is as engaging as possible to users. “Because the product is advertising based, the greater the user engagement, the greater the advertising revenue,” Kalidindi explains.
Google Cloud Platform Results
- Supported growth to 1.5 million page views per day and demand spikes that see requests increase from about 90 per second to about 1,200 per second
- Reduced API latency from about 1 second to about 40 milliseconds
- Reduced system administration time from three to four days per week to 30 minutes every two weeks
In 2015, PaGaLGuY’s senior management team decided to deliver an even more relevant experience for users of the education network. “The core thing we had to do was personalise the experience for each and every student that visited PaGaLGuY,” Kalidindi says. “So we had to capture each student’s data to customise what they see when they open the site.”
The business also found traffic to the network was straining its infrastructure. During demand peaks, created by exams involving as many as 5 million students, PaGaLGuY would be inaccessible for periods of 30 minutes to one hour. Furthermore, average API latency had climbed to an unacceptable 1 second, compromising performance.
PaGaLGuY needed to access extensive compute resources to undertake its planned change. Had the business relied on a physical technology architecture to undertake the transformation, it would have had to purchase capacity equivalent to 16 new servers. “There was no way with a small team we could grow to that extent in a short time,” Kalidindi says. “This was the right moment for us to explore cloud services.”
The business established two primary requirements the selected cloud service needed to meet. First, PaGaLGuY had to be able to scale the platform with costs rising only in proportion to the increase in resources consumed. Accordingly, the business would have to minimise the number of employees required to manage the cloud environment. Second, the platform had to give PaGaLGuY easy access to student data and the ability to undertake prompt, granular analysis.
PaGaLGuY reviewed available public cloud services and determined that Google Cloud Platform (GCP) was the best fit for its business. “Google Cloud Platform was considerably more mature than the alternatives, with a high degree of automation and a suite of managed services,” Kalidindi says. PaGaLGuY management then discussed with Google how to optimise cost, performance and availability of its personalised education network on GCP.
With assistance from Google and business transformation specialists Searce, PaGaLGuY was able to deliver the platform into production on GCP in 10 months. “Searce was very proactive in ensuring the environment met our needs and allowing us to gain priority access to Google services in development,” Kalidindi says. “Their team was integral to the success of the migration.”
PaGaLGuY has been running in production in GCP for two years. The education network’s GCP architecture comprises a scalable back-end built on Google App Engine; a managed environment for its containerised applications in Google Kubernetes Engine; messaging-oriented middleware through Google Cloud Pub/Sub; a relational database in Google Cloud SQL; a managed data analytics warehouse running in Google BigQuery; stream and batch data processing through Google Cloud Dataflow; and object storage in Google Cloud Storage.
PaGaLGuY has leveraged GCP services to break down its platform application from a monolithic build to a series of microservices running in Google App Engine that enable independent deployment cycles, minimise test and quality assurance overheads and provide clearer monitoring and logging.
Running on GCP has enabled PaGaLGuY to add new personalisation features and grow fourfold without having to add any new engineers or administrators to accommodate the increased traffic. The business has also used the platform to seamlessly collect and aggregate students’ data for analysis, reporting and delivering a more targeted user experience. Furthermore, PaGaLGuY has been able to provide its management team with direct access to Google BigQuery to scrutinise data rather than require them to wait at least a day to view reports created by the product or technology teams.
Support demand peaks of 1,200 requests per second
“Thanks to Google Cloud Platform, we can easily support demand peaks that see requests per second rise from an average 90 per second to about 1,200 per second for as long as 45 minutes,” Kalidindi says. Due to GCP’s scalability, PaGaLGuY can ensure its education network remains available and performance remains consistent during those periods.
Latency cut to 40 milliseconds
The business has also reduced average API latency from 1 second to about 40 milliseconds. Furthermore, using GCP has enabled PaGaLGuY to automate most of its processes and reduce system administration requirements from three to four days a week across its team members to about half an hour per week.
The performance of GCP has transformed PaGaLGuY’s culture and processes. “Once our team was exposed to Google Cloud Platform and understood the superiority of the platform, our mindset changed from ‘let us do everything on our own’ to ‘let us do what we do best’ and delegate the remainder,” Kalidindi says. The quality of the service provided by GCP means PaGaLGuY effectively considers the cloud provider as part of its team. “We are always eager to see what new services are being launched and are extremely excited about what Google Cloud Platform can provide as part of its roadmap.” he concludes.
Power up Caching with Memorystore for Memcached

3936
Of your peers have already read this article.
2:30 Minutes
The most insightful time you'll spend today!
In-memory data stores are a fundamental infrastructure for building scalable, high-performance applications. Whether it is building a highly responsive ecommerce website, creating multiplayer games with thousands of users, or doing real-time analysis on data pipelines with millions of events, an in-memory store helps provide low latency and scale for millions of transactions. Redis is a popular in-memory data store for use cases like session stores, gaming leaderboards, stream analytics, API rate limiting, threat detection, and more. Another in-memory data store, open source Memcached, continues to be a very popular choice as a caching layer for databases and is used for its speed and simplicity.
We’re announcing Memorystore for Memcached in beta, a fully managed, highly scalable service that’s compatible with the open source Memcached protocol. We launched Memorystore for Redis in 2018 to let you use the power of open source Redis easily without the burden of management. This announcement brings even more flexibility and choice for your caching layer.
Highlights of Memorystore for Memcached
Memcached offers a simple but powerful in-memory key value store and is popular as a front-end cache for databases. Using Memcached as a front-end store not only provides an in-memory caching layer for faster query processing, but it can also help save costs by reducing the load on your back-end databases.
Using Memorystore for Memcached provides several important benefits:
- Memorystore for Memcached is fully open source protocol compatible. If you are migrating applications using self-deployed Memcached or other cloud providers, you can simply migrate your application with zero code changes.
- Memorystore for Memcached is fully managed. All the common tasks that you spend time on, like deployment, scaling, managing node configuration on the client, setting up monitoring, and patching, are all taken care of. You can focus on building your applications.
- Right-sizing a cache is a common challenge with distributed caches. The scaling feature of Memorystore for Memcached, along with detailed open source Memcached monitoring metrics, allows you to scale your instance up and down easily to optimize for your cache-hit ratio and price. With Memorystore for Memcached, you can scale your cluster up to 5 TB per instance.
- Auto-discovery protocol lets clients adapt to changes programmatically, making it easy to deal with changes to the number of nodes during scaling. This drastically reduces manageability overhead and code complexity.
- You can monitor your Memorystore for Memcached instances with built-in dashboards in the Cloud Console and rich metrics in Cloud Monitoring.
Memorystore for Memcached can be accessed from applications running on Compute Engine, Google Kubernetes Engine (GKE), App Engine Flex, App Engine Standard, and Cloud Functions.
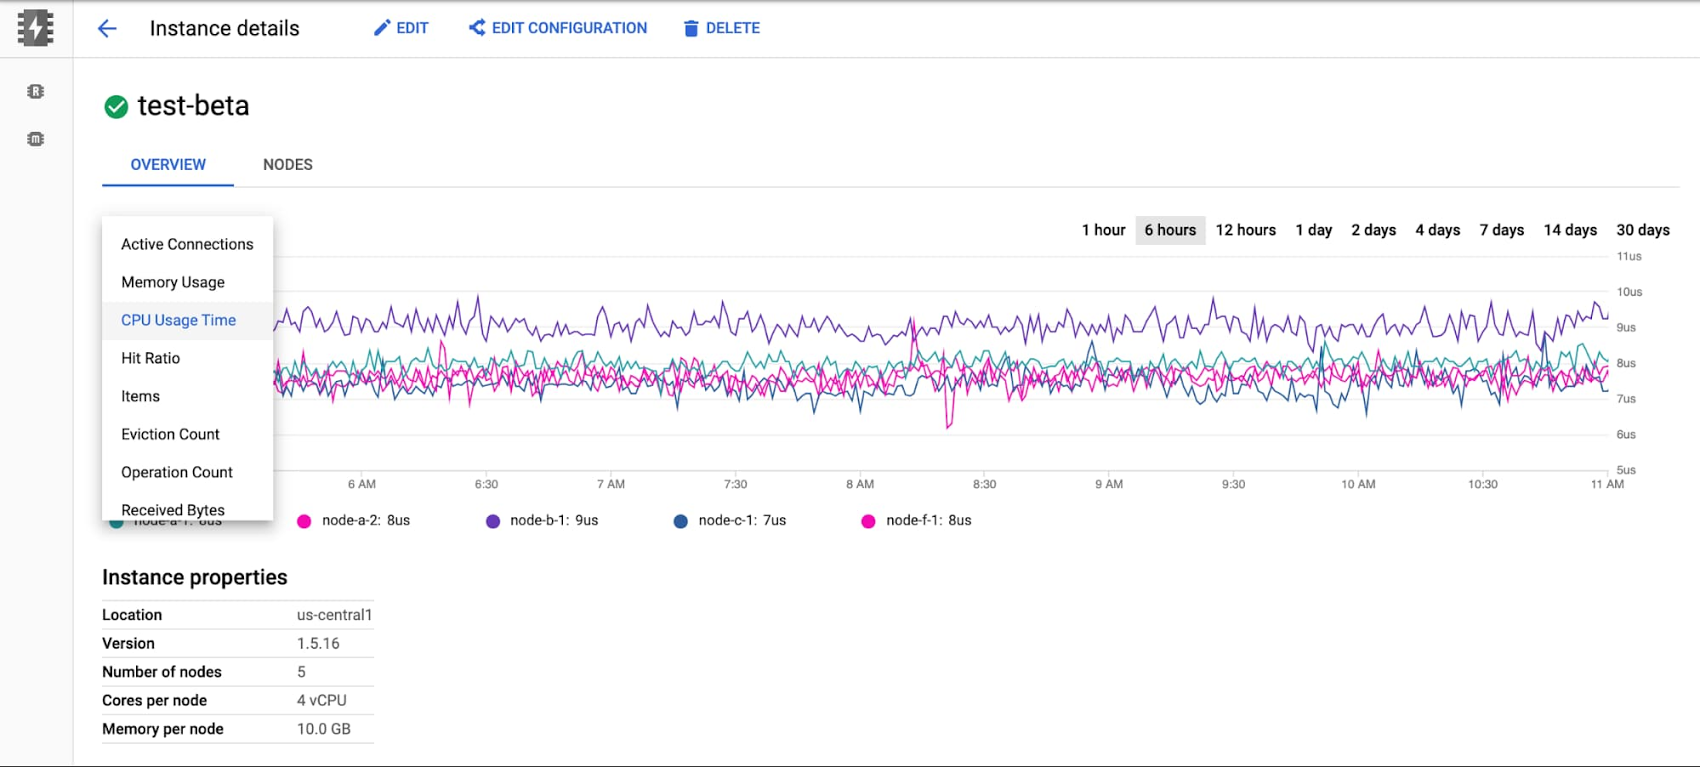
The beta launch is available in major regions across the U.S., Asia, and Europe, and will be available globally soon.
Getting started with Memorystore for Memcached
To get started with Memorystore for Memcached, check out the quick start guide. Sign up for a $300 credit to try Memorystore and the rest of Google Cloud. You can start with the smallest instance and when you’re ready, you can easily scale up to serve performance-intensive applications. Enjoy your exploration of Google Cloud and Memorystore for Memcached.
More Relevant Stories for Your Company

2022 Healthcare Trends: Healthcare Data, M&As, Better Patient Care, AI in Drug Development & Strategic Partnerships
The COVID-19 pandemic continues to push the healthcare and life sciences industry in entirely new ways. In record time, we’ve witnessed public health officials, vaccine developers, equipment manufacturers, and essential workers take life saving actions—regularly putting their own lives at risk—to respond to the exceptional challenges of our time. Yet




Indian Retailer Figures Optimizes Hyperlocal Delivery to Increase Customer Experience
Anyone who follows the Indian e-commerce scene knows that one of the largest challenges these companies face is hyperlocal delivery. That was a problem facing Wellness Forever, a retail chain of pharmacies with 150-plus stores across India. “Exactly a year ago, we started our journey of hyperlocal deliveries. This optimization

How Connected-Stories Uses BigQuery and AI/ML to Craft Personalized Ad Experiences
Editor’s note: The post is part of a series highlighting our awesome partners, and their solutions, that are Built with BigQuery In the field of producing engaging video content such as ads, many marketers ignore the power of data to improve their creative efforts to meet the consumers' need for

Migrating From Oracle OLTP System to Cloud Spanner
Spanner uses certain concepts differently from other enterprise database management tools, so you might need to adjust your application to take full advantage of its capabilities. You might also need to supplement Spanner with other services from Google Cloud to meet your needs. Migration constraints When you migrate your application
