





Google Cloud’s Data Analytics May Recap

6917
Of your peers have already read this article.
5:00 Minutes
The most insightful time you'll spend today!
May was a very busy month for data analytics product innovation. If you didn’t have the chance to attend our inaugural Data Cloud Summit, video replays of all our sessions are now available so feel free to watch them at your own pace.
In this blog, I’d like to share some background behind the innovations we released in May, why we built them the way we did, and the type of value they can bring your company and your team.
But first, a huge thank you!
This week, we had the honor to announce that Google has been named a Leader in The Forrester Wave™: Streaming Analytics, Q2 2021 report. Forrester gave Dataflow a score of 5 out of 5 across 12 different criteria, stating: “Google Cloud Dataflow has strengths in data sequencing, advanced analytics, performance, and high-availability”.
Google has more than a decade of experience in building real-time and internet-scale systems for its own needs, and we are excited to see that our ability to provide customers with a reliable, scalable, and performant platform is bearing fruit.
This announcement comes on the back of the release of The Forrester Wave™: Cloud Data Warehouse, Q1 2021 report, which also named Google Cloud as a Leader.
We couldn’t be more excited about the recognition and appreciate all your feedback and trust in the work that we do to support your goal in accelerating data-powered innovation.
Innovation galore
Your feedback and your passion is the fuel that drives our ambition to deliver more and better services to you. That’s why, this year, we didn’t want to wait until Google Cloud Next to share some great products we have been working on. On May 26, our team announced a slew of new products, services and programs. Watch a quick summary below:
https://youtube.com/watch?v=DG1mOPMXJvw%3Fenablejsapi%3D1%26
Meeting you where you are
An important design principle behind all of our services is “meeting you where you are”. This means we aim to provide you with the tools and software you need to innovate on your own terms. Here are three new services that will help you do just that:
Datastream
Datastream, our new serverless change data capture (CDC) and replication service, allows your company to synchronize data across heterogeneous databases, storage systems, and applications reliably and with minimal latency to support real-time analytics, database replication, and event-driven architectures. Datastream delivers change streams from Oracle and MySQL databases into Google Cloud services such as BigQuery, Cloud SQL, Cloud Storage, and Cloud Spanner, saving time and resources while ensuring your data is accurate and up-to-date.
- Under the hood, Datastream reads CDC events (inserts, updates, and deletes) from source databases, and writes those events with minimal latency to a data destination. It leverages the fact that each database source has its own CDC log—binlog for MySQL and LogMiner for Oracle—which it uses for its own internal replication and consistency purposes.
- Datastream integrates with purpose-built and extensible Dataflow templates to pull the change streams written to Cloud Storage, and create up-to-date replicated tables in BigQuery for analytics. It also leverages Dataflow templates to replicate and synchronize databases into Cloud SQL or Cloud Spanner for database migrations and hybrid cloud configurations.
- Datastream also powers a Google-native Oracle connector in Cloud Data Fusion’s new replication feature for easy ETL/ELT pipelining. By delivering change streams directly into Cloud Storage, customers can leverage Datastream to implement modern, event-driven architectures.
Looker and BigQuery Omni on Microsoft Azure
Research on multi cloud adoption is unequivocal — 92% of businesses in 2021 report having a multi cloud strategy. We want to continue supporting your choice by providing the flexibility you need to see your strategy through.
- This past month, we introduced Looker, hosted on Microsoft Azure. For the first time, you can now choose Azure, Google Cloud, or AWS for your Looker instance. You can also self-host your Looker instance on-premises.
- We also introduced BigQuery Omni for Azure, which along with last year’s introduction of BigQuery Omni for AWS, will help you access and securely analyze data across Google Cloud, AWS, and Azure.
The cost of moving data between cloud providers isn’t sustainable for many, and it’s still difficult to seamlessly work across clouds. BigQuery Omni represents a new way of analyzing data stored in multiple public clouds, which is made possible by BigQuery’s separation of compute and storage. By decoupling these two, BigQuery provides scalable storage that can reside in Google Cloud or other public clouds, and stateless resilient compute that executes standard SQL queries.
- Unlike competitors, BigQuery Omni doesn’t require you to move or copy your data from one public cloud to another, where you might incur egress costs. You also benefit from the same BigQuery interface on Google Cloud, enabling you to query data stored in Google Cloud, AWS, and Azure without any cross-cloud movement or copies of data.
- BigQuery Omni’s query engine runs the necessary compute on clusters in the same region where your data resides. For example, you can query Google Analytics 360 Ads data stored in Google Cloud and query logs data from your ecommerce platform and applications that are stored in AWS S3 and/or Microsoft Azure.
Then, using Looker, you can build a dashboard that allows you to visualize your audience behavior and purchases alongside your advertising spend.
Dataplex
We understand that most organizations still struggle to make high-quality data easily discoverable and accessible for analytics, across multiple silos, to a growing number of people and tools within their organization.
They are often forced to make tradeoffs. For instance, moving and duplicating data across silos to enable diverse analytics use cases or leaving their data distributed but limiting the agility of decisions.
- Dataplex provides an intelligent data fabric that enables you to centrally manage, monitor, and govern your data across data lakes, data warehouses, and data marts, while also ensuring data is securely accessible to a variety of analytics and data science tools.
- One of the core tenets of Dataplex is letting you organize and manage your data in a way that makes sense for your business, without data movement or duplication. For that, we provide logical constructs like lakes, data zones, and assets. These constructs enable you to abstract away the underlying storage systems and become the foundation for setting policies around data access, security, lifecycle management, and so on.
- For example, you can create a lake per department within your organization (e.g. Retail, Sales, Finance, etc.) and create data zones that map to data readiness and usage (e.g. landing, raw, curated_data_analytics, curated_data_science, etc.).
Once you have your lakes and zones setup, you can attach data to these zones as assets. You can add data from different types of storage (e.g. GCS Bucket and BigQuery dataset) under the same zone. You can also attach data across multiple projects under the same zone. You can ingest data into your lakes and zones using the tools of your choice, including services such as Dataflow, Data Fusion, Dataproc, Pub/Sub, or choose from one of our partner products. Dataplex comes with built-in 1-click templates for common data management tasks.
To find out more about Dataplex, head to cloud.google.com/dataplex or watch the video below:
https://youtube.com/watch?v=bbFeAt7cw1g%3Fenablejsapi%3D1%26
Helping you innovate everyday
Sharing data is hard. Traditional data sharing techniques use batch data pipelines that are expensive to run, create late arriving data, and can break with any changes to the source data. These techniques also create multiple copies of data, which brings unnecessary costs and can bypass data governance processes. They also fail to offer features for data monetization, such as managing subscriptions and entitlements. Altogether, these challenges mean that organizations are unable to realize the full potential of transforming their business with shared data.
Analytics Hub
To address these limitations, we are introducing Analytics Hub, a new fully managed service that helps organizations unlock the value of data sharing, leading to new insights and increased business value.
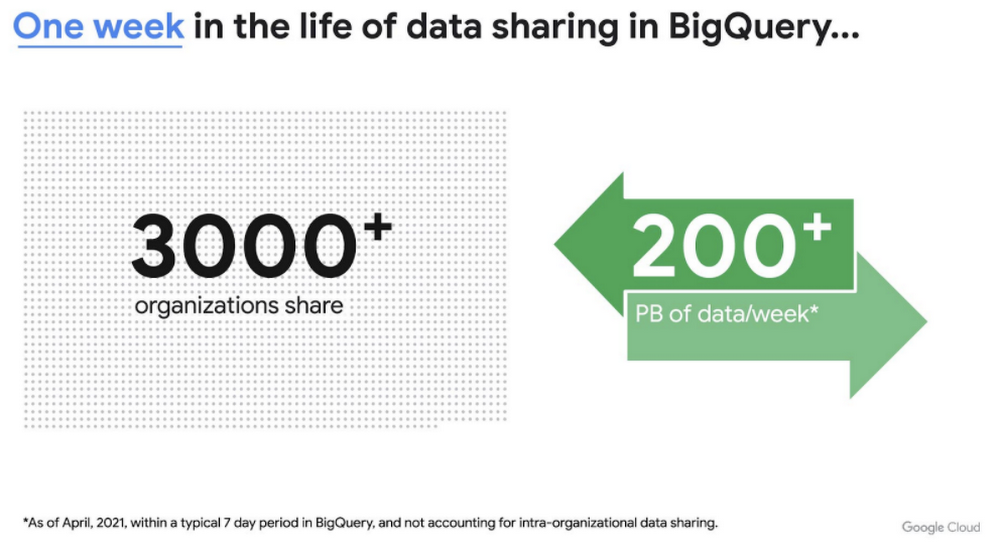
This new service is built on the tremendous experience and feedback we have received over the years. For example, BigQuery has had cross-organizational, in-place data sharing capabilities since its inception in 2010—and the functionality is very popular. Over a 7-day period in April, we had over 3,000 different organizations sharing over 200 petabytes of data. These numbers don’t include data sharing between departments within the same organization.
Analytics Hub takes sharing to the next level, making it easy for you to publish, discover, and subscribe to valuable datasets that you can combine with your own data to derive unique insights.
This includes:
- Shared datasets: As a data publisher, you create shared datasets that contain the views of data that you want to deliver to your subscribers. Data subscribers can search through the datasets that are available across all exchanges for which they have access and subscribe to relevant datasets. In addition, the publisher can track subscribers, disable subscriptions, and see aggregated usage information for the shared data.
- Curated, self-service data exchanges: Exchanges are collections used to organize and secure shared datasets. By default, exchanges are completely private, but granular roles and permissions make it easy to deliver data to the right audience—whether internal or public.
This is just the beginning for Analytics Hub. Please sign up for the preview, which is scheduled to be available in the third quarter of 2021.
Dataflow Prime
At Google Cloud, we have the great privilege of working with some of the most innovative organizations in the world. And this work provides us with a unique perspective into the future of big data processing. Dataflow Prime is a new platform based on a serverless, no-ops, and auto-tuning architecture that brings unparalleled resource utilization and radical operational simplicity to big data processing. This new service introduces a large number of exciting capabilities but I’d like to highlight three key aspects of the product:
- Vertical Autoscaling: Dataflow Prime dynamically adjusts the compute capacity allocated to each worker based on utilization, detecting when jobs are limited by worker resources and automatically adding more resources. Vertical Autoscaling works hand in hand with Horizontal Autoscaling to seamlessly scale workers to best fit the needs of the pipeline. As a result, it no longer takes hours or days to determine the perfect worker configuration to maximize utilization.
- Right Fitting: Each stage of a pipeline typically has a different resource requirement than the others. Until now, either all workers in the pipeline would have had the higher memory and GPU, or none of them would. Pipelines either had to waste resources or suffer slower workloads. Right Fitting solves this problem by creating stage-specific pools of resources, optimized for each stage.
- Smart Recommendations: Smart Recommendations automatically detects problems in your pipeline and shows potential fixes. For example, if your pipeline is running into permissions issues, a Smart Recommendation will detect which IAM permissions you need to enable to unblock your job. If you are using an inefficient coder in your job, Smart Recommendations will surface more performant coder implementations that can help you save on costs.
What’s next
We’re excited to hear your thoughts and feedback about all these exciting new services. I would also highly recommend that you connect with members of the community to learn more about their story and journey. A good example to start with is the Data To Value customer panel we produced at our inaugural Data Cloud Summit with the Chief Data Officers of Keybank and Rackspace. You can watch it for free below:
https://youtube.com/watch?v=ITI2Q3MkxuA%3Fenablejsapi%3D1%26
Migrating Hadoop to Dataproc by LiveRamp: Best Practices
2882
Of your peers have already read this article.
3:30 Minutes
The most insightful time you'll spend today!
Abstract
In this blog, we describe our journey to the cloud and share some lessons we learned along the way. Our hope is that you’ll find this information helpful as you go through the decision, execution, and completion of your own migration to the cloud.
Introduction
LiveRamp is a data enablement platform powered by identity, centered on privacy, integrated everywhere. Everything we do centers on making data safe and easy for businesses to use. Our Safe Haven platform powers customer intelligence, engages customers at scale, and creates breakthrough opportunities for business growth.
Businesses safely and securely bring us their data for enrichment and use the insights gained to deliver better customer experiences and generate more valuable business outcomes. Our fully interoperable and neutral infrastructure delivers end-to-end addressability for the world’s top brands, agencies, and publishers. Our platforms are designed to handle the variability and surge of the workload and guarantee service-level agreements (SLAs) to businesses.
We process petabytes of batch and streaming data daily. We ingest, process (join and enhance), and distribute this data. We receive and distribute data from thousands of partners and customers on a daily basis. We maintain the world’s largest and most accurate identity graph and work with more than 50 leading demand-side and supply-side platforms.
Our decision to migrate to Google Cloud and Dataproc
As an early adopter of Apache Hadoop, we had a single on-prem production managed Hadoop cluster that was used to store all of LiveRamp’s persistent data (HDFS) and run the Hadoop jobs that make up our data pipeline (YARN). The cluster consisted of around 2500 physical machines with a total of 30PB or raw storage, ~90,000 vcores, and ~300TB of memory. Engineering teams managed and ran multiple MapReduce jobs on these clusters.
The sheer volume of applications that LiveRamp ran on this cluster caused frequent resource contention issues, not to mention potentially widespread outages if an application was tuned improperly. Our business was scaling and we were running into constraints related to data center space and power in our on-premises environment. These constraints restricted our ability to meet our business objectives so a strategic decision was made to leverage elastic environments and migrate to the cloud. The decision required financial analysis and a detailed understanding of the available options, from do-it-yourself and vendor-managed distributions to leveraging cloud-managed services.
LiveRamp’s target architecture
We ultimately chose Google Cloud and Dataproc, a managed service for Hadoop, Spark, and other big data frameworks. During the migration we made a few fundamental changes to our Hadoop infrastructure:
Instead of 1 large persistent cluster managed by a central team, we have decentralized the cluster ownership to individual teams. This gave the teams flexibility to recreate, perform upgrades or change configurations as they see fit. This also gives us better cost attribution, less blast radius for errors, and less chance that – a rogue job from one team will impact the rest of the workloads.
Persistent data is no longer stored in HDFS on the clusters, it is in Google Cloud Storage, which, conveniently, served as a drop in replacement, as GCS is compatible with all the same APIs as HDFS. This means we can delete all the virtual machines that are part of the cluster without losing any data.
Introduced autoscaling clusters to control compute cost, and to dramatically decrease request latency. On premise you’re paying for the machines so you might as well use them. Cloud compute is elastic so you want to burst when there is demand and scale down when you can.
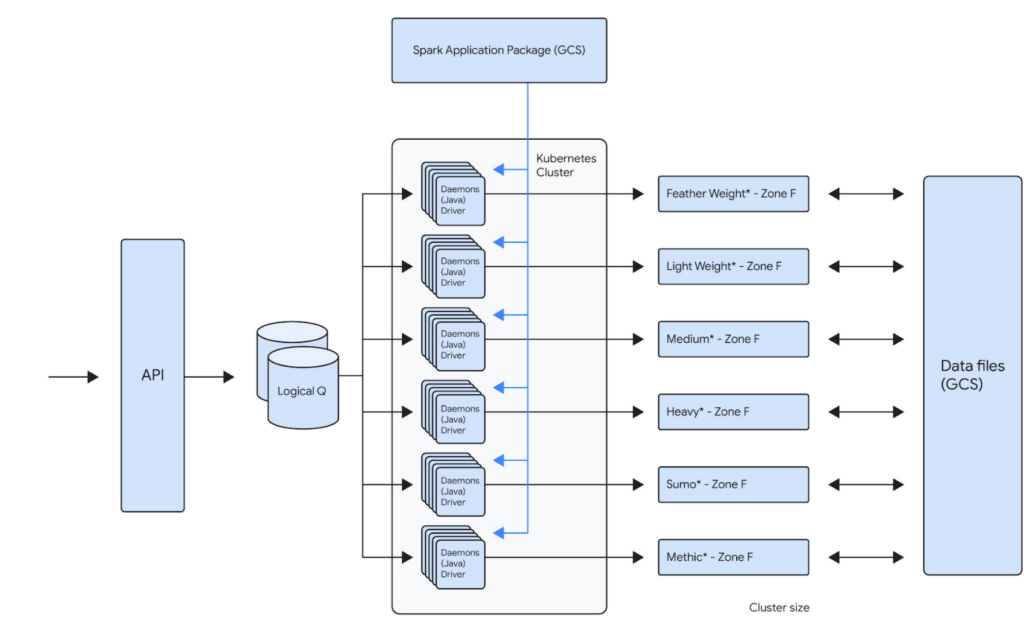
For example, one of our teams runs about 100,000 daily Spark jobs on 12 Dataproc clusters that each independently scale up to 1000 VMs. This gives that team a current peak capacity of about 256,000 cores. Because the team is bound to its own GCP Project inside of a GCP Organization, the cost attributed to that team is now very easy to report. The team uses architecture represented below to distribute the jobs across the clusters. This architecture allows them to bin similar workloads together so that they can be optimized together. Below is the logical architecture of the above workload:
Our approach
Overall migration and post migration stabilization/optimization of the largest of our workloads took us about several years to complete. We broadly broke down the migration into multiple phases.
Initial Proof-Of-Concept
When analyzing solutions for cloud-hosted big data services, any product had to meet our clear acceptance criteria:
- Cost: Dataproc is not particularly expensive compared to similar alternatives, but our discount with the existing managed Hadoop partner made it expensive. We have initially accepted that the cost would remain the same. We did see cost benefits post migration, after several rounds of optimizations.
- Features: Some key features (compared to current state) that we were looking for are built-in autoscaler, ease of creating/updating/deleting clusters, managed big data technologies etc.
- Integration with GCP: As we had already decided to move other LiveRamp-owned services to GCP, a big data platform with robust integration with GCP was a must. Basically, we’d like to be able to leverage GCP features without a lot of effort on our end (custom vms, preemptible vms, etc).
- Performance: Cluster creation, deletion, scale up, and scale down should be fast. This will allow teams to iterate and react quickly. These are some rough estimates of how fast the cluster operations should be:
- Cluster creation: <15 minutes
- Cluster Deletion: <15 minutes
- Adding 50 nodes: <20 minutes
- Removing 200 nodes: <10 minutes
- Reliability: Bug free and low downtime software that has concrete SLAs on clusters and a strong commitment to the correct functioning of all of its features.
An initial prototype to better understand Dataproc and Google Cloud helped us prove that target technologies and architecture will give us reliability and cost improvements. This also fed into our decisions around target architecture. This was then reviewed by the Google team before we embarked on the migration journey.
Overall migration
Terraform module
Our ultimate goal is to create self-service tooling that allows our data engineers to deploy infrastructure as easily and safely as possible. After defining some best practices around cluster creation and configuration, the central team’s first step was to build a terraform module that can be used by all the teams to create their own clusters. This module will create a dataproc cluster along with all supporting buckets, pods and datadog monitors:
- A dataproc cluster autoscaling policy that can be customized
- A dataproc cluster with LiveRamp defaults preconfigured
- Sidecar applications for recording job metrics from the job history server and for monitoring the cluster health
- Pre configured datadog cluster health monitors for alerting
This Terraform module is also composed of multiple supporting modules underneath. This allows users to call the supporting modules directly in your project terraform as well if such a need arises. The module can be used to create a cluster by just setting the parameters like project id, path to application source (Spark or Map/Reduce), subnet, VM instance type, auto scaling policy etc.
Workload migration
Based on our analysis of Dataproc, discussions with GCP team and the POC, we used following criteria:
- We prioritized applications that can use preemptibles to achieve cost parity to our existing workloads
- We prioritized some of our smaller workloads initially to build momentum within the organization. For example, we left the single workload that accounted for ~40% of our overall batch volume to the end, after we had gained enough experience as an organization.
- We combined the migration to Spark along with the migration to Dataproc. This has initially resulted in some extra dev work but helped reduce the effort for testing and other activities.
Our initial approach was to lift and shift from existing managed providers and Map/Reduce to Dataproc and Spark. We then later focused on optimizing the workloads for cost and reliability.
What’s working well
Cost Attribution
As is true with any business, it’s important to know where your cost centers are. Moving from a single cluster, made opaque by the number of teams loading work onto it, to GCP’s Organization/Project structure has made cost reporting very simple. The tool breaks down cost by project, but also allows us to attribute cost to a single cluster via tagging. As we sometimes deploy a single application to a cluster, this helps us to make strategic decisions on cost optimizations at an application level very easily.
Flexibility
The programmatic nature of deploying Hadoop clusters in a cloud like GCP dramatically reduces the time and effort involved in making infrastructure changes. LiveRamp’s use of a self-service Terraform module means that a data engineering team can very quickly iterate on cluster configurations. This allows a team to create a cluster that is best for their application while also adhering to our security and health monitoring standards. We also get all the benefits of infrastructure as code: highly complicated infrastructure state is version controlled and can be easily recreated and modified in a safe way.
Support
When our teams face issues with services that run on Dataproc, the GCP team is always quick to respond. They work very closely with LiveRamp to develop new features for our needs. They proactively provide LiveRamp with preview access to new features that help LiveRamp to stay ahead of the curve in the Data Industry.
Cost Savings
We have achieved around 30% cost savings in certain clusters by achieving the right balance between on-demand and PVMs. The cost savings were a result of our engineers building efficient A/B testing frameworks that helped us run the clusters/jobs in several configurations to arrive at the most reliable, maintainable and cost efficient configuration. Also, one of the applications is now 10x + faster.
Five lessons learned
Migration was a successful exercise that took about six months to complete, across all our teams and applications. While many aspects went really well, we also learned a few things along the way that we hope will help you when planning your own migration journey.
- Benchmark, benchmark, benchmark
It’s always a good idea to benchmark the current platform against the future platform to compare costs and performance. On-premises environments have a fixed capacity, while cloud platforms can scale to meet workload needs. Therefore, it’s essential to ensure that the current behavior of the key workload is clearly understood before the migration.
- Focus on one thing at a time
We initially focused on reliability while remaining cost-neutral during the migration process, and then focused on cost optimization post-migration. Google teams were very helpful and instrumental in identifying cost optimization opportunities.
- Be aware of alpha and beta products
Although there usually aren’t any guarantees of a final feature set when it comes to pre-released products, you can still get a sense of their stability and create a partnership if you have a specific use case. In our specific use case, Enhanced Flexibility Mode was in alpha stage in April 2019, beta in August 2020, and released in July 2021. Therefore, it was helpful to check in on the product offering and understand its level of stability so we could carry out risk analysis and decide when we felt comfortable adopting it.
- Think about quotas
Our Dataproc clusters could support much higher node counts than was possible with our previous vendor. This meant we often had to increase IP space and change quotas, especially as we tried out new VM and disk configurations.
- Preemptable and committed use discounts (CUDs)
CUDs make compute less expensive while preemptables make compute significantly less expensive. However, preemptibles don’t count against your CUD purchases, so make sure you understand the impact on your CUD utilization when you start to migrate to preemptables.
We hope these lessons will help you in your Data Cloud journey.
Google Cloud Helped Digitec Galaxus Personalize Over 2 Million Newsletters in a Week
8310
Of your peers have already read this article.
3:00 Minutes
The most insightful time you'll spend today!
Digitec Galaxus AG is the biggest online retailer in Switzerland, operating two online stores: Digitec, Switzerland’s online market leader for consumer electronics and media products, and Galaxus, the largest Swiss online shop with a steadily growing range of consistently low-priced products for almost all daily needs.
Known for its efficient, personalized shopping experiences, it’s clear that Digitec Galaxus understands what it takes to deliver a platform that is interesting and relevant to customers every time they shop.
The problem: Personalizing decisions for every situation
Digitec Galaxus already had established an engine to help them personalize experiences for shoppers when they reached out to Google Cloud. They had multiple recommendation systems in place and were also extensive early adopters of Recommendations AI, which already enabled them to offer personalized content in places like their homepages, product detail pages, and their newsletter.
But those same systems sometimes made it difficult to understand how best to combine and optimize to create the most personalized experiences for their shoppers. Their requirements were threefold:
- Personalization: They have over 12 recommenders they can display on the app, however they would like to contextualize this and choose different recommenders (which in turn select the items) for different users. Furthermore they would like to exploit existing trends as well as experiment with new ones.
- Latency: They would like to ensure that the solution is architected so that the ranked list of recommenders can be retrieved with sub 50 ms latency.
- End-to-end easy to maintain & generalizable/modular architecture: Digitec wanted the solution to be architected using an easy to maintain, open source stack, complete with all MLops capabilities required to train and use contextual bandits models. It was also important to them that it is built in a modular fashion such that it can be adapted easily to other use cases which have in mind such as recommendations on the homepage, Smartags and more .
To improve, they asked us to help them implement a machine learning (ML) contextual bandit based recommender system on Google Cloud taking all the above factors into consideration to take their personalization to the next level.
Contextual bandits algorithms are a simplified form of reinforcement learning and help aid real-world decision making by factoring in additional information about the visitor (context) to help learn what is most engaging for each individual. They also excel at exploiting trends which work well, as well as exploring new untested trends which can yield potentially even better results. For instance, imagine that you are personalizing a homepage image where you could show a comfy living room couch or pet supplies.
Without a contextual bandit algorithm, one of these images would be shown to someone at random without considering information you may have observed about them during previous visits. Contextual bandits enable businesses to consider outside context, such as previously visited pages or other purchases, and then observe the final outcome (a click on the image) to help determine what works best.
Creating a personalization system with contextual bandits
While Digitec Galaxus heavily personalizes their website homepages, they are very very sensitive and also require more cross-team collaboration to update and make changes.
Together with the Digitec Galaxus team, we decided to narrow the scope and focus on building a contextual bandit personalization system for the newsletter first. The digitec Galaxus team has complete control over newsletter decisions and testing various ML experiments on a newsletter would have less chance of adverse revenue impact than a website homepage.
The main goal was to architect a system that could be easily ported over to the homepage and other services offered by Digitec with minimal adaptations. It would also need to satisfy the functional and non-functional requirements of the homepage as well as other internal use cases.
Below is a diagram of how the newsletter’s personalization recommendation system works:

- The system is given some context features about the newsletter subscriber such as their purchase history and demographics. Features are sometimes referred to as variables or attributes, and can vary widely depending on what data is being analyzed.
- The contextual bandit model trains recommendations using those context features and 12 available recommenders (potential actions).
- The model then calculates which action is most likely to enhance the chance of reward (a user clicking in the newsletter) and also minimize the problem (an unsubscribe).
Calculating whether a click was a newsletter or an unsubscribe enabled the system to optimize for increasing clicks and avoid showing non-relevant content to the user (click-bait). This enabled Digitec Galaxus to exploit popular trends while also exploring potentially better-performing trends.
How Google Cloud helps
The newsletter context-driven personalization system was built on Google Cloud architecture using the ML recommendation training and prediction solutions available within our ecosystem.
Below is a diagram of the high-level architecture used:
The architecture covers three phases of generating context-driven ML predictions, including:
ML Development: Designing and building the ML models and pipeline
Vertex Notebooks are used as data science environments for experimentation and prototyping. Notebooks are also used to implement model training, scoring components, and pipelines. The source code is version controlled in Github. A continuous integration (CI) pipeline is set up to automatically run unit tests, build pipeline components, and store the container images to Cloud Container Registry.
ML Training: Large-scale training and storing of ML models
The training pipeline is executed on Vertex Pipelines. In essence, the pipeline trains the model using new training data extracted from BigQuery and produces a trained, validated contextual bandit model stored in the model registry. In our system, the model registry is a curated Cloud Storage.
The training pipeline uses Dataflow for large scale data extraction, validation, processing, and model evaluation, and Vertex Training for large-scale distributed training of the model. AI Platform Pipelines also stores artifacts, the output of training models, produced by the various pipeline steps to Cloud Storage. Information about these artifacts are then stored in an ML metadata database in Cloud SQL. To learn more about how to build a Continuous Training Pipeline, read the documentation guide.
ML Serving: Deploying new algorithms and experiments in production
The training pipeline uses batch prediction to generate many predictions at once using AI Platform Pipelines, allowing Digitec Galaxus to score large data sets. Once the predictions are produced, they are stored in Cloud Datastore for consumption. The pipeline uses the most recent contextual bandit model in the model registry to evaluate the inference dataset in BigQuery and give a ranked list of the best newsletters for each user, and persist it in Datastore. A Cloud Function is provided as a REST/HTTP endpoint to retrieve the precomputed predictions from Datastore.
All components of the code and architecture are modular and easy to use, which means they can be adapted and tweaked to several other use cases within the company as well.
Better newsletter predictions for millions
The newsletter prediction system was first deployed in production in February, and Digitec Galaxus has been using it to personalize over 2 million newsletters a week for subscribers. The results have been impressive, 50% higher than our baseline. However, the collaboration is still ongoing to improve the results even more.
“Working at this level in direct exchange with Google’s machine learning experts is a unique opportunity for us. The use of contextual bandits in the targeting of our recommendations enables us to pursue completely new approaches in personalization by also personalizing the delivery of the respective recommender to the user. We have already achieved good results in our newsletter in initial experiments and are now working on extending the approach to the entire newsletter by including more contextual data about the bandits arms. Furthermore, as a next step, we intend to apply the system to our online store as well, in order to provide our users with an even more personalized experience. To build this scalable solution, we are using Google’s open source tools such as TFX and TF Agents, as well as Google Cloud Services such as Compute Engine, Cloud Machine Learning Engine, Kubernetes Engine and Cloud Dataflow.”—Christian Sager, Product Owner, Personalization ( Digitec Galaxus)
Since the existing architecture and system is also dynamic, it will automatically adapt to new behaviours, trends, and users. As a result, Digitec Galaxus plans to re-use the same components and extend the existing system to help them improve the personalization of their homepage and other current use cases they have within the company. Beyond clicks and user engagement, the system’s flexibility also allows for future optimization of other criteria. It’s a very exciting time and we can’t wait to see what they build next!
Cloud IoT Core Helps Businesses Leverage their IoT Data to Build a Competitive Edge

7106
Of your peers have already read this article.
1:30 Minutes
The most insightful time you'll spend today!
The ability to gain real-time insights from IoT data can redefine competitiveness for businesses. Intelligence allows connected devices and assets to interact efficiently with applications and with human beings in an intuitive and non-disruptive way. After your IoT project is up and running, many devices will be producing lots of data. You need an efficient, scalable, affordable way to both manage those devices and handle all that information.
IoT Core is a fully managed service for managing IoT devices. It supports registration, authentication, and authorization inside the Google Cloud resource hierarchy as well as device metadata stored in the cloud, and the ability to send device configuration from other GCP or third-party services to devices.
Main components
The main components of Cloud IoT Core are the device manager and the protocol bridges:
- The device manager registers devices with the service, so you can then monitor and configure them. It provides:
- Device identity management
- Support for configuring, updating, and controlling individual devices
- Role-level access control
- Console and APIs for device deployment and monitoring
- Two protocol bridges (MQTT and HTTP) can be used by devices to connect to Google Cloud Platform for:
- Bi-directional messaging
- Automatic load balancing
- Global data access with Pub/Sub
How does Cloud IoT Core work?
Device telemetry data is forwarded to a Cloud Pub/Sub topic, which can then be used to trigger Cloud Functions as well as other third-party apps to consume the data. You can also perform streaming analysis with Dataflow or custom analysis with your own subscribers.
Cloud IoT Core supports direct device connections as well as gateway-based architectures. In both cases the real time state of the device and the operational data is ingested into Cloud IoT Core and the key and certificates at the edge are also managed by Cloud IoT Core. From Pub/Sub the raw input is fed into Dataflow for transformation, and the cleaned output is populated in Cloud Bigtable for real-time monitoring or BigQuery for warehousing and machine learning. From BigQuery the data can be used for visualization in Looker or Data Studio and it can be used in Vertex AI for creating machine learning models. The models created can be deployed at the edge using Edge Manager (in experimental phase). Device configuration updates or device commands can be triggered by Cloud Functions or Dataflow to Cloud IoT Core, which then updates the device.
Design principles of Cloud IoT Core
As a managed service to securely connect, manage, and ingest data from global device fleets, Cloud IoT COre is designed to be:
- Flexible, providing easy provisioning of device identities and enabling devices to access most of Google Cloud
- IThe industry leader in IoT scalability and performance
- Interoperable, with supports for the most common industry-standard IoT protocols
Use cases
IoT use cases range across numerous industries. Some typical examples include:
- Asset tracking, visual inspection, and quality control in retail, automotive, industrial, supply chain and logistics
- Remote monitoring and predictive maintenance in oil & gas, utilities, manufacturing, and transportation
- Connected homes and consumer technologies.
- Vision intelligence in retail, security, manufacturing, and industrial sectors
- Smart living in commercial, residential, and smart spaces
- Smart factories with predictive maintenance and real-time plant floor analytics
For a more in-depth look into Cloud IoT Core check out the documentation.
https://youtube.com/watch?v=76v16P-Wqe4%3Fenablejsapi%3D1%26
For more #GCPSketchnote, follow the GitHub repo. For similar cloud content follow me on Twitter @pvergadia and keep an eye out on thecloudgirl.dev.
BigQuery Helps Insurance Firms Leverage Previous Storm Data for Better Pricing Insights

8567
Of your peers have already read this article.
2:00 Minutes
The most insightful time you'll spend today!
It may be surprising to know that U.S. natural catastrophe economic losses totaled $119 billion in 2020, and 75% (or $89.4B) of those economic losses were caused by severe storms and cyclones. In the insurance industry, data is everything. Insurers use data to influence underwriting, rating, pricing, forms, marketing, and even claims handling. When fueled by good data, risk assessments become more accurate and produce better business results. To make this possible, the industry is increasingly turning to predictive analytics, which uses data, statistical algorithms, and machine learning (ML) techniques to predict future outcomes based on historical data. Insurance firms also integrate external data sources with their own existing data to generate more insight into claimants and damages. Google Cloud Public Datasets offers more than 100 high-demand public datasets through BigQuery that helps insurers in these sorts of data “mashups.”
One particular dataset that insurers find very useful is Severe Storm Event Details from the U.S. National Oceanic and Atmospheric Administration (NOAA). As part of the Google Cloud Public Datasets program and NOAA’s Public Data Program, this severe storm data contains various types of storm reports by state, county, and event type—from 1950 to the present—with regular updates. Similar NOAA datasets within the Google Cloud Public Datasets program include the Significant Earthquake Database, Global Hurricane Tracks, and the Global Historical Tsunami Database.
In this post, we’ll explore how to apply storm event data for insurance pricing purposes using a few common data science tools—Python Notebook and BigQuery—to drive better insights for insurers.
Predicting outcomes with severe storm datasets
For property insurers, common determinants of insurance pricing include home condition, assessor and neighborhood data, and cost-to-replace. But macro forces such as natural disasters—like regional hurricanes, flash floods, and thunderstorms—can also significantly contribute to the risk profile of the insured. Insurance companies can leverage severe weather data for dynamic pricing of premiums by analyzing the severity of those events in terms of past damage done to property and crops, for example.
It’s important to set the premium correctly, however, considering the risks involved. Insurance companies now run sophisticated statistical models, taking into account various factors—many of which can change over time. After all, without accurate data, poor predictions can lead to business losses, particularly at scale.
The Severe Storm Event Details database includes information about a storm event’s location, azimuth (an angle measurement used in celestial coordination), distance, impact, and severity, including the cost of damages to property and crops. It documents:
- The occurrence of storms and other significant weather events of sufficient intensity to cause loss of life, injuries, significant property damage, and/or disruption to commerce.
- Rare, unusual weather events that generate media attention, such as snow flurries in South Florida or the San Diego coastal area.
- Other significant weather events, such as record maximum or minimum temperatures or precipitation that occur in connection with another event.
Data about a specific event is added to the dataset within 120 days to allow time for damage assessments and other analysis.
Driving business insights with BigQuery and notebooks
Google Cloud’s BigQuery provides easy access to this data in multiple ways. For example, you can query directly within BigQuery and perform analysis using SQL.
Another popular option in the data science and analyst community is to access BigQuery from within the Notebook environment to intersperse Python code and SQL text, and then perform ad hoc experimentation. This uses the powerful BigQuery compute to query and process huge amounts of data without having to perform the complex transformations within the memory in Pandas, for example.
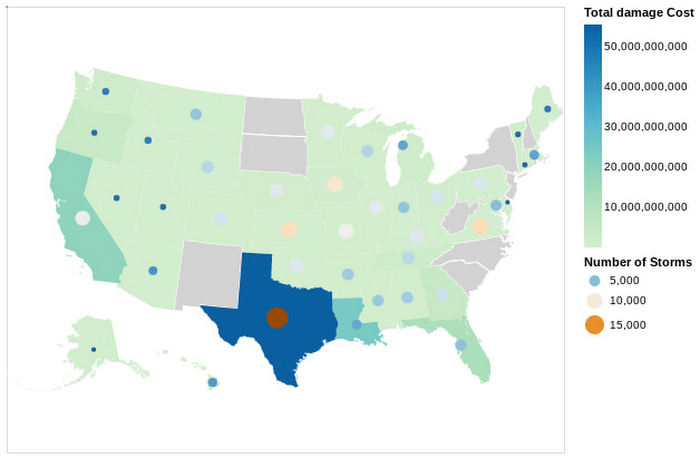
In this Python notebook, we have shown how the severe storm data can be used to generate risk profiles of various zip codes based on the severity of those events as measured by the damage incurred. The severe storm dataset is queried to retrieve a smaller dataset into the notebook, which is then explored and visualized using Python. Here’s a look at the risk profiles of the zip codes:
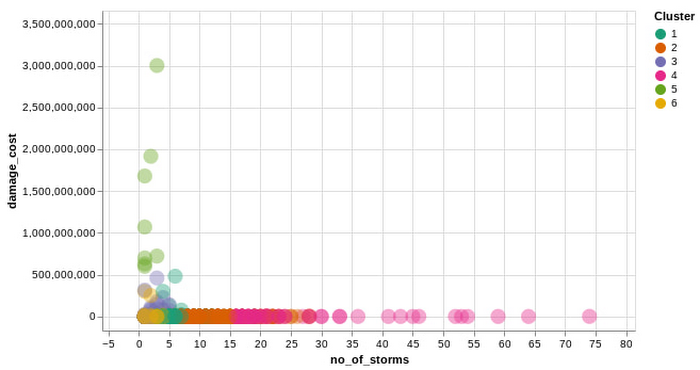
Another Google Cloud resource for insurers is BigQuery ML, which allows them to create and execute machine learning models on their data using standard SQL queries. In this notebook, with a K-Means Clustering algorithm, we have used BigQuery ML to generate different clusters of zip codes in the top five states impacted by severe storms. These clusters show different levels of impact by the storms, indicating different risk groups.
The example notebook is a reference guide to enable analysts to easily incorporate and leverage public datasets to augment their analysis and streamline the journey to business insights. Instead of having to figure out how to access and use this data yourself, the public datasets, coupled with BigQuery and other solutions, provide a well-lit path to insights, leaving you more time to focus on your own business solutions.
Making an impact with big data
Google Cloud’s Public Datasets is just one resource within the broader Google Cloud ecosystem that provides data science teams within the financial services with flexible tools to gather deeper insights for growth. The severe storm dataset is a part of our environmental, social, and governance (ESG) efforts to organize information about our planet and make it actionable through technology, helping people make a positive impact together.
To learn more about this public dataset collaboration between Google Cloud and NOAA, attend the Dynamic Pricing in Insurance: Leveraging Datasets To Predict Risk and Price session at the Google Cloud Financial Services Summit on May 27. You can also check out our recent blog and explore more about BigQuery and BigQuery ML.
Spot Slow MySQL Queries Fast with Stackdriver Monitoring

4036
Of your peers have already read this article.
4:30 Minutes
The most insightful time you'll spend today!
When you’re serving customers online, speed is essential for a good experience. As the amount of data in a database grows, queries that used to be fast can slow down.
For example, if a query has to scan every row because a table is missing an index, response times that were acceptable with a thousand rows can turn into multiple seconds of waiting once you have a million rows.
If this query is executed every time a user loads your web page, their browsing experience will slow to a crawl, causing user frustration. Slow queries can also impact automated jobs, causing them to time out before completion.
If there are too many of these slow queries executing at once, the database can even run out of connections, causing all new queries, slow or fast, to fail.
The popular open-source databases MySQL and Google Cloud Platform‘s fully managed version, Cloud SQL for MySQL, include a feature to log slow queries, letting you find the cause, then optimize for better performance.
However, developers and database administrators typically only access this slow query log reactively, after users have seen the effects and escalated the performance degradation.
With Stackdriver Logging and Monitoring, you can stay ahead of the curve for database performance with automatic alerts when query latency goes over the threshold, and a monitoring dashboard that lets you quickly pinpoint the specific queries causing the slowdown.
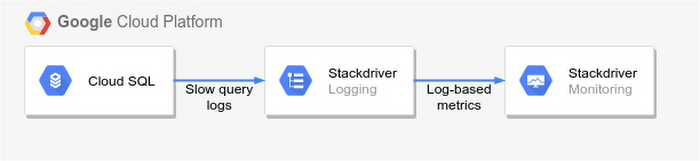
To get started, import MySQL’s slow query log into Stackdriver Logging.
Once the logs are in Stackdriver, it’s straightforward to set up logs-based metrics that can both count the number of slow queries over time, which is useful for setting up appropriate alerts, and also provide breakdowns by slow SQL statement, allowing speedy troubleshooting.
What’s more, this approach works equally well for managed databases in Cloud SQL for MySQL and for self-managed MySQL databases hosted on Compute Engine.
For a step-by-step tutorial to set up slow query monitoring, check out Monitoring slow queries in MySQL with Stackdriver. For more ideas about what else you can accomplish with Stackdriver Logging, check out Design patterns for exporting Stackdriver Logging.
More Relevant Stories for Your Company

Two Ad Agencies Leverage BigQuery to Support Next-gen Ad Campaigns
Advertising agencies are faced with the challenge of providing the precision data that marketers require to make better decisions at a time when customers’ digital footprints are rapidly changing. They need to transform customer information and real-time data into actionable insights to inform clients what to execute to ensure the

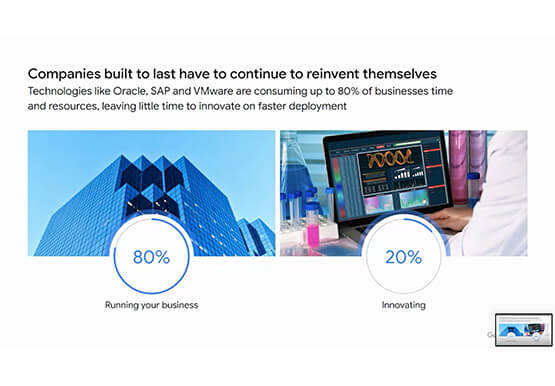

Business Modernization with Oracle Workloads in Google Cloud
With today's ever-changing business dynamics, business continuity is a key focus for all of us, and enterprise databases like Oracle play a critical role. We’ll explore how running Oracle workloads in Google Cloud creates a variety of solutions, from a Bare Metal Solution to open source and cloud-native databases, to

Key Highlights on Data Analytics to Smooth Your Organization’s Data Journey
As the Olympics kicked off in Tokyo at the end of July, we found ourselves reflecting on the beauty of diverse countries and cultures coming together to celebrate greatness and sportsmanship. For this month’s blog, we’d like to highlight some key data and analytics performances that should help inspire you

Making Mothers’ Day Special: How Google Cloud Migration for 1-800-FLOWERS.COM, Inc Impacts CX
Editor’s note: In honor of Mother’s Day, we look at how 1-800-FLOWERS.COM, Inc. migrated to Google Cloud as part of its digital transformation to quickly deploy seamless and convenient customer experiences across multiple brands on Mother’s Day and every day. As a leading provider of gifts designed to help customers
