





Held Back by Database Scalability, This Financial Services Company Switches to Google Cloud and Cloud Spanner

11563
Of your peers have already read this article.
4:30 Minutes
The most insightful time you'll spend today!
Azimut Group operates an international network of companies handling investment and asset management, mutual funds, hedge funds, and insurance. Founded in Milan, Italy in 1988, Azimut Group today has branches in fifteen countries, including Brazil, China, and the USA.
“We have subsidiaries and manage funds all over the world,” explains Simone Bertolotti, IT Manager at Azimut Holding S.p.a. “That means that any technology that we put in place has to cover needs from many different countries.”
“When complicated analysis has to be executed, we have to increase our table space in a couple of minutes so that the AI can drill down into the data and deliver the information we need.”
—Simone Bertolotti, IT Manager, Azimut Holding S.p.a.
Azimut manages its funds with investment advisors who use information sourced from Bloomberg, Reuters and others. “They use a huge amount of data,” says Simone. “They work with spreadsheets, algorithms, formulae and they analyse data in minutes.” In finance, every second is crucial, which is why Azimut decided to develop a risk management dashboard that can process information even more quickly, then distribute it worldwide.
“When an advisor manages data, that data is used to make immediate decisions on funds, capital movements or whether to sell stock,” says Simone. “They have to be ready to make recommendations for any amount of data that comes to them. For our dashboard, that means that when additional information arrives or complicated analysis has to be executed, we have to increase our table space in a couple of minutes so that the AI can drill down into the data and deliver the information we need.”
Generating insights at speed
Investors and investment managers make decisions based on the most accurate, up-to-date information possible. For Azimut Group, information sourced through financial data vendors such as Bloomberg and Reuters provided only part of the data that the group required.
“We looked to collect information from a range of different providers,” explains Simone, “then analyse it to develop a predictive algorithm that could work faster than an advisor stationed at the terminal. We set ourselves the challenge to try to manipulate that data to add new insights into our matrix, so that every one of our branches across the world can see risk information about the funds in real-time.”
“We compared Google Cloud Platform’s performance with our previous cloud provider, and saw huge benefits of switching to Google. For me, the key performance issue is scaling. With Google Cloud Platform I know that I can increase and decrease my infrastructure quickly, when I need it.
—Simone Bertolotti, IT Manager, Azimut Holding S.p.a.
The first cloud provider Azimut used to build its system struggled to scale quickly to meet different kinds of data challenges. “If we wanted to add more cores, that was fine,” says Simone. “But the previous cloud provider made it complicated to raise the amount of space in a database infrastructure and scale up to demand. Scaling up for more in-depth analysis would take a day, and our need was immediate.”
That’s why Azimut switched one year ago to Google Cloud Platform to run the 150 VMs on its risk analysis platform. “We compared Google Cloud Platform’s performance with our previous cloud provider, and saw huge benefits of switching to Google. For me, the key performance issue is scaling,” says Simone. “With Google Cloud Platform I know that I can increase and decrease my infrastructure quickly, when I need it. Instead of waiting a day to scale up infrastructure, we can request and add space to our database in a couple of minutes.”
The infrastructure of Azimut’s solution handles around 800TB of data per month, and Google’s global network of servers and high-speed connections ensure that it gets to where it’s most needed by the most direct route. Impressed by the speed, security and availability of Google Cloud Platform, Azimut has moved its intranet on to Google Cloud Platform, too, eliminating the need for staff to login with VPNs.
“Instead of waiting a day to scale up infrastructure, we can request and add space to our database in a couple of minutes.”
—Simone Bertolotti, IT Manager, Azimut Holding S.p.a.
Driving ahead with Noovle
For Azimut, migrating the risk management dashboard is the latest of many Google product collaborations with cloud consultancy Noovle. “Everything started five years ago,” says Simone, “when Noovle assisted us in migrating to Gmail from our on-premise email solution. From G Suite to Google Cloud Platform, we’ve had a great relationship. Noovle provides consultancy services, support for mobility, and external advisors who work on our premises, such as when they trained us how to broadcast our meetings on Google Hangouts. As an independent company, we know we can trust them for transparent advice. All they care about is the best way to get a job done and to help us reach our goals.”
New app, new customers
In a business case comparison, Google Cloud Platform cost Azimut 35% less to run than the previous cloud provider. Now the group is building a major new mobile application on Google App Engine to be released in 2018.
“The new mobile application will allow customers to trade directly, without human advisors, by proposing different investment solutions depending on targets the customers set,” says Simone. “So if a customer aims to make money with investments, they enter their relevant personal information and we carry out the necessary regulatory checks and suggest what they could buy. The entire project will be based on Google Cloud Platform, so customers can control their investments through the app while we manage the fund, using Google Cloud Spanner on the backend.”
Recommendations for Modelling SAP Data inside BigQuery

8407
Of your peers have already read this article.
4:00 Minutes
The most insightful time you'll spend today!
Over the past few years, many organizations have experienced the benefits of migrating their SAP solutions to Google Cloud. But this migration can do more than reduce IT maintenance costs and make data more secure. By leveraging BigQuery, SAP customers can complement their SAP investments and gain fresh insights by consolidating enterprise data and easily extending it with powerful datasets and machine learning from Google.
BigQuery is a leading cloud data warehouse, fully managed and serverless, and allows for massive scale, supporting petabyte-scale queries at super-fast speeds. It can easily combine SAP data with additional data sources, such as Google Analytics or Salesforce, and its built-in machine learning lets users operationalize machine learning models using standard SQL — all at a comparatively low cost.
If your SAP-powered organization is looking to supercharge its analytics with the strength of BigQuery, read on for considerations and recommendations for modeling with SAP data. These guidelines are based on our real-world implementation experience with customers and can serve as a roadmap to the analytics capabilities your business needs.
Considerations for data replication
Like most technology journeys, this one should start with a business objective. Keeping your intended business value and goals in mind is critical to making the right decisions in the early steps of the design process.
When it comes to replicating the data from an SAP system into BigQuery, there are multiple ways to do it successfully. Decide which method will work best for your organization by answering these questions:
- Does your business need real-time data? Will you need to time travel into past data?
- Which external datasets will you need to join with the replicated data?
- Are the source structures or business logic likely to change? Will you be migrating the SAP source systems any time soon? For instance, will you be moving from SAP ECC to SAP S/4HANA?
You’ll also need to determine whether replication should be done on a table-by-table basis or whether your team can source from pre-built logic. This decision, along with other considerations such as licensing, will influence which replication tool you should use.
Replicating on a table-by-table basis
Replicating tables, especially standard tables in their raw form, allows sources to be reused and ensures more stability of the source structure and functional output. For example, the SAP table for sales order headers (VBAK) is very unlikely to change its structure across different versions of SAP, and the logic that writes to it is also unlikely to change in a way that affects a replicated table.
Something else to consider: Reconciliation between the source system and the landing table in BigQuery is linear when comparing raw tables, which helps avoid issues in consolidation exercises during critical business processes, such as period-end closing. Since replicated tables aren’t aggregated or subject to process-specific data transformation, the same replicated columns can be reused in different BigQuery views. You can, for instance, replicate the MARA table (the material master) once and use it in as many models as needed.
Replicating pre-built logic
If you replicate pre-built models, such as those from SAP extractors or CDS views, you don’t need to build the logic in BigQuery, since you’re using existing logic. Some of these extraction objects have embedded delta mechanisms, which may complement a replication tool that can’t handle deltas. This will save initial development time, but it can also lead to challenges if you create new columns, or if customizations or upgrades change the logic behind the extraction.
It’s also important to note that different extraction processes may transform and load the same source columns multiple times, which creates redundancy in BigQuery and can lead to higher maintenance needs and costs. However, replicating pre-built models may still be a good choice, since doing so can be especially useful for logic that tends to be immutable, such as flattening a hierarchy, or logic that is highly complex.
How you approach replication will also depend on your long-term plans and other key factors — for example, the availability (and curiosity) of your developers, and the time or effort they can put into applying their SQL knowledge to a new data warehouse.
With either replication approach, bear in mind when designing your replication process that BigQuery is meant to be an append-always database — so post-processing of data and changes will be required in both cases.
Processing data changes
The replication tool you choose will also determine how data changes are captured (known as CDC – change data capture). If the replication tool allows for it (for example as SAP SLT does) the same patterns described in the CDC with BigQuery documentation also apply to SAP data.
Because some data, like transactions, are known to be less static than others (e.g., master data), you need to decide what should be scanned in real time, what will require immediate consistency, and what can be processed in batches to manage costs. This decision will be based on the reporting needs from the business.
Consider the SAP table BUT000, containing our example master data for business partners, where we have replicated changes from an SAP ERP system:
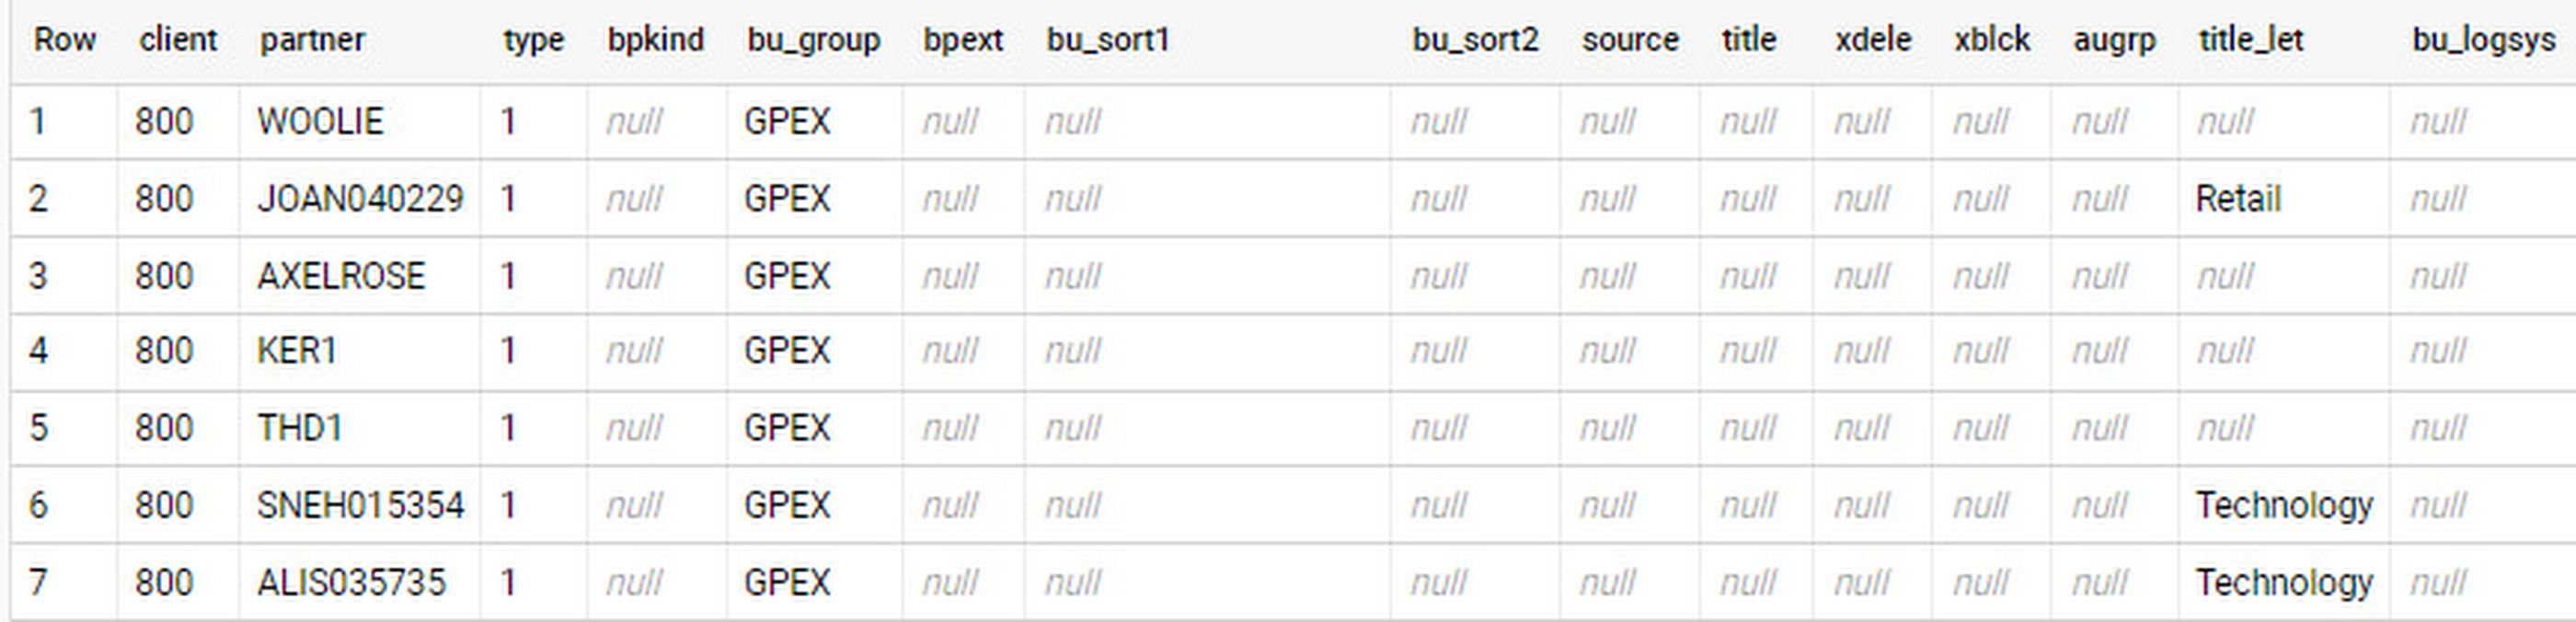
In an append-always replication in BigQuery, all updates are received as new records. For example, deleting a record in the source will be represented as a new record in BigQuery with a deletion flag. This applies to whether the records are coming from raw tables like BUT000 itself or pre-aggregated data, as from a BW extractor or a CDS view.
Let’s take a closer look at data coming particularly from the partners “LUCIA” and “RIZ”. The operation flag tells us whether the new record in BigQuery is an insert (I), update (U) or deletion (D), while the timestamps help us identify the latest version of our business partner.
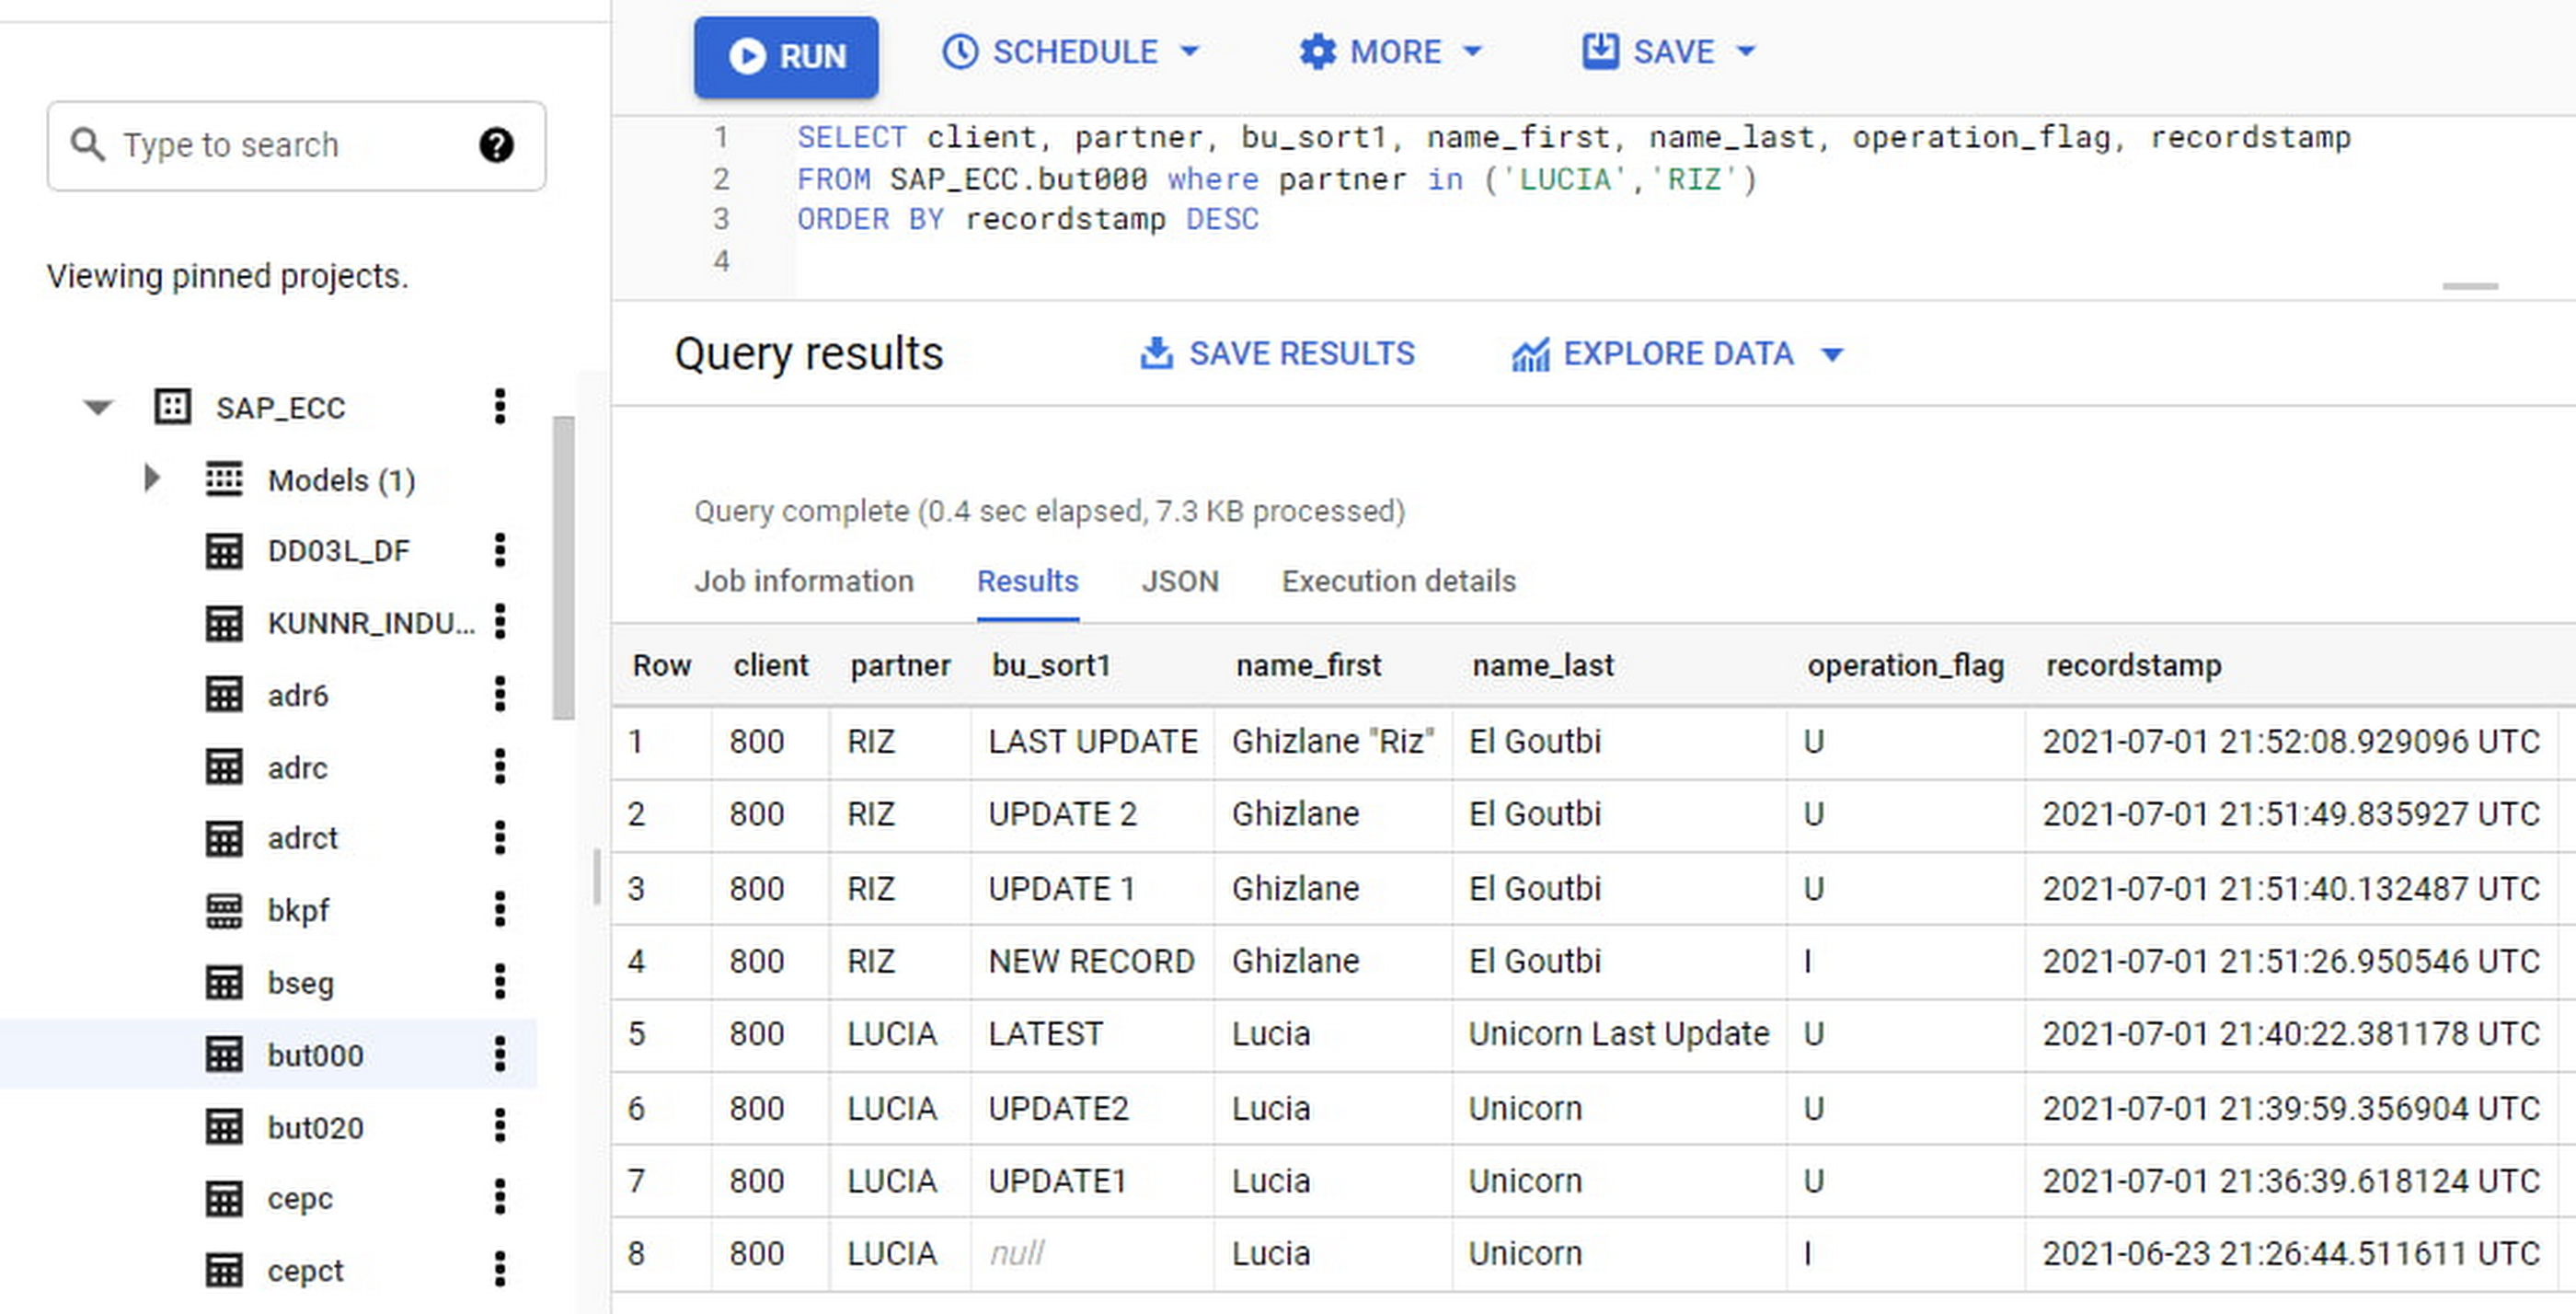
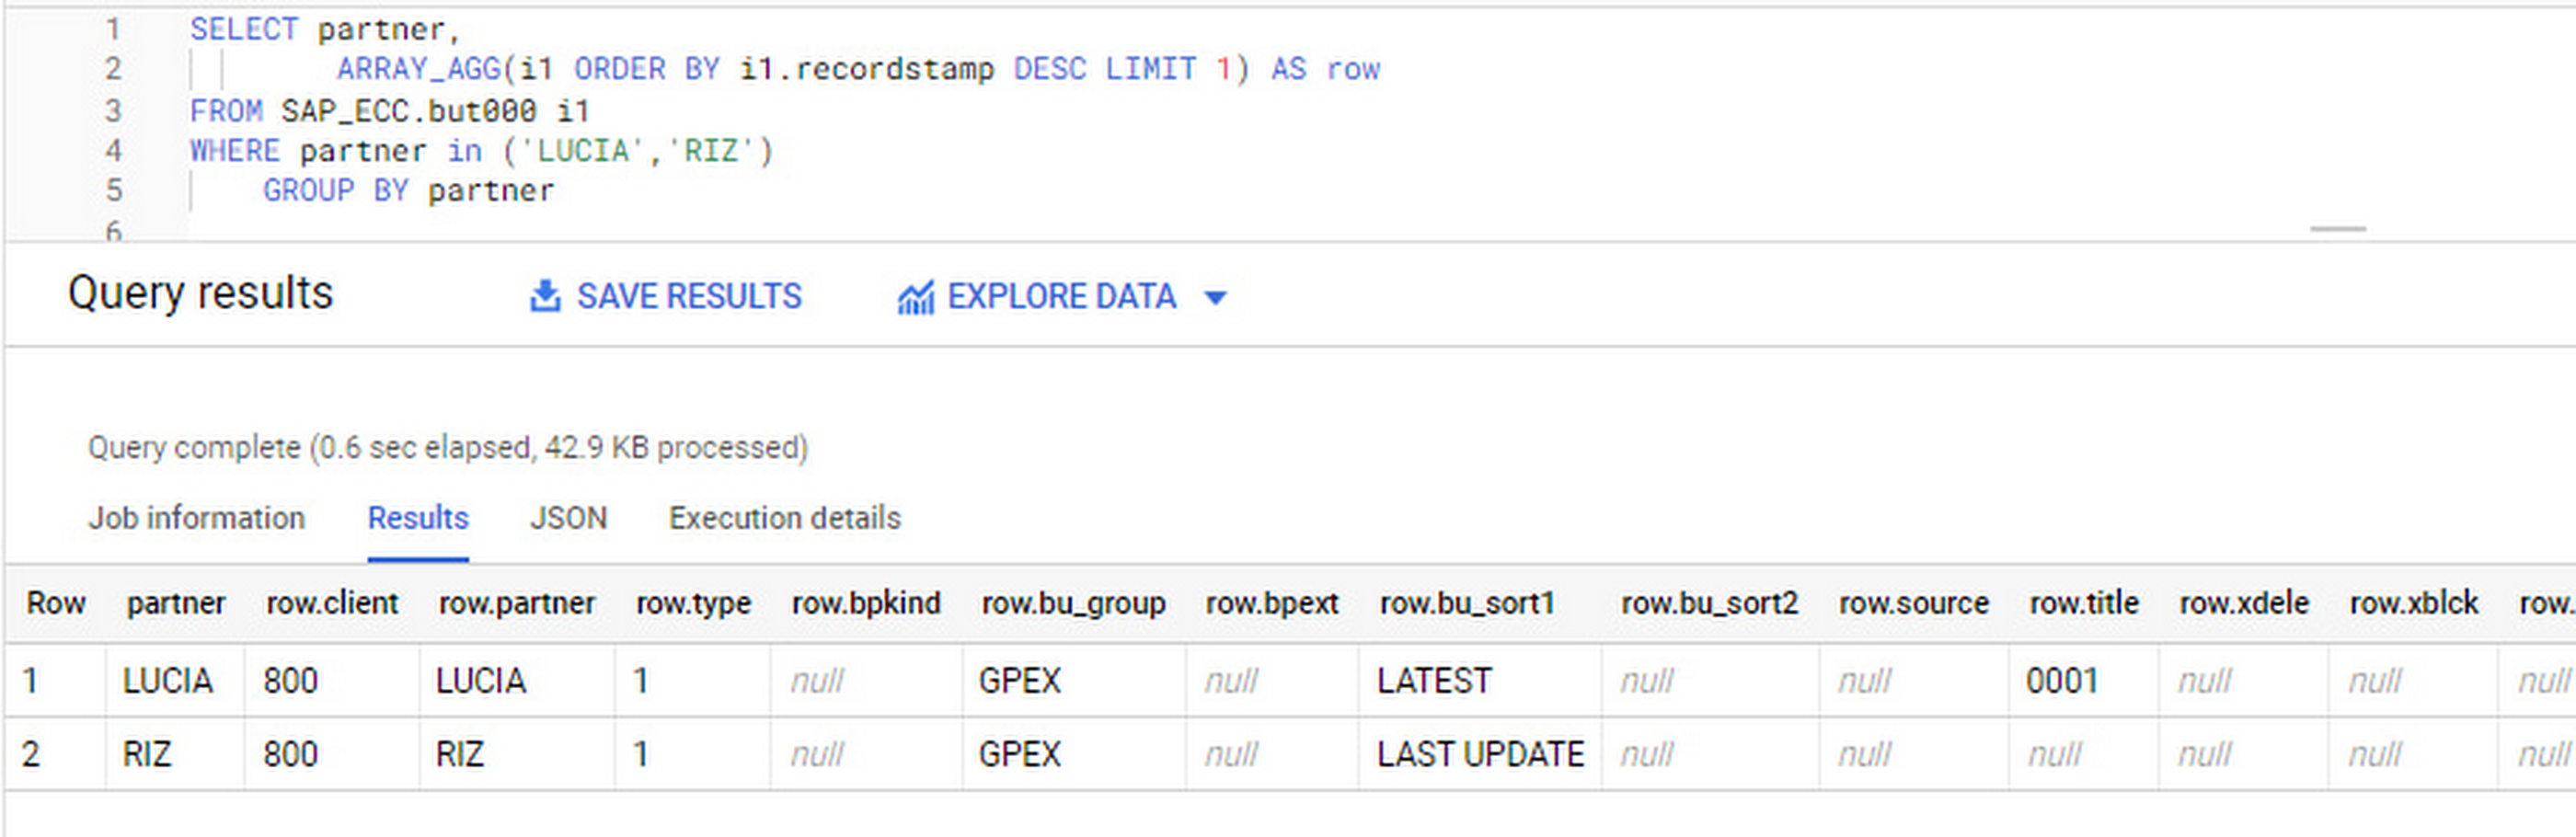
If we want to find the latest updated record for the partners LUCIA and RIZ, this is what the query would look like:
SELECT partner,ARRAY_AGG(i1 ORDER BY i1.recordstamp DESC LIMIT 1) AS rowFROM SAP_ECC.but000 i1WHERE partner in ('LUCIA','RIZ')GROUP BY partner
With the following result:
After identifying stale records for “LUCIA” and “RIZ” business partners, we can proceed to deleting all stale records for “LUCIA” if we do not want to retain the history. In this example, we are using a different table to which the same replication has been done, for the purpose of comparison and to check that all stale records have been deleted for the selection made and that we only kept last updated records. For example:
DELETE SAP_HANA.but000 i1WHEREi1.recordstamp < TIMESTAMP_SUB(CURRENT_TIMESTAMP(), INTERVAL 3 HOUR) ANDi1.recordstamp < (SELECT MAX(recordstamp) FROM SAP_HANA.but000 i2WHEREi1.partner = i2.partnerand partner="LUCIA")
You can also use the following query to retrieve stale records for “LUCIA” partner before moving forward with deletion
SELECT partner, operation_flag, recordstamp FROM SAP_HANA.but000 i1WHEREi1.recordstamp < TIMESTAMP_SUB(CURRENT_TIMESTAMP(), INTERVAL 3 HOUR)ANDi1.recordstamp < (SELECT MAX(recordstamp) FROM SAP_HANA.but000 i2WHEREi1.partner = i2.partnerand partner="LUCIA")
Which produces all of the records, except the latest update:

Partitioning and clustering
To limit the number of records scanned in a query, save on cost and achieve the best performance possible, you’ll need to take two important steps: determine partitions and create clusters.
Partitioning
A partitioned table is one that’s divided into segments, called partitions, which make it easier to manage and query your data. Dividing a large table into smaller partitions improves query performance and controls costs because it reduces the number of bytes read by a query.
You can partition BigQuery tables by:
- Time-unit column: Tables are partitioned based on a “timestamp,” “date,” or “datetime” column in the table.
- Ingestion time: Tables are partitioned based on the timestamp recorded when BigQuery ingested the data.
- Integer range: Tables are partitioned based on an integer column.
Partitions are enabled when the table is created, as in the example below. A great tip is to always include the partition filter as shown on the left-hand side of the query.

Clustering
Clustering can be created on top of partitioned tables by applying the fields that are likely to be used for filtering. When you create a clustered table in BigQuery, the table data is automatically organized based on the contents of one or more of the columns in the table’s schema. The columns you specify are then used to colocate related data.
Clustering can improve the performance of certain query types — for example, queries that use filter clauses or that aggregate data. It makes a lot of sense to use them for large tables such as ACDOCA, the table for accounting documents in SAP S/4HANA. In this case, the timestamp could be used for partitioning, and common filtering fields such as the ledger, company code, and fiscal year could be used to define the clusters.
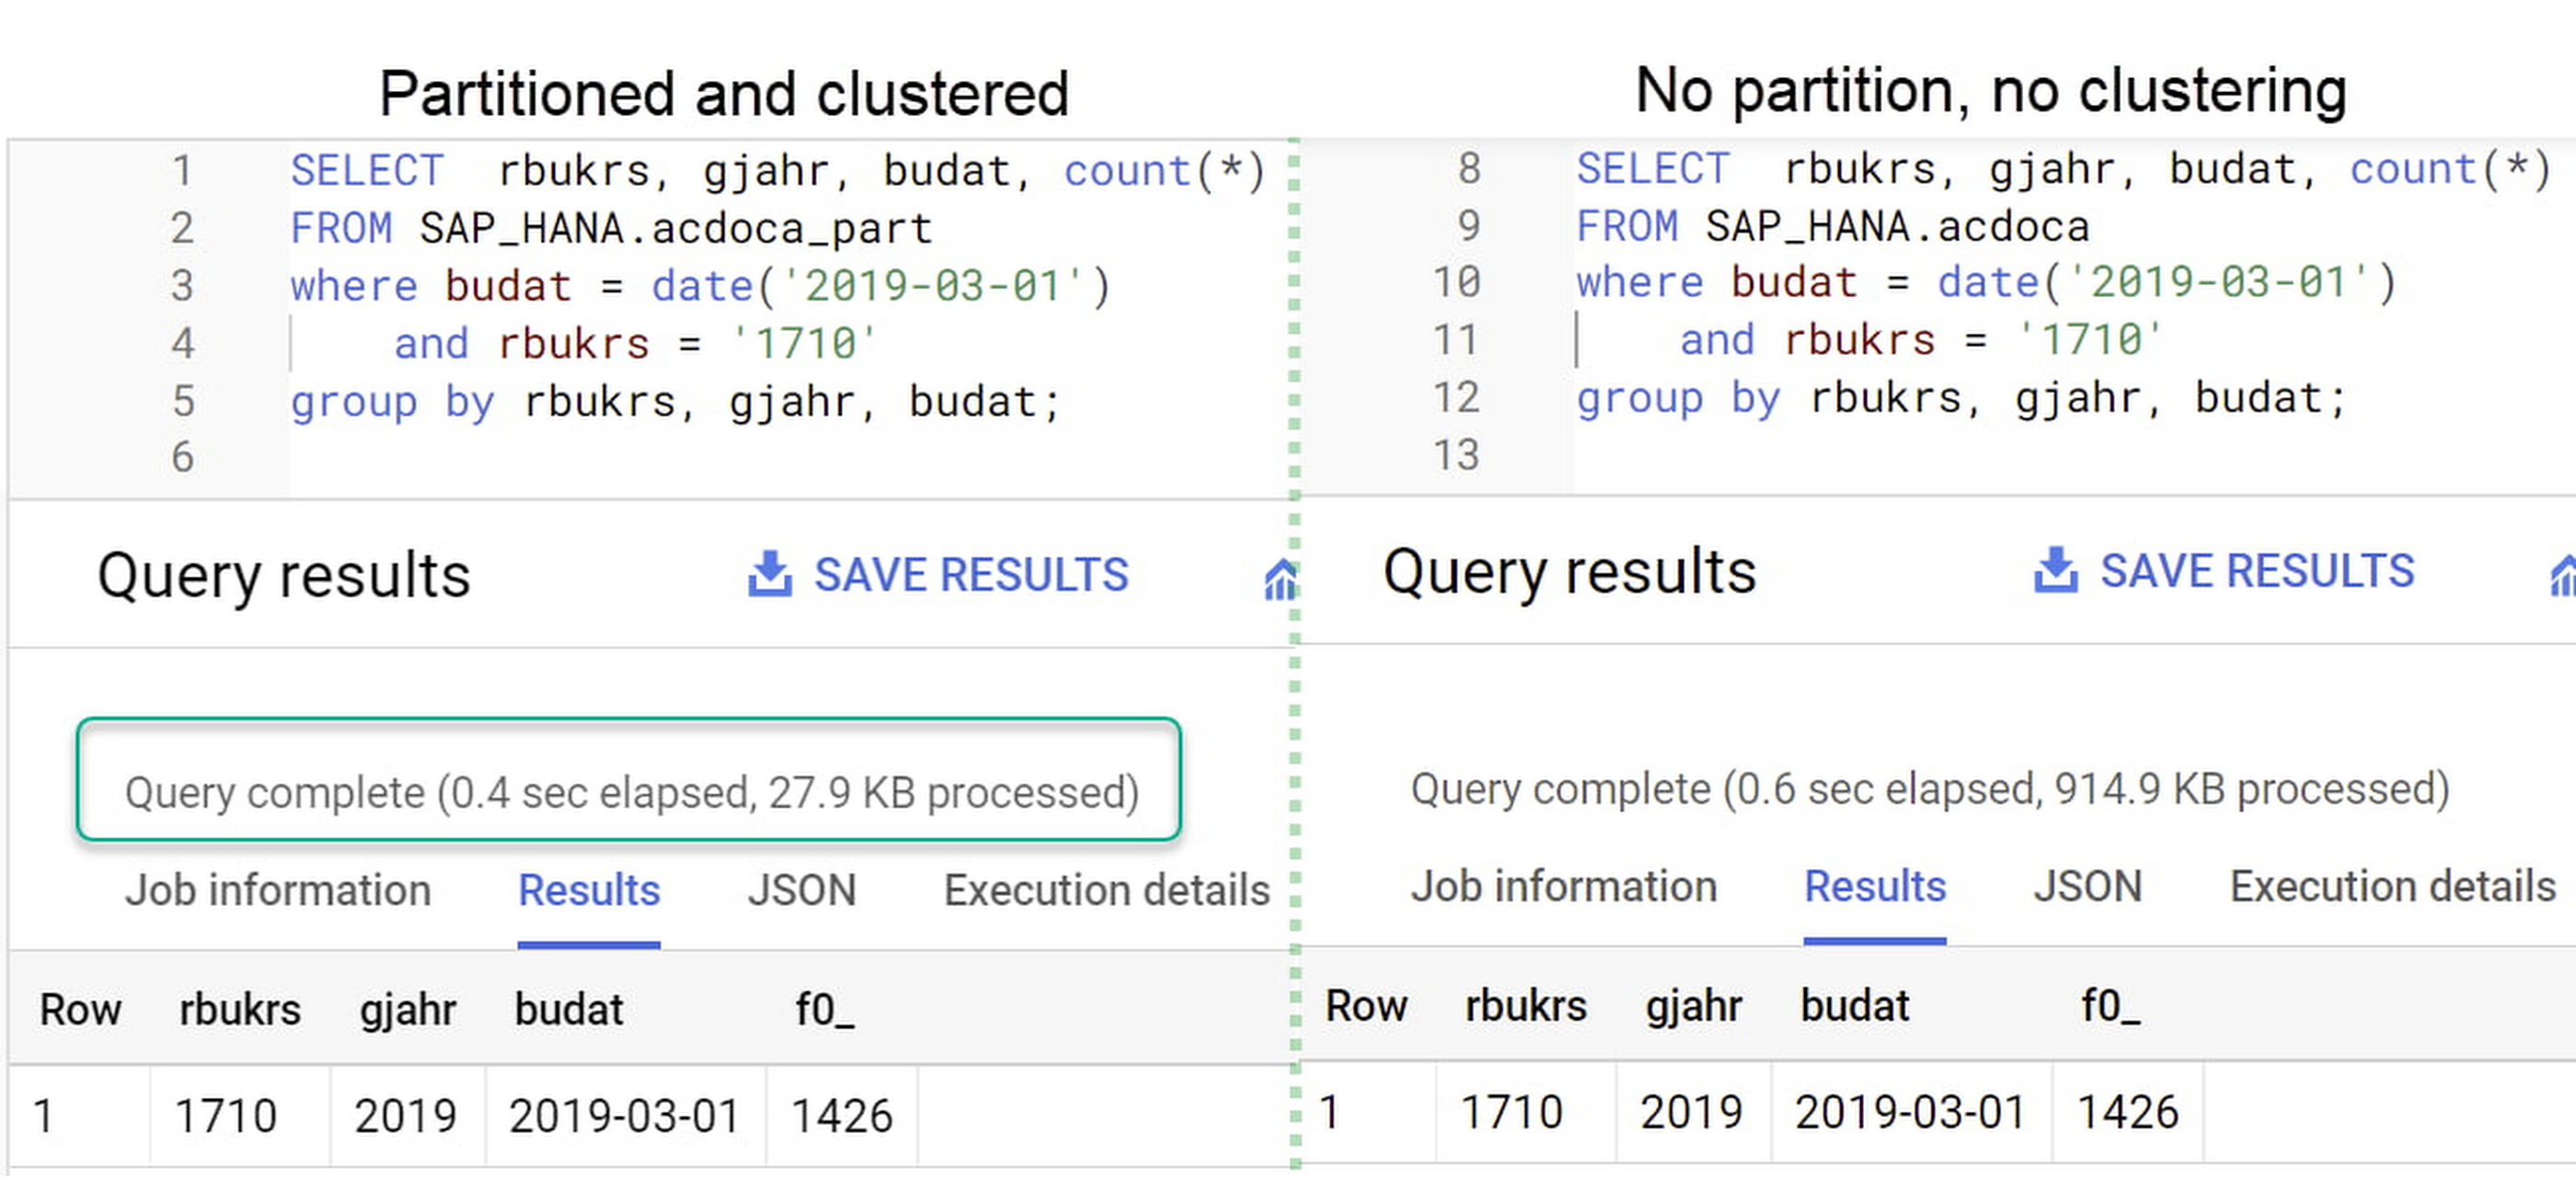
A great feature is that BigQuery will also periodically recluster the data automatically.
Materialized views
In BigQuery, materialized views are precomputed views that periodically cache the results of a query for better performance and efficiency. BigQuery uses precomputed results from materialized views and, whenever possible, reads only the delta changes from the base table to compute up-to-date results quickly. Materialized views can be queried directly or can be used by the BigQuery optimizer to process queries to the base table.
Queries that use materialized views are generally completed faster and consume fewer resources than queries that retrieve the same data only from the base table. If workload performance is an issue, materialized views can significantly improve the performance of workloads that have common and repeated queries. While materialized views currently only support single tables, they are very useful common and frequent aggregations like stock levels or order fulfillment.
Further tips on performance optimization while creating select statements can be found in the documentation for optimizing query computation.
Deployment pipeline and security
For most of the work you’ll do in BigQuery, you’ll normally have at least two delivery pipelines running — one for the actual objects in BigQuery and the other to keep the data staging, transforming, and updated as intended within the change-data-capture flows. Note that you can use most existing tools for your Continuous Integration / Continuous Deployment (CI/CD) pipeline — one of the benefits of using an open system like BigQuery. But, if your organization is new to CI/CD pipelines, this is a great opportunity to gradually gain experience. A good place to start is to read our guide for setting up a CI/CD pipeline for your data-processing workflow.
When it comes to access and security, most end-users will only have access to the final version of the BigQuery views. While row and column-level security can be applied, as in the SAP source system, separation of concerns can be taken to the next level by splitting your data across different Google Cloud projects and BigQuery datasets. While it’s easy to replicate data and structures across your datasets, it’s a good idea to define the requirements and naming conventions early in the design process so you set it up properly from the start.
Start driving faster and more insightful analytics
The best piece of advice we can give you is this: Try it yourself. Anyone with SQL knowledge can get started using the free BigQuery tier. New customers get $300 in free credits to spend on Google Cloud during the first 90 days. All customers get 10 GB storage and up to 1 TB queries/month, completely free of charge. In addition to discovering the massive processing capabilities, embedded machine learning, multiple integration tools, and cost benefits, you’ll soon discover how BigQuery can simplify your analytics tasks.
If you need additional assistance, our Google Cloud Professional Services Organization (PSO) and Customer Engineers will be happy to help show you the best path forward for your organization. For anything else, contact us at cloud.google.com/contact.
New to Cloud Firestore? Here are Some Basics You Need to Know

3546
Of your peers have already read this article.
5:00 Minutes
The most insightful time you'll spend today!
Learning to use a new database can be daunting, even more so if you don’t already have technical knowledge about databases. In this article, I will break down some database basics, terms you should know, what Firestore is, how it works, how it stores data, and how to get started using it with the assumption that you don’t have any existing database knowledge.
Before we dive into what Cloud Firestore is, let’s discuss some key database terms you should know. Feel free to skip this section if you are already familiar with the basics of Relational and non-relational databases.
What is a database?
A database is software that allows you to easily access, manage, modify, update, control and organize data. The way you want to store information can impact what type of database you choose. There are two major categories of databases, Relational and non-relational.
Relational Database
A relational database can be thought of like a spreadsheet. You can store information in your spreadsheet like this:
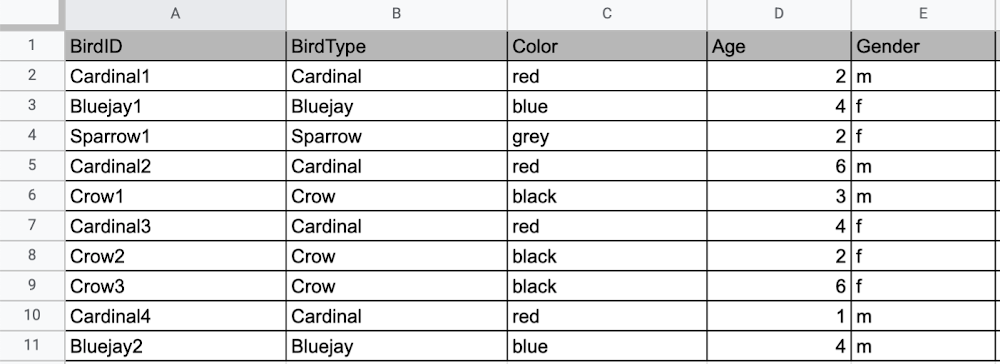
Now, what happens if I want to store information about where Sparrow1 lives, in my spreadsheet, but I don’t care about where the other birds live? I would have to add another column to my spreadsheet, called home, that would only contain data for the sparrow. That would look like this:
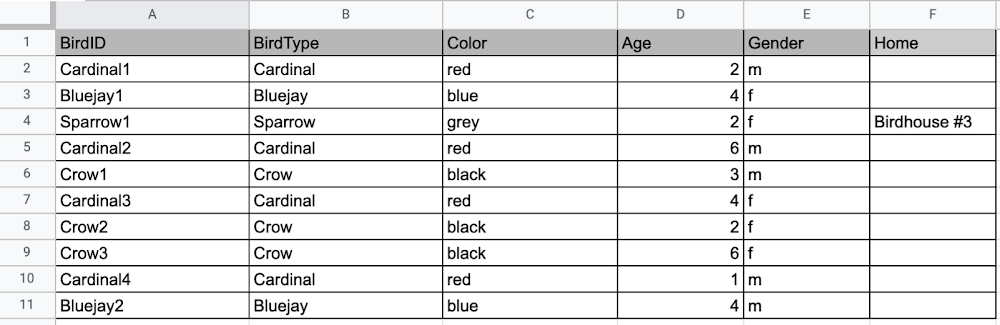
Even though I only want to know information about where the sparrow lives, I am required to have blank spaces in the column for all of the other animals. This is because in a relational database, you have a specific structure of your data called a schema. Just like in a spreadsheet, every item you are storing information on must have a place to put information about the bird’s home, even if you only want that information for one bird. This is enforced by the schema, which is essentially the column headers you put in the sheet and dictates a strict structure for the data, which has pros and cons.
The strict structure of a relational database allows your application to know what kind of data exists, to know what the data type is, and to enforce rules such as requiring data to be unique, or enforcing type of data stored etc. A schema, by design, forces the data in each row to have the same characteristics, which means it is not very flexible, unless you change the schema for the database. That means if you want to add different data that doesn’t fit your existing schema, you have to change the schema. As we discussed above, if you want to change the schema we are using to store information, such as Home, there is some information that will be stored for all rows, even if you don’t want to store anything. The amount of wasted storage is different between database engines, data types etc. Another thing to consider about Relational databases is that at scale, some traditional Relational databases will require more advanced deployments to handle the scale.
Changing the schema of a relational database can be highly disruptive, especially for busy workloads because it requires running scripts to change the schema and coordinating it carefully with the code changes in the app. Due to locking, you might even experience downtime in some cases. Now contrast that with a non-relational document database like Firestore, where you don’t have to worry about schema changes in the databases or downtime as a result of it.
Also, when you have a lot of data that you want to collect and it only applies to a few things in your database, having extra space with no information in it can become wasteful because it uses up storage space in many cases. A non-relational database can help get around this problem.
Non-relational databases
Generally speaking, a non-relational database stores information in a different format than a Relational database. There are 4 major categories of non-relational databases that you will hear most frequently.
- Column-Family
- Document (Firestore)
- Key-Value
- Graph
Since this post is focusing on Firestore, in this section we will dive into what a document database is, how it is used, and when to use it.
Document database (Firestore)
A document database can be thought of as a multi layered collection of entities, such as this:
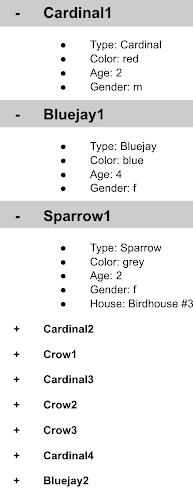
As you can see, when the list is all collapsed, you can only see the information at the top; in this case, that is the BirdID (Cardinal1, Bluejay1, Sparrow1, Cardinal2, Crow1 etc. When I open the list I see “word: word”. For example, the document ID Sparrow1, points to a document with “Type: Sparrow”. I also see “Color: grey”, “Age: 2”, “Gender: f” and “Home: Birdhouse #3”
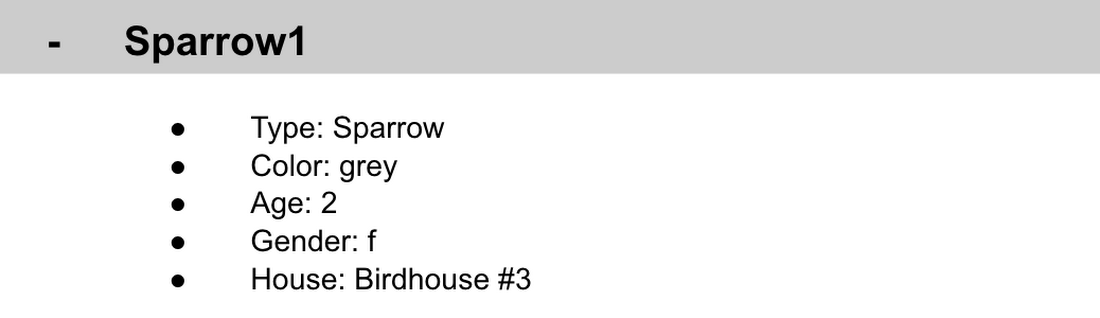
This is known as a key value pair. For “Type: Sparrow”, Type is the key and Sparrow is the value. All of the keys in the Sparrow1 document are: Type, Color, Age, Gender, House. All of the values in the Sparrow1 document are: Sparrow, grey, 2, f, Birdhouse #3.
Similarly to how the key gives you context, it allows you to ask the computer for a specific piece of information, such as the age of the bird. It is important to decide on a specific key term you will use for each piece of data you collect so your data can be easily read programmatically. This is called an implicit schema, an implied understanding of how data is stored that is not enforced by the database. Let’s go over what happens when we use an implicit schema.
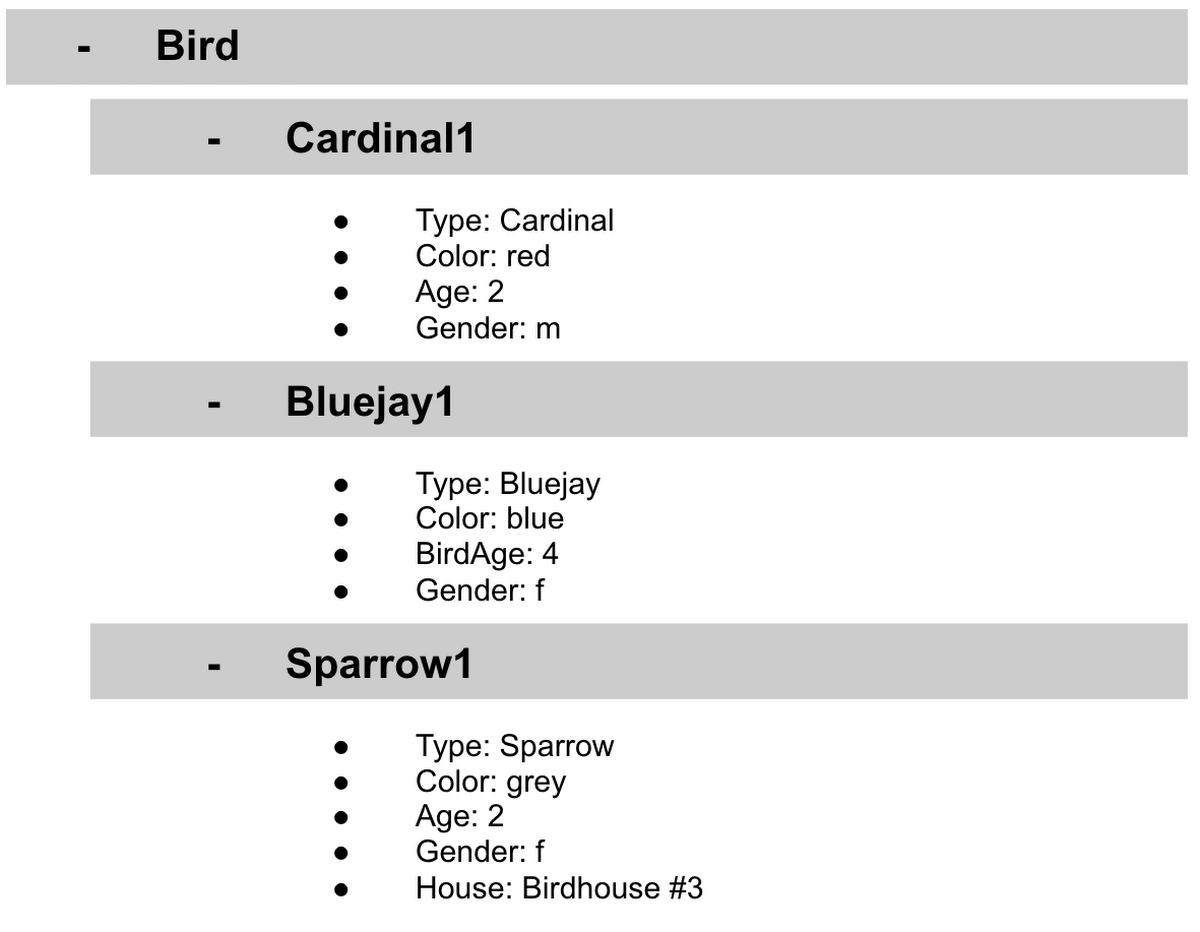
Under Cardinal1, you see Type, Color, Age, and Gender; however, under Sparrow1 you also see House. This is possible because in a non-relational database you don’t have a schema that requires you to store the same information about every bird in your database; instead, you can store the specific information that you need for each bird, regardless of what is stored for other birds. This is a great benefit in terms of flexibility, but because of this flexibility, maintaining standard naming conventions is very important.
Now, let’s discuss why using standard naming conventions is so important. In the example above, if I ask a human: “What is the age of Cardinal1?”, they would probably tell me 2. If I asked them: “What is the Age of Bluejay1?”, they would probably tell me 4. These are both correct answers, but they are only correct because a human is able to assume what Age means. A computer, on the other hand, can’t make assumptions. If I ask a computer: “What is the Age of Cardinal1?” it would say 2, but if I ask it: “What is the Age of Bluejay1?” it would not know. This is because the computer is looking for the keyword Age and it isn’t able to use any context clues to determine what other words might mean Age. However, if I asked the computer: “What is the BirdAge of Bluejay1?”, the computer would tell me 4. Why do I care that I need to tell the computer to look for BirdAge to get the age of blujay one, but to look for Age to get the age of Cardinal one? I care because it means I would have to write two entirely different sets of instructions (i.e software code) to get the age of Cardinal1 and the age of Bluejay1 if I am not careful in how I structure my data. But when I structure my data well, this is not an issue and is infact a benefit by adding added flexibility.
What we see from this example, is that even without a strict schema, we can (and should) define conventions for document formats. If conventions aren’t defined, things can get unwieldy quickly.
How information is accessed
Now, let’s discuss how the information is accessed. If I wanted to know information about which birds are blue in our drop down list example, I would need to expand every section of the list to check if the bird is blue or not. As you can imagine, once you start to get a lot of birds in your database, it becomes cumbersome to open every drop down and see if the bird is blue. Luckily, Firestore lets you run these types of queries against the data (See more here) and receive all the documents that satisfy your conditions. On the other hand, if I wanted to know all of the information about Cardinal1, I could just open the drop down for Cardinal1 and I would have all of the information about that bird.
Now let’s start using some Firestore specific terminology. For the example we just discussed:Collections
- In Firestore, your data lives in collections. You can think of collections as tabs in a spreadsheet.
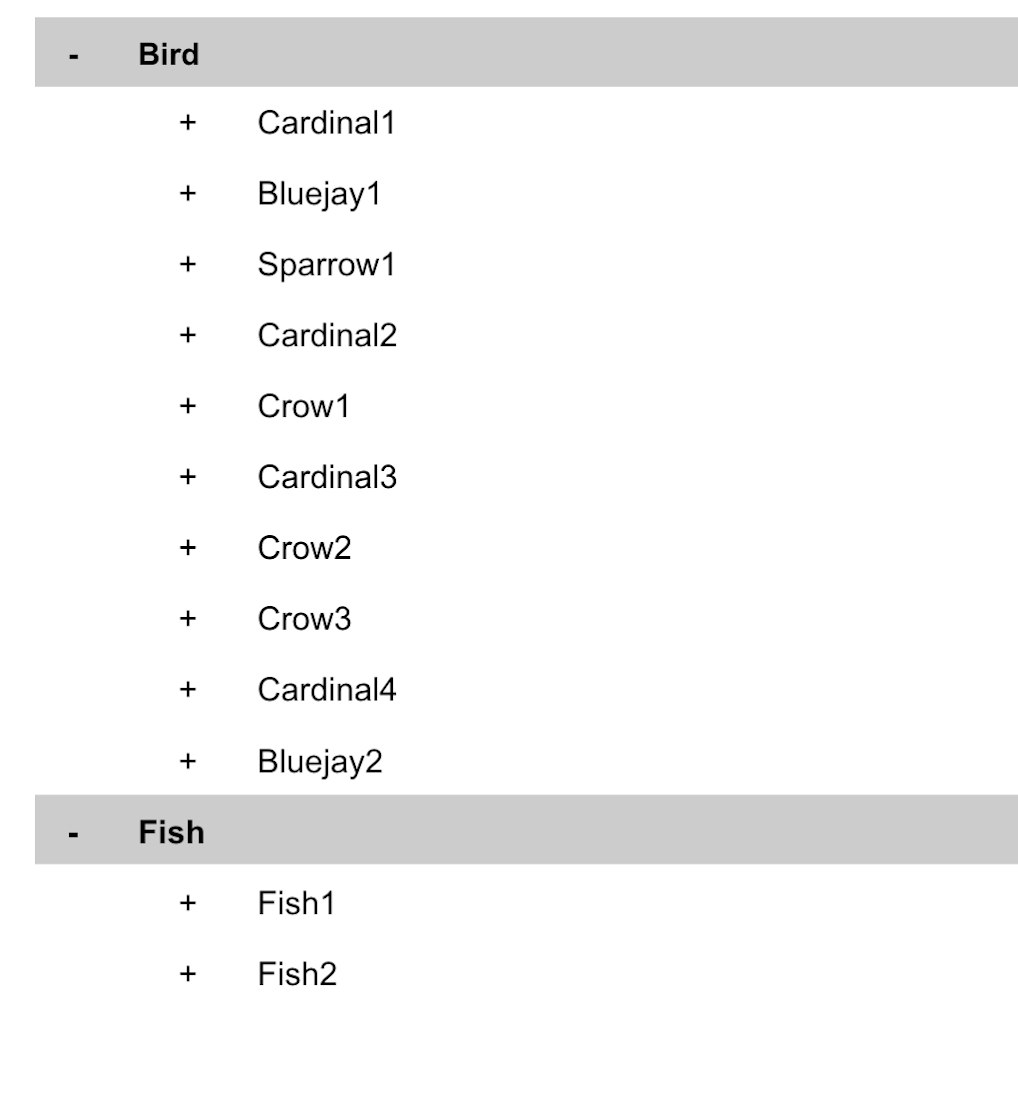
- Collections can be used to organize data. For example, if I decide that I want to collect data about birds and fish, the data about birds could be put in a birds collection, and the data about fish could be put in a Fish collection. ex:
- This is the unit of storage that Firestore uses. In our example, each bird is its own document. Documents reside in collections. This is what one document would contain:
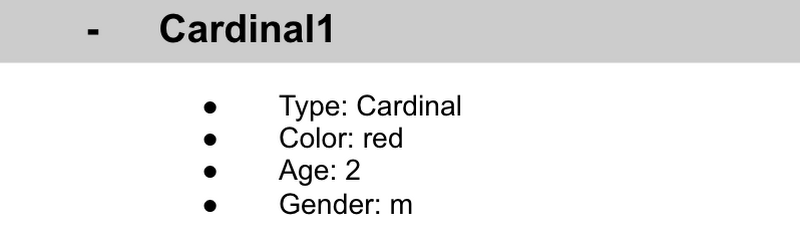
- Each Document corresponds to a row in the sheet. The following diagram demonstrates that each column header maps to a property name in the document and that each value in a row maps to a value in the document.
- Each document must be identified by a unique identifier. In our example, that is BirdID. Notice that the value for BirdID is stored at the top level of the list, so when the document is closed, you can only see Cardinal1 and Cardinal1 is not also stored within the document.
- All documents can be uniquely identified by their location. Let’s think through this in words first before we move to code. If I want to tell someone to get data about the sparrow from the drop down lists, I would need to tell them:
- In the bird drop down list, can you please get all the information under Sparrow1 and put it on a piece of paper called sparrow1Info?
- Now let’s try that again using Firestore terms.
- From the birds collection, can you please get the document for sparrow1 from the Firestore database (db) and save it as sparrow1Info?
- Now let’s try it in code.
- var sparrow1Info = db.collection(‘birds’).doc(‘sparrow1’);
- A subcollection is a collection associated with a document. Using our example of the drop down list, we can add a collection called sightings that stores documents about each sighting of the specific bird. This is what that would look like:
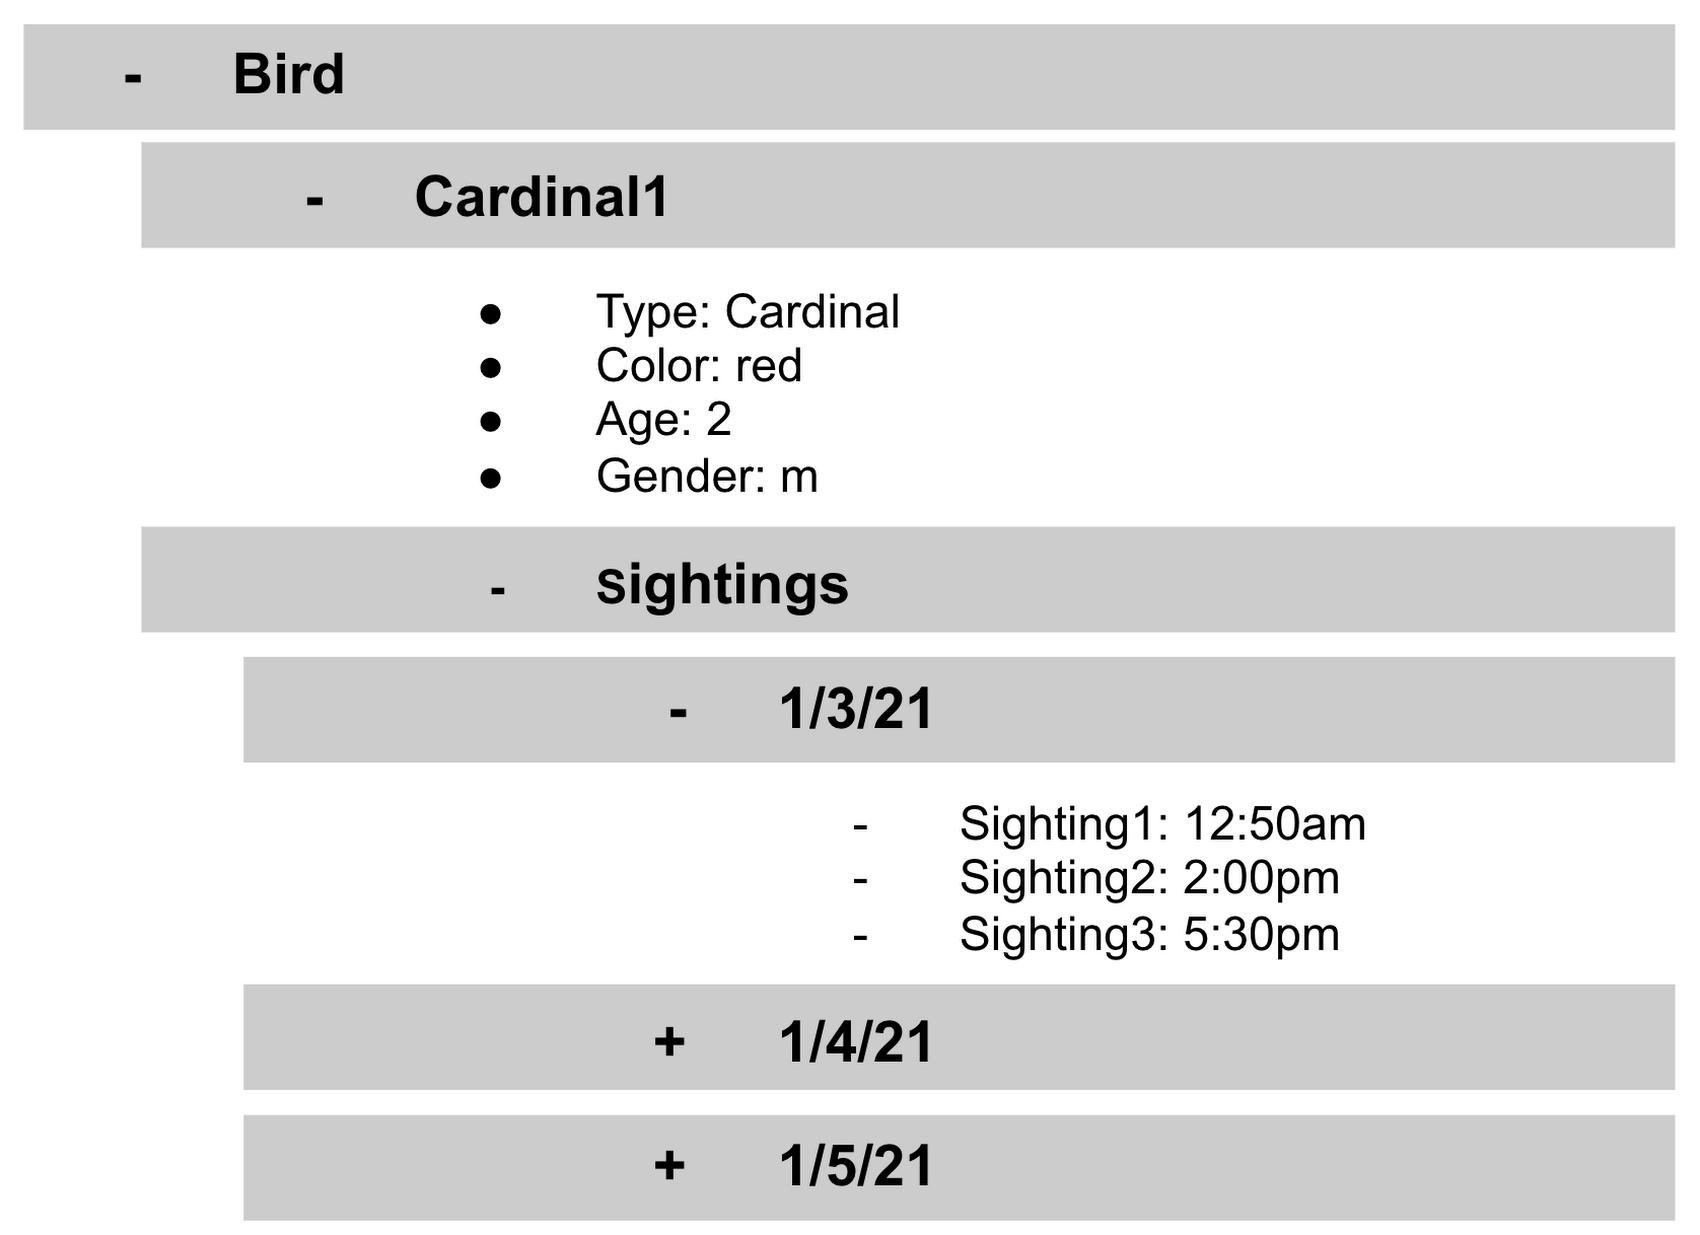
- It is important to note that you don’t need to have the same subcollections on all documents. For example, Cardinal1 can be the only document that has a subcollection of Sightings.
How to search on Google about Firestore
The hardest part of learning a new technology can often be knowing the right terms to put into Google search to get the answers you are looking for. Here are some key terms that can help you get started
Your question:
How should I arrange my data to store it in Firestore?
Search:
Document database implicit schema design
Your Question:
What other databases are similar to firestore?
Search:
What are some document databases
Your Question:
How do I get all documents in the Birds collection?
Search:
How to use wildcards in Firestore
What next?
Try this guide to get started building your first application that uses firestore: https://firebase.google.com/docs/firestore/quickstart
Google and AI Researchers Work towards Building Data-centric AI

6076
Of your peers have already read this article.
1:30 Minutes
The most insightful time you'll spend today!
AI researchers and engineers need better data to enable better AI solutions. The quality of an AI solution is determined by both the learning algorithm (such as a deep-neural network model) and the datasets used to train and evaluate that algorithm. Historically, AI research has focused much more on algorithms than datasets, despite their vital importance. As a result, many algorithms are freely available as starting points, but many important problems lack large, high-quality open datasets. Further, creating new datasets is expensive and error-prone.
Recently, the data-centric AI movement has emerged, which aims to develop new methodologies and tools for constructing better datasets to fix this problem. Conferences, workshops, challenges, and platforms are being launched to support improving data quality and to foster data excellence. Thought leaders such as Andrew Ng at Landing.AI and Chris Re at Stanford University are encouraging AI developers to focus more on iterative data engineering than they do tuning their learning algorithms. Our CHI-best-paper-award-winning paper, “Everyone wants to do the model work, not the data work” highlighted the significance of data quality in the practice of ML.
At Google, we are excited to contribute to data-centric AI. Today, Google Cloud is adding a new high value dataset to the Public Dataset Program, and Google researchers are announcing DataPerf, a new multi-organizational effort to develop benchmarks for data quality and data centric algorithms.
Google Cloud is committed to helping users improve their data quality, starting with supporting better public data. The Public Datasets program provides high quality datasets pre-configured on GCP for easy access. Google Cloud is adding a new high-value dataset developed by the MLCommons™ Association (which Google co-founded) to the Public Datasets program: The Multilingual Spoken Words Corpus: a rich audio speech dataset with more than 340,000 keywords in 50 languages with upwards of 23.4 million examples.
This new public dataset is aligned with the MLCommons Association vision for “open” datasets – accessible by all – that are “living” – continually being improved to raise quality and increase representation and diversity.
Google researchers, in collaboration with multiple organizations, are announcing the DataPerf effort at the NeurIPS Data-Centric AI workshop today, to develop benchmarks to improve data quality. Much like the the MLPerf™ benchmarking effort which is now the industry standard for machine learning hardware/software speed, DataPerf brings together the originators of prior efforts including: CATS4ML, Data-Centric AI Competition, DCBench, Dynabench, and the MLPerf benchmarks to define clear metrics that catalyze rapid innovation. DataPerf will measure the utility of training and test data for common problems, and algorithms for working with datasets such as: selecting core sets, correcting errors, identifying under-optimized data slices, and valuing datasets prior to labeling.
Together, supporting open, living datasets for core ML tasks, and the development of benchmarks to direct the rapid evolution of those datasets will empower the researchers and engineers who use Google Cloud to do even more amazing things – and we can’t wait to see what they create!
Acknowledgements: In collaboration with Lora Aroyo and Praveen Paritosh.
BigQuery ML for Sentiment Analysis: How to Make the Most of Your Data

1806
Of your peers have already read this article.
4:30 Minutes
The most insightful time you'll spend today!
Introduction
We recently announced BigQuery support for sparse features which help users to store and process the sparse features efficiently while working with them. That functionality enables users to represent sparse tensors and train machine learning models directly in the BigQuery environment. Being able to represent sparse tensors is a useful feature because sparse tensors are used extensively in encoding schemes like TF-IDF as part of data pre-processing in NLP applications and for pre-processing images with a lot of dark pixels in computer vision applications.
There are numerous applications of sparse features such as text generation and sentiment analysis. In this blog, we’ll demonstrate how to perform sentiment analysis with the space features in BigQuery ML by training and inferencing machine learning models using a public dataset. This blog also highlights how easy it is to work with unstructured text data on BigQuery, an environment traditionally used for structured data.
Using sample IMDb dataset
Let’s say you want to conduct a sentiment analysis on movie reviews from the IMDb website. For the benefit of readers who want to follow along, we will be using the IMDb reviews dataset from BigQuery public datasets. Let’s look at the top 2 rows of the dataset.
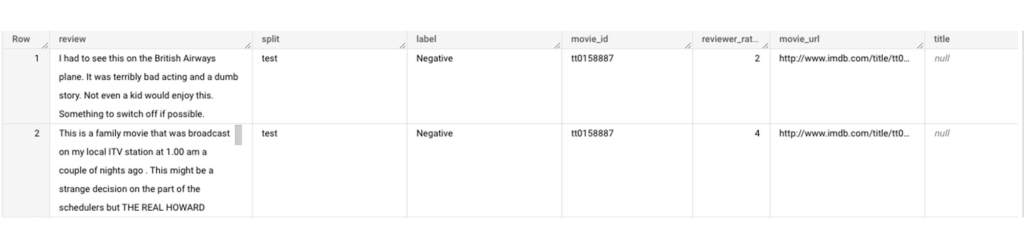
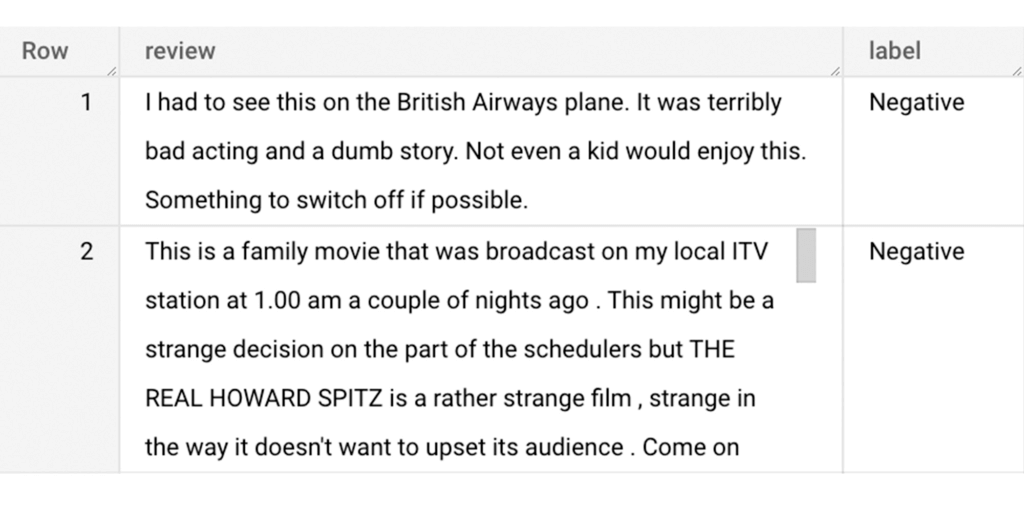
Although the reviews table has 7 columns, we only use reviews and label columns to perform sentiment analysis for this case. Also, we are only considering negative and positive values in the label columns. The following query can be used to select only the required information from the dataset.
SELECT
 review,
 label,
FROM
 `bigquery-public-data.imdb.reviews`
WHERE
 label IN ('Negative', 'Positive')
The top 2 rows of the result is as follows:
Methodology
Based on the dataset that we have, the following steps will be carried out:
- Build a vocabulary list using the review column
- Convert the review column into sparse tensors
- Train a classification model using the sparse tensors to predict the label (“positive” or “negative”)
- Make predictions on new test data to classify reviews as positive or negative.
Feature engineering
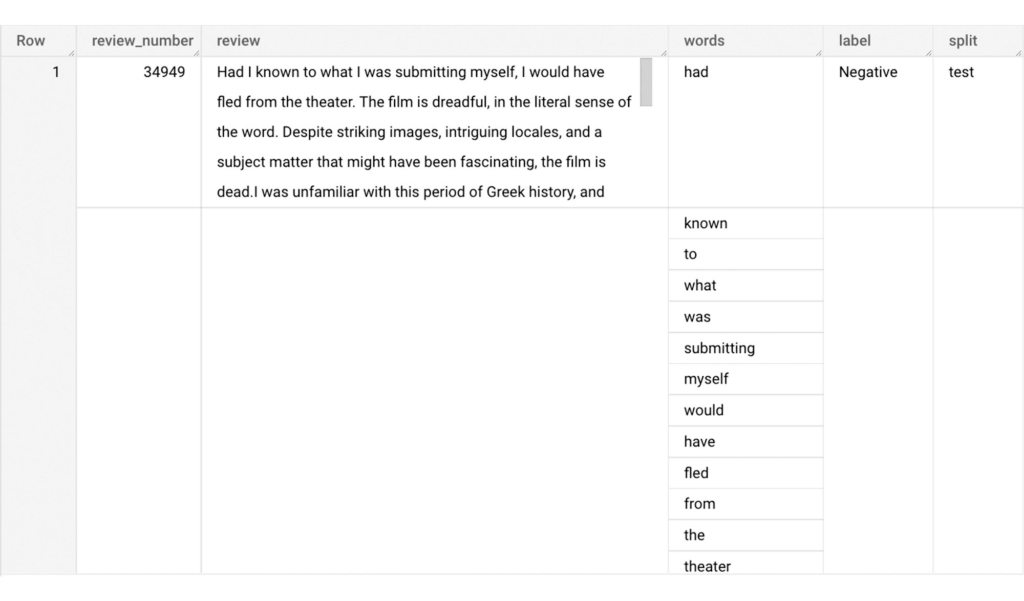
In this section, we will convert the text from the reviews column to numerical features so that we can feed them into a machine learning model. One of the ways is the bag-of-words approach where we build a vocabulary using the words from the reviews and select the most common words to build numerical features for model training. But first, we must extract the words from each review. The following code creates a dataset and a table with row numbers and extracted words from reviews.
-- Create a dataset named `sparse_features_demo` if doesn’t exist
CREATE SCHEMA IF NOT EXISTS sparse_features_demo;


-- Select unique reviews with only negative and positive labels
CREATE OR REPLACE TABLE sparse_features_demo.processed_reviews AS (
 SELECT
   ROW_NUMBER() OVER () AS review_number,
   review,
   REGEXP_EXTRACT_ALL(LOWER(review), '[a-z]{2,}') AS words,
   label,
   split
 FROM (
   SELECT
     DISTINCT review,
     label,
     split
   FROM
     `bigquery-public-data.imdb.reviews`
   WHERE
     label IN ('Negative', 'Positive')
 )
);
The output table from the query above should look like this:
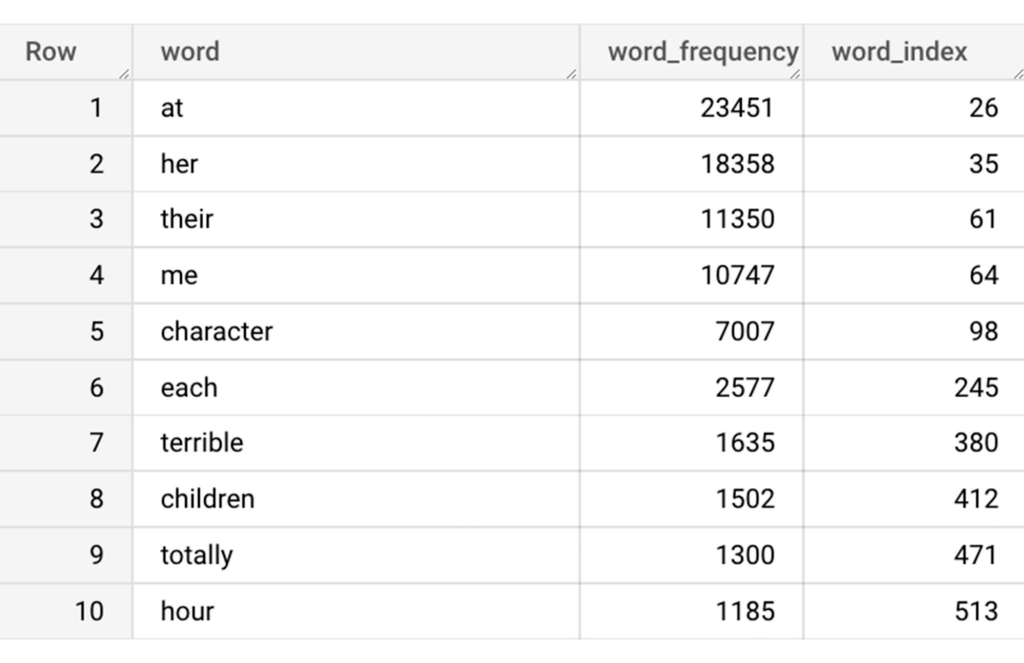
The next step is to build a vocabulary using the extracted words. The following code creates a vocabulary including word frequency and word index from reviews. For this case, we are going to select only the top 20,000 words to reduce the computation time.
-- Create a vocabulary using train dataset and select only top 20,000 words based on frequency
CREATE OR REPLACE TABLE sparse_features_demo.vocabulary AS (
 SELECT
   word,
   word_frequency,
   word_index
 FROM (
   SELECT
     word,
     word_frequency,
     ROW_NUMBER() OVER (ORDER BY word_frequency DESC) - 1 AS word_index
   FROM (
     SELECT
       word,
       COUNT(word) AS word_frequency
     FROM
       sparse_features_demo.processed_reviews,
       UNNEST(words) AS word
     WHERE
       split = "train"
     GROUP BY
       word
   )
 )
 WHERE
   word_index < 20000 # Select top 20,000 words based on word count
);
The following shows the top 10 words based on frequency and their respective index from the resulting table of the query above.
Creating a sparse feature
Now we will use the newly added feature to create a sparse feature in BigQuery. For this case, we aggregate word_index and word_frequency in each review, which generates a column as ARRAY[STRUCT] type. Now, each review is represented as ARRAY[(word_index, word_frequency)].
-- Generate a sparse feature by aggregating word_index and word_frequency in each review.
CREATE OR REPLACE TABLE sparse_features_demo.sparse_feature AS (
 SELECT
   review_number,
   review,
   ARRAY_AGG(STRUCT(word_index, word_frequency)) AS feature,
   label,
   split
 FROM (
   SELECT
     DISTINCT review_number,
     review,
     word,
     label,
     split
   FROM
     sparse_features_demo.processed_reviews,
     UNNEST(words) AS word
   WHERE
     word IN (SELECT word FROM sparse_features_demo.vocabulary)
 ) AS word_list
 LEFT JOIN
   sparse_features_demo.vocabulary AS topk_words
   ON
     word_list.word = topk_words.word
 GROUP BY
   review_number,
   review,
   label,
   split
);
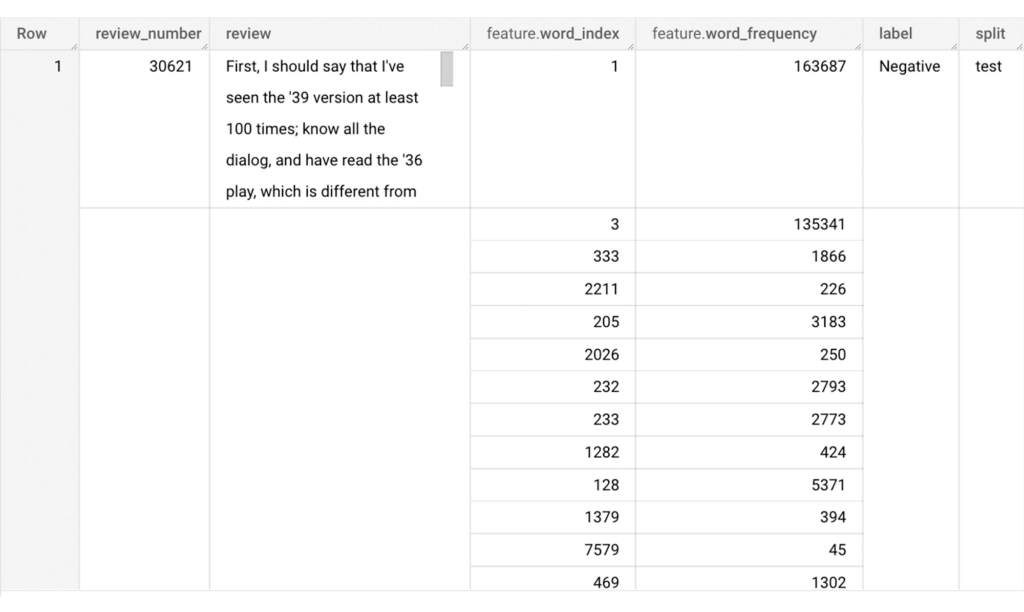
Once the query is executed, a sparse feature named `feature` will be created. That `feature` column is an `ARRAY of STRUCT` column which is made of `word_index` and `word_frequency` columns. The picture below displays the resulting table at a glance.
Training a BigQuery ML model
We just created a dataset with a sparse feature in BigQuery. Let’s see how we can use that dataset to train with a machine learning model with BigQuery ML. In the following query, we will train a logistic regression model using the review_number, review, and feature to predict the label:
-- Train a logistic regression classifier using the data with sparse feature
CREATE OR REPLACE MODEL sparse_features_demo.logistic_reg_classifier
 TRANSFORM (
   * EXCEPT (
       review_number,
       review
     )
 )
 OPTIONS(
   MODEL_TYPE='LOGISTIC_REG',
   INPUT_LABEL_COLS = ['label']
 ) AS
 SELECT
   review_number,
   review,
   feature,
   label
 FROM
    sparse_features_demo.sparse_feature
 WHERE
   split = "train"
;
Now that we have trained a BigQuery ML Model using a sparse feature, we evaluate the model and tune it as needed.
-- Evaluate the trained logistic regression classifier
SELECT * FROM ML.EVALUATE(MODEL sparse_features_demo.logistic_reg_classifier);
The score looks like a decent starting point, so let’s go ahead and test the model with the test dataset.

-- Evaluate the trained logistic regression classifier using test data
SELECT * FROM ML.EVALUATE(MODEL sparse_features_demo.logistic_reg_classifier,
 (
   SELECT
     review_number,
     review,
     feature,
     label
   FROM
     sparse_features_demo.sparse_feature
   WHERE
     split = "test"
 )
);
The model performance for the test dataset looks satisfactory and it can now be used for inference. One thing to note here is that since the model is trained on the numerical features, the model will only accept numeral features as input. Hence, the new reviews have to go through the same transformation steps before they can be used for inference. The next step shows how the transformation can be applied to a user-defined dataset.
Sentiment predictions from the BigQuery ML model
All we have left to do now is to create a user-defined dataset, apply the same transformations to the reviews, and use the user-defined sparse features to perform model inference. It can be achieved using a WITH statement as shown below.
WITH
 -- Create a user defined reviews
 user_defined_reviews AS (
   SELECT
     ROW_NUMBER() OVER () AS review_number,
     review,
     REGEXP_EXTRACT_ALL(LOWER(review), '[a-z]{2,}') AS words
   FROM (
     SELECT "What a boring movie" AS review UNION ALL
     SELECT "I don't like this movie" AS review UNION ALL
     SELECT "The best movie ever" AS review
   )
 ),


 -- Create a sparse feature from user defined reviews
 user_defined_sparse_feature AS (
   SELECT
     review_number,
     review,
     ARRAY_AGG(STRUCT(word_index, word_frequency)) AS feature
   FROM (
     SELECT
       DISTINCT review_number,
       review,
       word
     FROM
       user_defined_reviews,
       UNNEST(words) as word
     WHERE
       word IN (SELECT word FROM sparse_features_demo.vocabulary)
   ) AS word_list
   LEFT JOIN
     sparse_features_demo.vocabulary AS topk_words
     ON
       word_list.word = topk_words.word
   GROUP BY
     review_number,
     review
 )


-- Evaluate the trained model using user defined data
SELECT review, predicted_label FROM ML.PREDICT(MODEL sparse_features_demo.logistic_reg_classifier,
 (
   SELECT
     *
   FROM
     user_defined_sparse_feature
 )
);
Here is what you would get for executing the query above:
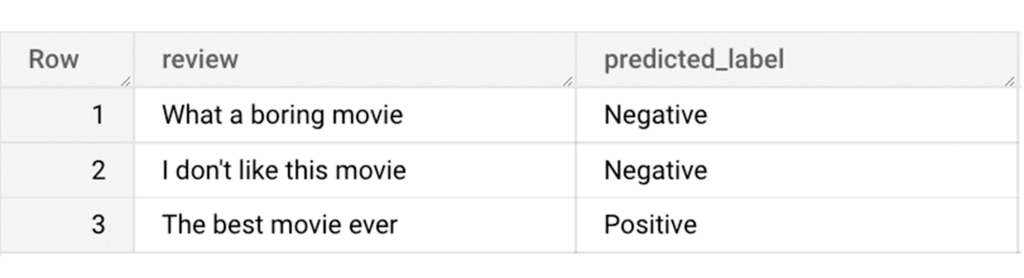
And that’s it! We just performed a sentiment analysis on the IMDb dataset from a BigQuery Public Dataset using only SQL statements and BigQuery ML. Now that we have demonstrated how sparse features can be used with BigQuery ML models, we can’t wait to see all the amazing projects that you would create by harnessing this functionality.
If you’re just getting started with BigQuery, check out our interactive tutorial to begin exploring.
Analytics Hub for Secure Data Sharing and Analytics Unlocks True Data Value and Insights

6733
Of your peers have already read this article.
2:30 Minutes
The most insightful time you'll spend today!
Customers tell us that sharing and exchanging data with other organizations is a critical element of their analytics strategy, but it’s hamstrung by unreliable data and processes, and only getting harder with security threats and privacy regulations on the rise.
Furthermore, traditional data sharing techniques use batch data pipelines that are expensive to run, create late arriving data, and can break with any changes to the source data. They also create multiple copies of data, which brings unnecessary costs and can bypass data governance processes. These techniques do not offer features for data monetization, such as managing subscriptions and entitlements. Altogether, these challenges mean that organizations are unable to realize the full potential of transforming their business with shared data.
To address these limitations, we are introducing Analytics Hub, a new fully managed service, available in Q3, in preview, that helps you unlock the value of data sharing, leading to new insights and increased business value. With Analytics Hub you get:
- A rich data ecosystem by publishing and subscribing to analytics-ready datasets.
- Control and monitoring over how your data is being used, because data is shared in one place.
- A self-service way to access valuable and trusted data assets, including data provided by Google. For example, a unique dataset from Google Search Trends will be available, that you can query and combine with your own data.
- An easy way to monetize your data assets without the overhead of building and managing the infrastructure.
Built on a decade of cross-organizational sharing
While Analytics Hub is a new service, it builds on BigQuery, Google’s petabyte-scale, serverless cloud data warehouse. BigQuery’s unique architecture provides separation between compute and storage, enabling data publishers to share data with as many subscribers as you want without having to make multiple copies of your data. With BigQuery, there are no servers to deploy or manage, which means that data consumers get immediate value from shared data. Data can be provided and consumed in real-time using the streaming capabilities of BigQuery and you can leverage the built in machine learning, geospatial, and natural language capabilities of BigQuery or take advantage of the native business intelligence support with tools like Looker, Google Sheets, and Data Studio.
BigQuery has had cross-organizational, in-place data sharing capabilities since it was introduced in 2010. We took a look at usage metrics in BigQuery and found that over a 7 day period in April, we had over 3,000 different organizations sharing over 200 petabytes of data. These numbers don’t include data sharing between departments within the same organization.
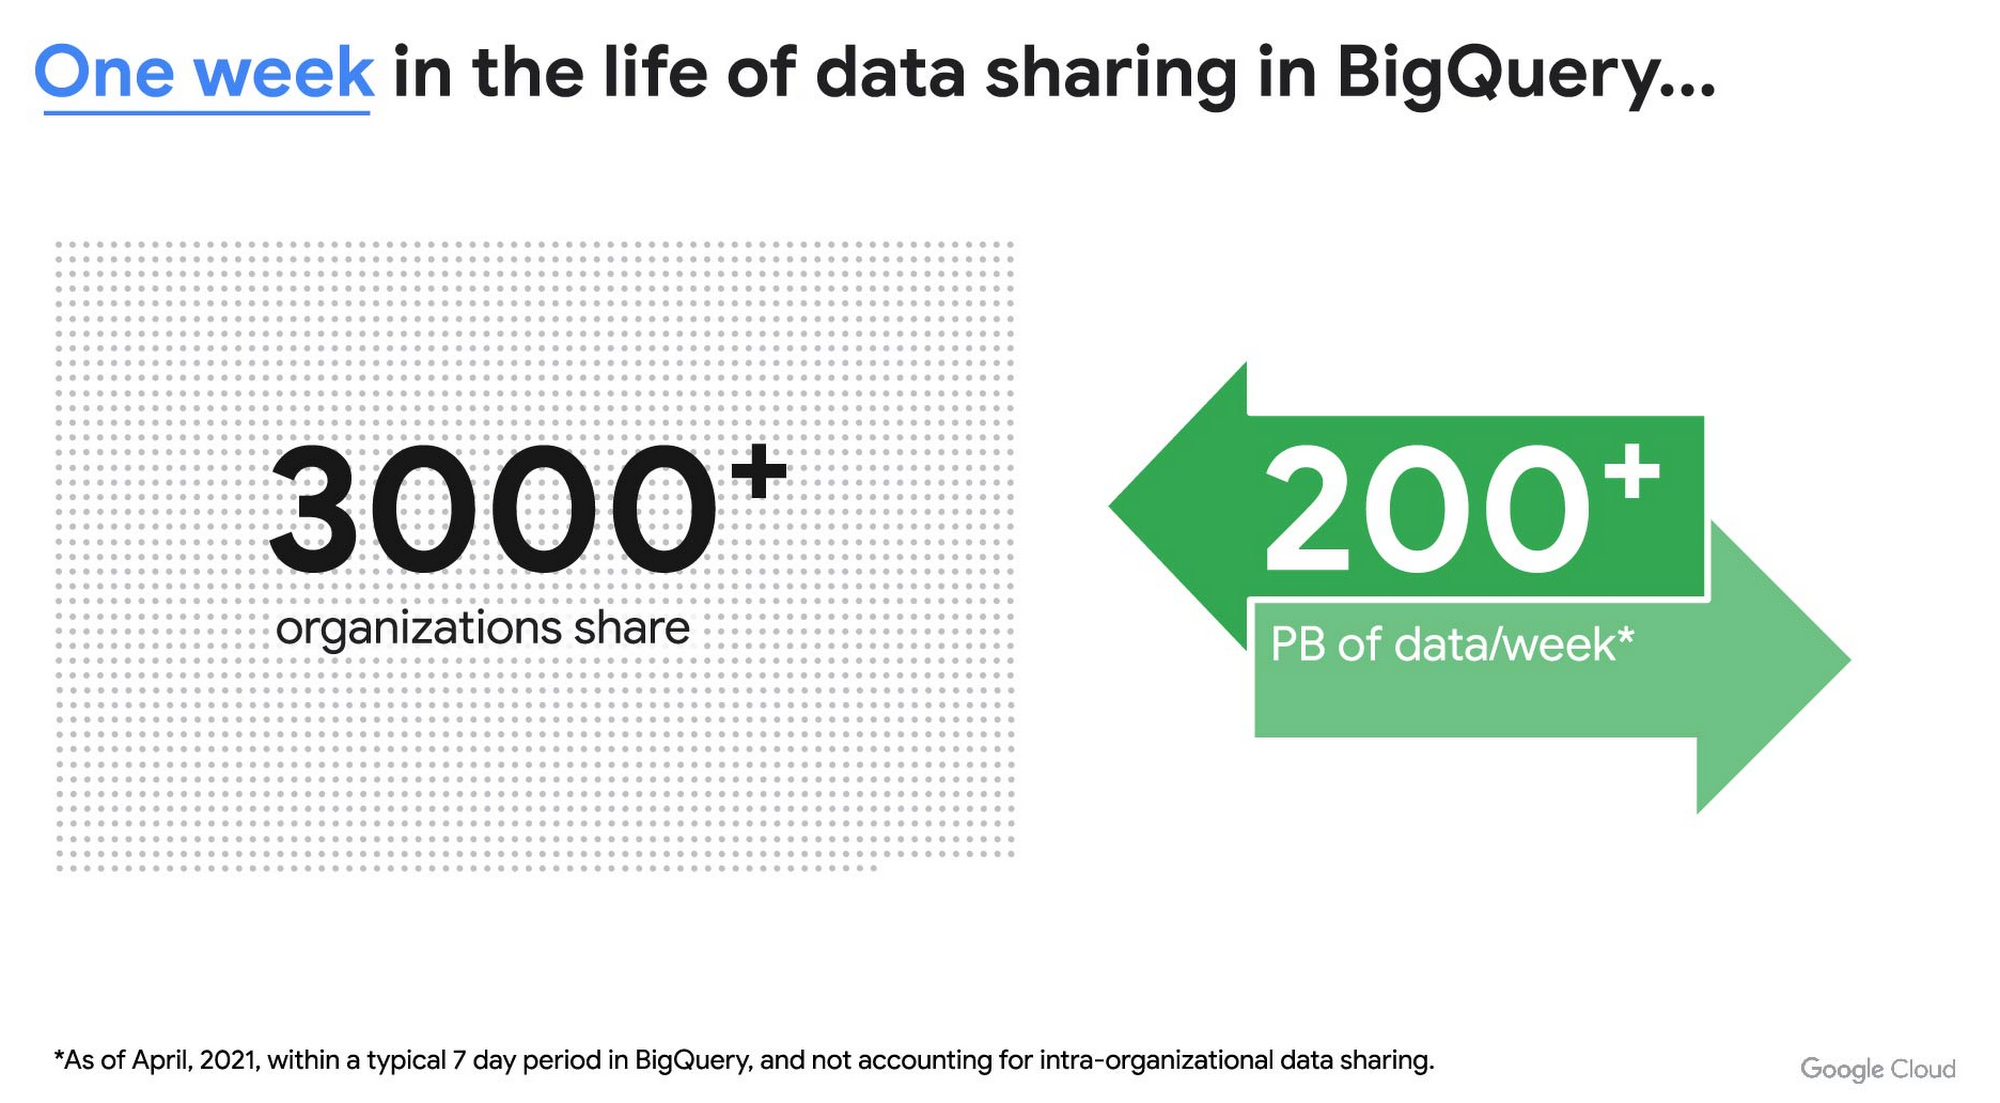
As you can see, data sharing in BigQuery is already popular. But we want to make it easier and even more scalable.
Raising the bar on data sharing
To make data sharing easier and more scalable in BigQuery, Analytics Hub introduces the concepts of shared datasets and exchanges. As a data publisher, you create shared datasets that contain the views of data that you want to deliver to your subscribers. Next, you create exchanges, which are used to organize and secure shared datasets. By default, exchanges are completely private, which means that only the users and groups that you give access to can view or subscribe to the data. You can also create internal exchanges or leverage public exchanges provided by Google. Finally, you publish shared datasets into an exchange to make them available to subscribers.
Data subscribers search through the datasets that are available across all exchanges for which they have access and subscribe to relevant datasets. This creates a linked dataset in their project that they can query and join with their own data. Subscribers pay for the queries that they run against the data while the publisher pays for the storage of the data. Data providers can add new data, new tables, or new columns to the shared dataset and these will be immediately available to subscribers. In addition, the publisher can track subscribers, disable subscriptions, and see aggregated usage information for the shared data.
Analytics Hub makes it easy for you to publish, discover, and subscribe to valuable datasets that you can combine with your own data to derive unique insights. Here are some types of data that will be available through Analytics Hub:
- Public datasets: Easy access to the existing repository of over 200 public datasets, including data about weather and climate, cryptocurrency, healthcare and life sciences, and transportation.
- Google datasets: Unique, freely-available datasets from Google. One example of this is the COVID-19 community mobility dataset. Another example is the forthcoming Google Trends dataset, which will provide the top 25 search terms and top 25 rising search terms over a 5 year window in 210 distinct locations in the US. Trends data can be used by everyone in the organization to gain insights into what customers care about.
- Commercial (paid for) datasets: We are working with leading commercial data providers to bring their data products to Analytics Hub. If you are interested in delivering your data via Analytics Hub, we’re also introducing Data Gravity, an initiative that provides storage benefits and new distribution paths for data published through Analytics Hub.
- Internal datasets: We know that data sharing can be challenging in larger organizations. Analytics Hub can be used for internal data, for example, to share standardized customer demographics with your sales engineering and data science teams.
Customers and partners using Analytics Hub

“Google Search Trends data has always been an important tool for our WPP agency data teams. At WPP we believe that data variety is a superpower which is why we are excited to use the new Trends dataset availability within BigQuery, plus the launch of Analytics Hub. The best creativity in the world is informed by data insights, and influenced by what people search for, so the operational efficiencies we’ll gain via the Analytics Hub and the insights we can drive with Trends data are just phenomenal.”
—Di Mayze Global Head of Data and AI, WPP

“Equifax Ignite is our shared data analytics environment within our Equifax data fabric. We are excited to partner with Google to leverage Analytics Hub and BigQuery to deliver data to over 400 statisticians and data modelers as well as securely sharing data with our partner financial institutions.”
—Kumar Menon, SVP Data Fabric and Decision Science, Equifax

“The flow of data and insights between our teams at Deloitte and our clients is paramount for building truly transformational data cultures. With its purpose-built architecture for secure data exchanges and sharing analytics resources, Google Cloud’s Analytics Hub can help provide significant operational efficiencies for how Deloitte teams support our clients’ data-driven initiatives within their industry ecosystems. It will also help minimize the worries about scale, privacy and security, or the administrative burden associated with each.”
—Navin Warerkar, Managing Director, Deloitte Consulting LLP, and US Google Cloud Data & Analytics GTM Lead

“Crux Informatics is proud to partner with Google to support the launch of Analytics Hub, removing friction for those who need access to analytics-ready data. With thousands of datasets from over 140 sources, Crux Informatics will accelerate access to data on Analytics Hub and together provide a more efficient and cost effective solution to deliver datasets in Google Cloud’s ecosystem.”
—Will Freiberg, CEO, Crux Informatics
Next steps for Analytics Hub
This is just the beginning for Analytics Hub. As we get to preview and general availability, we will be adding additional capabilities, including workflows for publishing and subscribing, publishing analytics assets (Looker Blocks, Data Studio reports, Connected Google Sheets) along with the shared data, the ability for data publishers to specify query restrictions on the usage of their data, and making it easy for data publishers to create sandbox environments for subscribers to work with their data, even if they are not yet on Google Cloud. We will provide features in Analytics Hub for monetization of data, including managing subscriptions, data entitlements, and billing.
Please sign up for the preview, which is scheduled to be available in the third quarter of 2021. In the meantime, you can learn more about BigQuery and how to leverage its built-in data sharing capabilities. Please go to g.co/cloud/analytics-hub to register your interest in Analytics Hub.
More Relevant Stories for Your Company

Discover Latest Resources on Google Cloud’s Datasets Solution
Editor’s note: With Google Cloud’s datasets solution, you can access an ever-expanding resource of the newest datasets to support and empower your analyses and ML models, as well as frequently updated best practices on how to get the most out of any of our datasets. We will be regularly updating this

Accelerate Innovation with Google Cloud’s Managed Database Services
Google Cloud’s managed database services can help you innovate faster and reduce operational overhead. The migration tools and resources included in this whitepaper will help you plan your migration. This whitepaper provides guidance on: Managing services for maximum compatibility with your workloads Leveraging services that are compatible with the most

Want to Code for the Cloud? Get Started with the Native App Development Track
Earlier this year, we launched the Google Cloud skills challenge, which provides 30 days of free access to training to build your cloud knowledge and an opportunity to earn skill badges that showcase your Google Cloud competencies. Today, we’re adding a Native App Development track to the skills challenge, joining the Getting Started,

Gartner Positions Google as the Leader for Cloud Database Management Systems!
We are thrilled that Gartner has positioned Google as a Leader for the second year in a row in the 2021 Gartner® Magic Quadrant™ for Cloud Database Management Systems (DBMS). We believe the report evaluated Google's unified capabilities across both transactional and analytical use cases, and showcases innovation progress in areas like
