





BigQuery ML for Sentiment Analysis: How to Make the Most of Your Data

1811
Of your peers have already read this article.
4:30 Minutes
The most insightful time you'll spend today!
Introduction
We recently announced BigQuery support for sparse features which help users to store and process the sparse features efficiently while working with them. That functionality enables users to represent sparse tensors and train machine learning models directly in the BigQuery environment. Being able to represent sparse tensors is a useful feature because sparse tensors are used extensively in encoding schemes like TF-IDF as part of data pre-processing in NLP applications and for pre-processing images with a lot of dark pixels in computer vision applications.
There are numerous applications of sparse features such as text generation and sentiment analysis. In this blog, we’ll demonstrate how to perform sentiment analysis with the space features in BigQuery ML by training and inferencing machine learning models using a public dataset. This blog also highlights how easy it is to work with unstructured text data on BigQuery, an environment traditionally used for structured data.
Using sample IMDb dataset
Let’s say you want to conduct a sentiment analysis on movie reviews from the IMDb website. For the benefit of readers who want to follow along, we will be using the IMDb reviews dataset from BigQuery public datasets. Let’s look at the top 2 rows of the dataset.
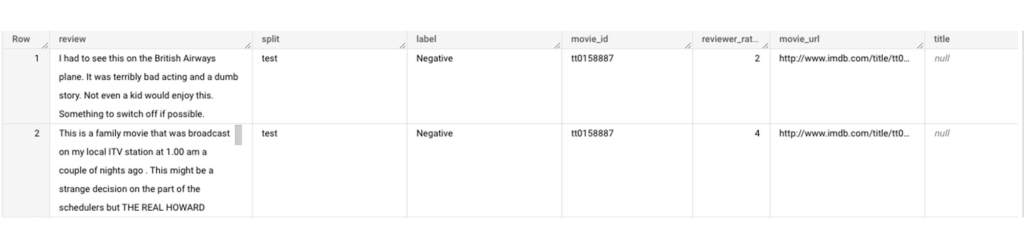
Although the reviews table has 7 columns, we only use reviews and label columns to perform sentiment analysis for this case. Also, we are only considering negative and positive values in the label columns. The following query can be used to select only the required information from the dataset.
SELECT
 review,
 label,
FROM
 `bigquery-public-data.imdb.reviews`
WHERE
 label IN ('Negative', 'Positive')
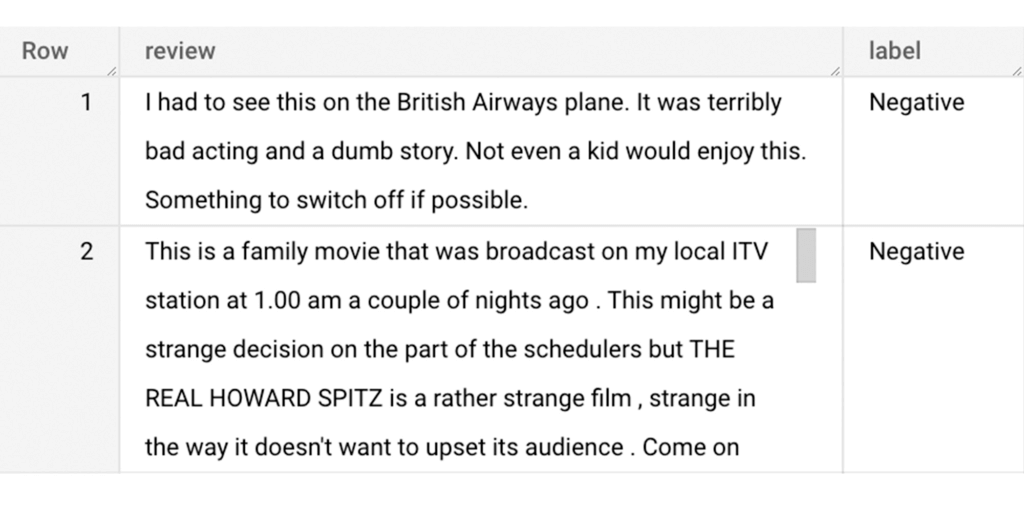
The top 2 rows of the result is as follows:
Methodology
Based on the dataset that we have, the following steps will be carried out:
- Build a vocabulary list using the review column
- Convert the review column into sparse tensors
- Train a classification model using the sparse tensors to predict the label (“positive” or “negative”)
- Make predictions on new test data to classify reviews as positive or negative.
Feature engineering
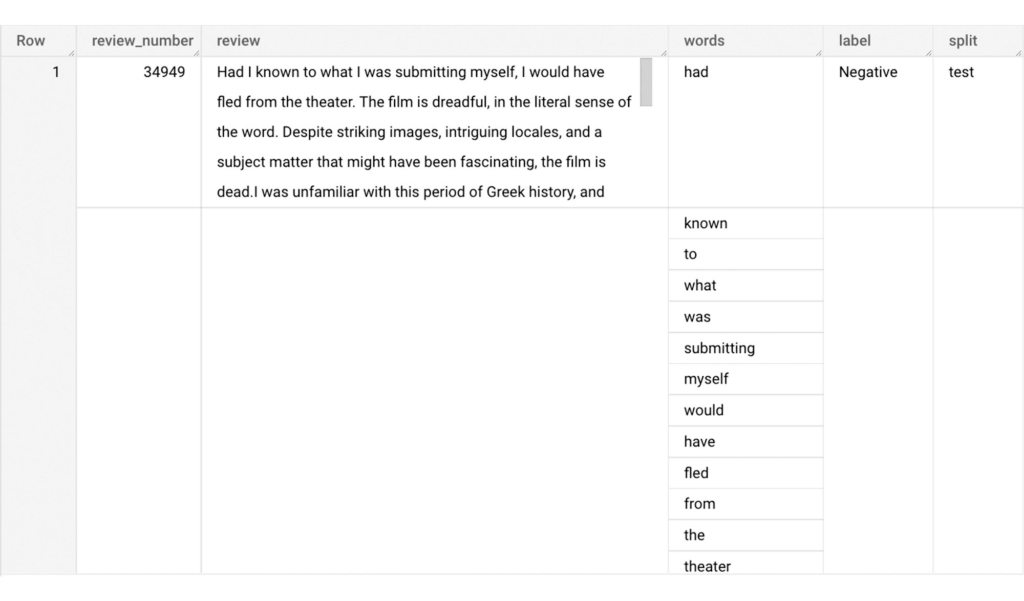
In this section, we will convert the text from the reviews column to numerical features so that we can feed them into a machine learning model. One of the ways is the bag-of-words approach where we build a vocabulary using the words from the reviews and select the most common words to build numerical features for model training. But first, we must extract the words from each review. The following code creates a dataset and a table with row numbers and extracted words from reviews.
-- Create a dataset named `sparse_features_demo` if doesn’t exist
CREATE SCHEMA IF NOT EXISTS sparse_features_demo;


-- Select unique reviews with only negative and positive labels
CREATE OR REPLACE TABLE sparse_features_demo.processed_reviews AS (
 SELECT
   ROW_NUMBER() OVER () AS review_number,
   review,
   REGEXP_EXTRACT_ALL(LOWER(review), '[a-z]{2,}') AS words,
   label,
   split
 FROM (
   SELECT
     DISTINCT review,
     label,
     split
   FROM
     `bigquery-public-data.imdb.reviews`
   WHERE
     label IN ('Negative', 'Positive')
 )
);
The output table from the query above should look like this:
The next step is to build a vocabulary using the extracted words. The following code creates a vocabulary including word frequency and word index from reviews. For this case, we are going to select only the top 20,000 words to reduce the computation time.
-- Create a vocabulary using train dataset and select only top 20,000 words based on frequency
CREATE OR REPLACE TABLE sparse_features_demo.vocabulary AS (
 SELECT
   word,
   word_frequency,
   word_index
 FROM (
   SELECT
     word,
     word_frequency,
     ROW_NUMBER() OVER (ORDER BY word_frequency DESC) - 1 AS word_index
   FROM (
     SELECT
       word,
       COUNT(word) AS word_frequency
     FROM
       sparse_features_demo.processed_reviews,
       UNNEST(words) AS word
     WHERE
       split = "train"
     GROUP BY
       word
   )
 )
 WHERE
   word_index < 20000 # Select top 20,000 words based on word count
);
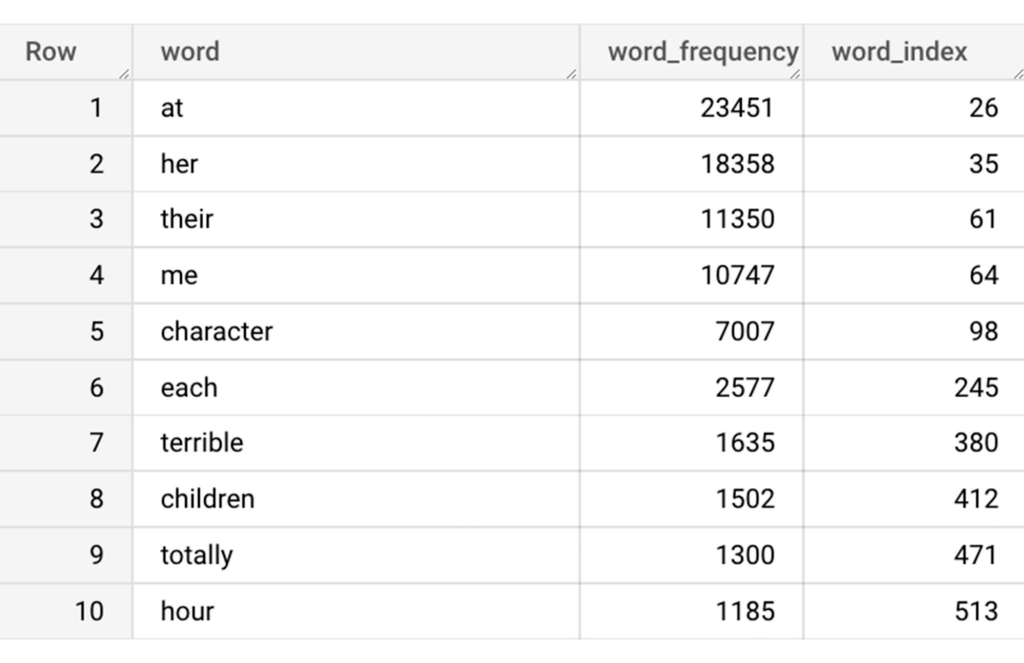
The following shows the top 10 words based on frequency and their respective index from the resulting table of the query above.
Creating a sparse feature
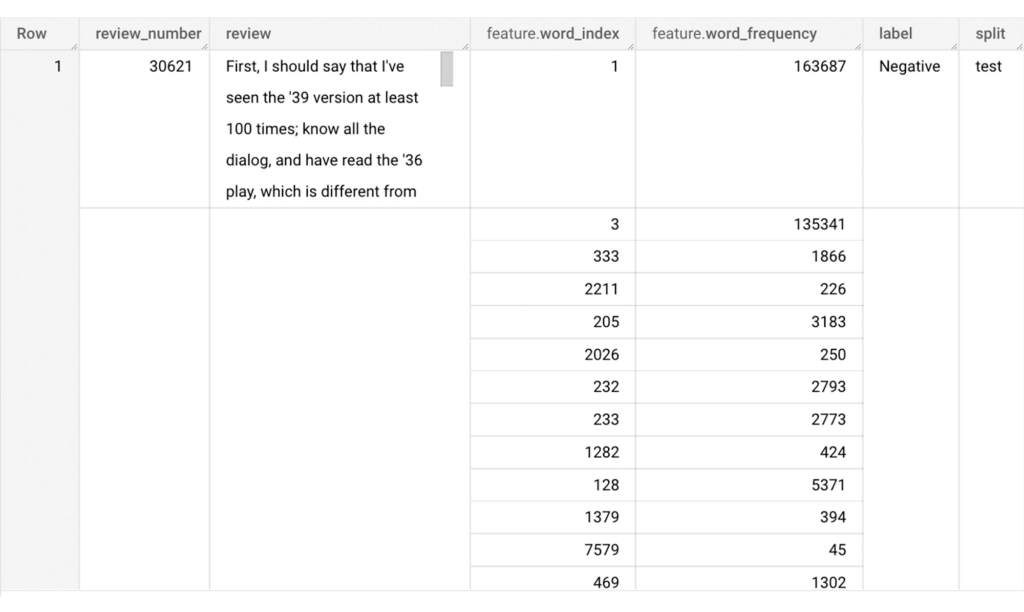
Now we will use the newly added feature to create a sparse feature in BigQuery. For this case, we aggregate word_index and word_frequency in each review, which generates a column as ARRAY[STRUCT] type. Now, each review is represented as ARRAY[(word_index, word_frequency)].
-- Generate a sparse feature by aggregating word_index and word_frequency in each review.
CREATE OR REPLACE TABLE sparse_features_demo.sparse_feature AS (
 SELECT
   review_number,
   review,
   ARRAY_AGG(STRUCT(word_index, word_frequency)) AS feature,
   label,
   split
 FROM (
   SELECT
     DISTINCT review_number,
     review,
     word,
     label,
     split
   FROM
     sparse_features_demo.processed_reviews,
     UNNEST(words) AS word
   WHERE
     word IN (SELECT word FROM sparse_features_demo.vocabulary)
 ) AS word_list
 LEFT JOIN
   sparse_features_demo.vocabulary AS topk_words
   ON
     word_list.word = topk_words.word
 GROUP BY
   review_number,
   review,
   label,
   split
);
Once the query is executed, a sparse feature named `feature` will be created. That `feature` column is an `ARRAY of STRUCT` column which is made of `word_index` and `word_frequency` columns. The picture below displays the resulting table at a glance.
Training a BigQuery ML model
We just created a dataset with a sparse feature in BigQuery. Let’s see how we can use that dataset to train with a machine learning model with BigQuery ML. In the following query, we will train a logistic regression model using the review_number, review, and feature to predict the label:
-- Train a logistic regression classifier using the data with sparse feature
CREATE OR REPLACE MODEL sparse_features_demo.logistic_reg_classifier
 TRANSFORM (
   * EXCEPT (
       review_number,
       review
     )
 )
 OPTIONS(
   MODEL_TYPE='LOGISTIC_REG',
   INPUT_LABEL_COLS = ['label']
 ) AS
 SELECT
   review_number,
   review,
   feature,
   label
 FROM
    sparse_features_demo.sparse_feature
 WHERE
   split = "train"
;
Now that we have trained a BigQuery ML Model using a sparse feature, we evaluate the model and tune it as needed.
-- Evaluate the trained logistic regression classifier
SELECT * FROM ML.EVALUATE(MODEL sparse_features_demo.logistic_reg_classifier);
The score looks like a decent starting point, so let’s go ahead and test the model with the test dataset.

-- Evaluate the trained logistic regression classifier using test data
SELECT * FROM ML.EVALUATE(MODEL sparse_features_demo.logistic_reg_classifier,
 (
   SELECT
     review_number,
     review,
     feature,
     label
   FROM
     sparse_features_demo.sparse_feature
   WHERE
     split = "test"
 )
);
The model performance for the test dataset looks satisfactory and it can now be used for inference. One thing to note here is that since the model is trained on the numerical features, the model will only accept numeral features as input. Hence, the new reviews have to go through the same transformation steps before they can be used for inference. The next step shows how the transformation can be applied to a user-defined dataset.
Sentiment predictions from the BigQuery ML model
All we have left to do now is to create a user-defined dataset, apply the same transformations to the reviews, and use the user-defined sparse features to perform model inference. It can be achieved using a WITH statement as shown below.
WITH
 -- Create a user defined reviews
 user_defined_reviews AS (
   SELECT
     ROW_NUMBER() OVER () AS review_number,
     review,
     REGEXP_EXTRACT_ALL(LOWER(review), '[a-z]{2,}') AS words
   FROM (
     SELECT "What a boring movie" AS review UNION ALL
     SELECT "I don't like this movie" AS review UNION ALL
     SELECT "The best movie ever" AS review
   )
 ),


 -- Create a sparse feature from user defined reviews
 user_defined_sparse_feature AS (
   SELECT
     review_number,
     review,
     ARRAY_AGG(STRUCT(word_index, word_frequency)) AS feature
   FROM (
     SELECT
       DISTINCT review_number,
       review,
       word
     FROM
       user_defined_reviews,
       UNNEST(words) as word
     WHERE
       word IN (SELECT word FROM sparse_features_demo.vocabulary)
   ) AS word_list
   LEFT JOIN
     sparse_features_demo.vocabulary AS topk_words
     ON
       word_list.word = topk_words.word
   GROUP BY
     review_number,
     review
 )


-- Evaluate the trained model using user defined data
SELECT review, predicted_label FROM ML.PREDICT(MODEL sparse_features_demo.logistic_reg_classifier,
 (
   SELECT
     *
   FROM
     user_defined_sparse_feature
 )
);
Here is what you would get for executing the query above:
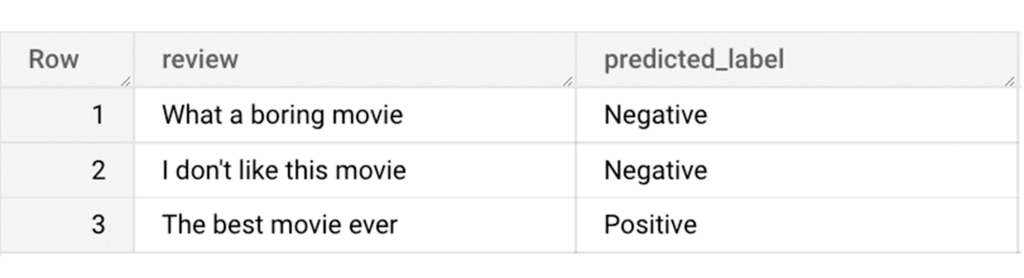
And that’s it! We just performed a sentiment analysis on the IMDb dataset from a BigQuery Public Dataset using only SQL statements and BigQuery ML. Now that we have demonstrated how sparse features can be used with BigQuery ML models, we can’t wait to see all the amazing projects that you would create by harnessing this functionality.
If you’re just getting started with BigQuery, check out our interactive tutorial to begin exploring.
Using Google Cloud’s Backup and DR Service with Logging and Monitoring Tools

1100
Of your peers have already read this article.
2:30 Minutes
The most insightful time you'll spend today!
Backup and DR data is a valuable business asset, and ensuring that it’s safe and accessible is essential. In particular, you want to be able to monitor your backups to ensure that the data is indeed protected and that you can quickly recover it in the event of a disaster, user error, or failed upgrade.
Users of Google Cloud’s Backup and DR service often ask:
- What are the best practices for monitoring my backup and recovery jobs?
- How can I proactively identify issues and troubleshoot?
- How can I create alerts and be notified about important events?
The good news is that Google Cloud Backup and DR now integrates with Cloud Logging and Cloud Monitoring tools. Now, you can monitor backup events, jobs, appliance health, resource consumption and user actions in the same way you monitor other Google Cloud workloads and services.
With this integration, you can now:
- Monitor events related to backup and restore – With detailed Google Cloud Backup and DR service event logs in Cloud Logging, you can now use log based alerts to create a customisable notification, in near-real time. This lets you monitor important events such as backup job failures, jobs that did not run, local backup storage saturation, and network failures.
- Configure fine grained alerting – You can write custom event queries on a wide variety of dimensions such as event severity, application type, application name, job type, job name, error message and many more. This gives a lot of flexibility to define alerts for specific events or conditions within a system, thus reducing noise and helping you identify and fix issues easily.
- Get notified on your preferred notification channel – Google Cloud offers seven pre-built notification channels that let you receive customisable notifications directly over email, SMS, Slack or the Google Cloud mobile app. Alternatively, you can integrate with your own monitoring and event management tools using webhooks or Pub/Sub.
- Derive useful insights to troubleshoot issues – With Log Analytics, you can use BigQuery to query your data using SQL queries and generate operational insights, which can help you reduce time spent troubleshooting. For example, you can analyze the key reasons that backup and restore jobs fail for a given application or application type.
The integration also lets you proactively discover deeper issues related to backup and recovery, such as capacity-related issues or certain job failures that happen periodically, by monitoring recurring events in the logs over time. With log-based metrics, you can:
- Create trend charts to track important metrics such as the number of backup or restore jobs that failed during a day/week/month
- Receive a notification when the number of occurrences crosses a threshold, for example receive a notification if a snapshot pool saturates more than five times a week
- Monitor trends in data, such as latency values in logs, and receive a notification if the values change in an unacceptable way.
Getting started
The time to learn that your backup failed should never be when you go to restore. By integrating our Backup and DR service with Cloud Monitoring and Cloud Logging, you can get valuable assurances about the health of your backup and business continuity processes with the same tools that you use to manage other Google Cloud workloads. To get started, check out the Backup and DR event logs page. You can also watch a video that shows you how to set up and use the service and configure some custom alerts.
Why Data Cloud Matters for Business Transformation

3801
Of your peers have already read this article.
2:00 Minutes
The most insightful time you'll spend today!
I’m so excited to be part of Google Cloud. Data has been a longstanding part of my career and it is at the heart of business transformation. Many companies have mastered the ability to collect data and have mechanisms in place to draw on some of it to solve business problems. But most data collected piles up and is never put to a useful purpose. Accessing it and mining it for helpful insights is practically impossible at many companies. It’s always stuck in hard to reach places, fragmented across departments and unavailable when you need it the most.
Our mission at Google Cloud is to accelerate your ability to digitally transform your business with data. Solving data challenges is in our DNA, and over the last two decades we’ve been in a unique position to help our customers get the most out of data to drive real business value.
Google products are used and loved by billions of people across the globe. These products bring together the complex web of disconnected, disparate, and rapidly changing data that makes up the internet. When you get an answer in milliseconds from google.com via a simple search bar, you know we have this down to a science. Google Cloud brings this expertise in data and software together for businesses of all sizes so that you can gain advantage from your data. We call this the data cloud.
Enter the data cloud
A data cloud offers a comprehensive and proven approach to cloud and embraces the full data lifecycle, from the systems that run your business, where data is born, to analytics that support decision making, to AI and machine learning (ML) that predict and automate the future. A data cloud allows you a way to securely unify data across your entire organization, so you can break down silos, increase agility, innovate faster, get value from your data, and support business transformation. This is the heart of the data cloud.
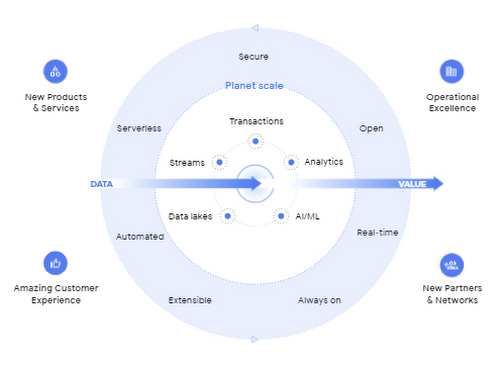
Why a data cloud is essential
Building a data cloud using Google Cloud’s technologies helps organizations accelerate business transformation by giving everyone access to the right information at the right time so that they can act more intelligently based on it.
Since I’ve joined Google, I’ve been not only inspired by the work that the team has done to build products with a user-first mindset, but our customers have been an inspiration to each of us in what’s possible.
- The Home Depot built a data cloud using Google Cloud technologies to help keep 50,000+ items stocked at over 2,000 locations. They’re making their 400,000+ associates smarter by giving them visibility into the things each customer needs, like item location within a local store. By leveraging BigQuery, their query performance dropped from hours and days to seconds and minutes. The Home Depot also uses Cloud SQL, Spanner, and Bigtable for their operational use cases and AI to help locate goods using their mobile apps for in-store navigation.
- Major League Baseball (MLB) is reimagining the fan experience with their data cloud. To build engagement with today’s fans, drive engagement with future generations, and lay the groundwork for future innovation, MLB consolidated its infrastructure and migrated to Google Cloud’s Anthos, Google Kubernetes Engine, Cloud SQL, and BigQuery. MLB tracks every moment of every game for an audience on seven continents with Cloud SQL, this valuable data to drive deeper engagement with fans.
- Vodafone is using their data cloud to offer their customers new, personalized products and services across multiple markets. By identifying more than 700 use cases to deliver new products and services, Vodafone can support fact-based decision-making, reduce costs, remove duplication of data sources, and simplify operations. With Google Cloud, Vodafone’s operating companies in multiple countries can access improved data analytics, intelligence, and machine-learning capabilities.
Here are four reasons why customers trust Google Cloud to build their data cloud strategy:
First, Google delivers insights at planet scale
Customers often gravitate to Google Cloud for our specific data tools that were built for Google’s internal data needs and are unmatched for speed, scale, security, and capability for any size organization. BigQuery is the leading solution for analytics and allows you to run analytics at scale with a 99.99% SLA and up to 34% lower TCO than cloud data warehouse alternatives. Spanner provides unlimited scale, global consistency across regions, and high availability up to 99.999%, at a TCO that is 78% lower compared to on-prem databases and 37% lower than other cloud options. Firestore continues to see rapid adoption with over 2M databases created to power mobile, web, and IoT applications across customer environments. And finally Looker, an API for all your data, offers a single shared place for people and apps to interact with it, no matter the cloud environment.
Second, Google’s AI helps your business be more intelligent
Google was built on pioneering AI research and the principle of making the world’s information useful to people and businesses everywhere. AI powers some of Google’s most popular products, such as Search, Maps, Ads, and YouTube. We have leveraged this expertise to deliver a new, unified AI platform that gives every data scientist, data analyst, and ML engineer access to the same AI toolkit Google uses. Automated machine learning, accelerated experimentation and custom training, and more deployed models than any other platform enable your entire data team to drive business outcomes at any scale.
Third, Google is the open data platform
Google Cloud’s open platform gives customers maximum flexibility for managing transactional, analytical, and AI-based applications. Customers can choose from a wide range of transactional, processing, and analytics engines, open source tools, open APIs, and ML services to eliminate lock-in. This includes choice of deployment across multi-cloud and hybrid environments and easy interoperability with existing partner solutions and investments. With BigQuery Omni, organizations can choose to deploy their data warehousing solution to work natively with AWS or with Azure (coming soon). Looker supports 50+ distinct SQL dialects across multiple clouds and our database services like Cloud SQL, one of the fastest growing services at Google Cloud, offers familiar open source MySQL and PostgreSQL standard connection drivers, so you can work with your preferred tools and stay up-to-date with the latest community enhancements. In addition, Google offers an unrivaled developer community across the fields of AI, machine learning, mobile, application development, microservices, and access to third party solutions and open source systems.
Fourth, Google offers a trusted platform for your data needs
Customers can take advantage of the same secure-by-design infrastructure, built-in data protection, and global network that Google uses to ensure compliance, redundancy, and reliability. All of Google’s data is encrypted in transit and at rest, by default. Google offers industry-leading reliability across regions so you’re always up and running. Spanner offers a 99.999% SLA and BigQuery offers a 99.99% SLA. For BI and embedded analytics, Looker supports data governance via a semantic layer that organizes your data and stores your business logic centrally, delivering consistent and trusted KPIs. And finally, our multi-layered security approach across hardware, services, user identity, storage, internet communication and operations provides peace of mind that your data is protected.
Learn more at Data Cloud Summit
We are committed to helping you build a data cloud that gives you deep insights into your business and process automation. Join me as I welcome Anders Gustafsson, CEO of Zebra and
Gil Perez, CIO of Deutsche Bank at the Data Cloud Summit on May 26, 2021 to learn and share new ways to use data for good. I can’t wait to hear what you accomplish.
Migrate Your Microsoft SQL Server Workloads to Google Cloud

3904
Of your peers have already read this article.
7:30 Minutes
The most insightful time you'll spend today!
Enterprise database workloads are the backbone of many of your applications and ecosystems. Also, guaranteed availability is critical when choosing a cloud provider.
Many enterprises built their mission-critical applications on Microsoft SQL Server 2008, and it’s common still to run into older versions of SQL Server as you’re working toward modernizing your on-prem environments.
According to Business insider, 60% of Microsoft users still use SQL Server 2008, which reached its end of life in July 2019. This provides the opportunity for many of you to find a place to host your SQL Server 2008 instances on newer technology with less operational burden.
We’re announcing that Cloud SQL for SQL Server is generally available globally. This means that Cloud SQL now helps you keep your SQL Server workloads running by providing a 99.95% uptime service-level agreement (SLA), which is consistent with the other Cloud SQL database engines.
Cloud SQL for SQL Server is fully managed and compatible with SQL Server 2017. Now you can migrate your critical production SQL Server workloads to Google Cloud and rely on the service’s stability and reliability.
We hear from enterprise companies how important the ability to migrate to Cloud SQL for SQL Server is to their larger goals of infrastructure modernization and a multi-cloud strategy. On-premises applications like HR, finance, and payroll often depend on these legacy databases to keep running.
Customers often cite the challenge of wanting to maintain compatibility with these existing systems and datasets, while also streamlining deployments and scale-out at a fraction of the overhead. Migrating these instances to Cloud SQL for SQL Server can save costs and maintenance time and improve efficiency and speed.
Getting started migrating SQL Server 2008
The migration for Microsoft SQL Server 2008 to Cloud SQL for SQL Server can be achieved in a simple five steps. For details, check out the full migration guide: SQL Server 2008 R2 server to Cloud SQL for SQL Server.
1. Create a Cloud SQL for SQL Server instance
gcloud beta sql instances create target  \
    --database-version=SQLSERVER_2017_ENTERPRISE \
    --cpu=2 \
    --memory=5GB \
    --root-password=sqlserver12@ \
    --zone=us-central1-f
2. Create a Cloud Storage bucket
gsutil mb -b off -l US "gs://bucket-name"3. Back up your Microsoft SQL Server 2008 database
osql -E -Q “BACKUP DATABASE db-name TO DISK=’c:\backup\db-name.bak'”
4. Import the database into Cloud SQL for SQL Server
gcloud beta sql import bak target \
    gs://bucket-namedb-name.bak \
    --database db-name
5. Validate the imported data
/opt/mssql-tools/bin/sqlcmd -U sqlserver -S 127.0.0.1 -Q “query-string”
If you’re working with newer versions of SQL Server, check out the SQL Server 2017 to Cloud SQL for SQL Server migration guide.
Since the launch of Cloud SQL for SQL Server, we’ve heard your feedback and have continued to improve the performance and durability of the service. We expect to continue our rapid pace of innovation and feature releases to meet our customers’ needs and address feedback. Cloud SQL for SQL Server has proven itself as a key component when migrating existing enterprise applications and infrastructure.
We’re continuing to rapidly improve Cloud SQL for SQL Server to meet all of your cloud database needs. Stay tuned for features in development that can help with Active Directory integration, online migrations, and more options for replicas and machine types.
What Swiggy and You Can Learn From This Company’s Use of ML to Engage Customers

9644
Of your peers have already read this article.
1:45 Minutes
The most insightful time you'll spend today!
The app economy has enabled a huge range of unique business models to flourish. One such model is online food ordering and delivery services, in which apps leverage geo-location data to aggregate local food choices and offer personalized options to consumers.
A leading company in this space is Just Eat. Launched in the UK in 2001 with a vision of ‘serving the world’s greatest menu. Brilliantly.’ The company has capitalized on the popularity of online food delivery and grown its presence across 12 markets.
Just Eat acts as an intermediary between take-out food outlets and hungry customers, giving local restaurants access to a broader base of potential diners, while providing consumers with an easy and secure way to order and pay for food from their favourite restaurants.
Today the company helps 27 million customers find food from more than 112,000 restaurants—everything from homemade Italian pasta, to Chinese noodle bowls, to fish-and-chips.
Data is the fuel of Just Eat’s rapid growth, but it wasn’t always looked at that way. In its early days, Just Eat struggled with the deluge of information and faced fragmentation across its systems. In fact, the company realized its legacy data vendor wasn’t capable of ingesting 90 percent of the data produced by its food platform. This was incredibly frustrating for Just Eat’s analysts and data scientists, who had to waste time cleaning up sources instead of leveraging the data to create a better user experience.
Just Eat turned to Google Cloud, and now uses machine learning (ML) to power sophisticated consumer recommendations on both its app and website. It also makes heavy use of features offered by Google Cloud Platform, including BigQuery for running analytics on its customer data set and Cloud Pub/Sub for messaging app users with relevant offers in real-time.
Having all of Just Eat’s data in one platform has translated into real value for its customers. With Google Cloud tools, Just Eat has created its own proprietary Customer Ontology framework, which today contains 5.5 billion features that better understand consumers’ behavior and food habits, and provides insights into previous visits.
Just Eat recently created an “Adventurous Index” to map its customers according to their ordering habits, enabling them to tailor their marketing and user experiences. For example, mid-adventurous customers are shown a choice of restaurants that serve their most ordered cuisine, while adventurous customers can choose from restaurants that serve a wider variety. This not only has prompted consumers to be more adventurous with their choices, but also has led to more business at a more diverse set of restaurants.
Matt Cresswell, Director of Customer Platforms at Just Eat said that Google Cloud has become integral to its product delivery: “Consumer food choice is a hugely nuanced topic. We know that individuals have their own unique journeys when they use Just Eat. We’ve sought to create a truly one-to-one relationship with every customer. The changes we’ve made to the platform mean they can access the dishes they enjoy at the touch of a fingertip, and find inspiration to discover new dishes they’ll love. We’re grateful to Google Cloud for helping us support our customers on their culinary explorations.”
Soundtrack Your Brand: Delivering Sound That Stands Out From the Crowd with BigQuery

2836
Of your peers have already read this article.
6:00 Minutes
The most insightful time you'll spend today!
Editor’s note: Soundtrack Your Brand is an award-winning streaming service with the world’s largest licensed music catalog built just for businesses, backed by Spotify. Today, we hear how BigQuery has been a foundational component in helping them transform big data into music.
Soundtrack Your Brand is a music company at its heart, but big data is our soul. Playing the right music at the right time has a huge influence on the emotions a brand inspires, the overall customer experience, and sales. We have a catalog of over 58 million songs and their associated metadata from our music providers and a vast amount of user data that helps us deliver personalized recommendations, curate playlists and stations, and even generate listening schedules. As an example, through our Schedules feature our customers can set up what to play during the week. Taking that one step further, we provide suggestions on what to use in different time slots and recommend entire schedules.
Using BigQuery, we built a data lake to empower our employees to access all this content and metadata in a structured way. Ensuring that our data is easily discoverable and accessible allows us to build any type of analytics or machine learning (ML) use case and run queries reliably and consistently across the complete data set. Today, our users are benefiting from this advanced analytics through the personalized recommendations we offer across our core features: Home, Search, Playlists, Stations, and Schedules.
Fine-tuning developer productivity
The biggest business value that comes from BigQuery is how much it speeds up our development capabilities and allows us to ship features faster. In the past 3 years, we have built more than 150 pipelines and more than 30 new APIs within our ML and data teams that total about 10 people. That is an impressive rate of a new pipeline every week and a new API every month. With everything in BigQuery, it’s easy to simply write SQL and have it be orchestrated within a CI/CD toolchain to automate our data processing pipelines. An in-house tool built as a github template, in many ways very similar to Dataform, helps us build very complex ETL processes in minutes, significantly reducing the time spent on data wrangling.
BigQuery acts as a cornerstone for our entire data ecosystem, a place to anchor all our data and be our single source of truth. This single source of truth has expanded the limits of what we can do with our data. Most of our pipelines start from a data lake, or end at a data lake, increasing re-usability of data and collaboration. For example, one of our interns built an entire churn prediction pipeline in a couple of days on top of existing tables that are produced daily. Nearly a year later, this pipeline is still running without failure largely due to its simplicity. The pipeline is BigQuery queries chained together into a BigQuery ML model running on a schedule with Kubeflow Pipelines.
Once we made BigQuery the anchor for our data operations, we discovered we could apply it to use cases that you might not expect, such as maintaining our configurations or supporting our content management system. For instance, we created a Google Sheet where our music experts are able to correct genre classification mistakes for songs by simply adding a row to a Google Sheet. Instead of hours or days to create a bespoke tool, we were able to set everything up in a few minutes.
BigQuery’s ability to consume Excel spreadsheets allows business users who play key roles in improving our recommendations engine and curating our music, such as our content managers and DJs, to contribute to the data pipeline.
Another example is our use of BigQuery as an index for some of our large Cloud Storage buckets. By using cloud functions to subscribe to read/write events for a bucket, and writing those events to partitioned tables, our pipelines can easily and in a natural way quickly search and access files, such as downloading and processing the audio of new track releases. We also make use of Log Events when a table is added to a dataset to trigger pipelines that process data on demand, such as JSON/CSV files from some of our data providers that are newly imported into BQ. Being the place for all file integration and processing, BQ allows new data to be quickly available to our entire data ecosystem in a timely and cost effective manner while allowing for data retention, ETL, ACL and easy introspection.
BigQuery makes everything simple. We can make a quick partitioned table and run queries that use thousands of CPU hours to sift through a massive volume of data in seconds — and only pay a few dollars for the service. The result? Very quick, cost-effective ETL pipelines.
In addition, centralizing all of our data in BigQuery makes it possible to easily establish connections between pipelines providing developers with a clear understanding of what specific type of data a pipeline will produce. If a developer wants a different outcome, she can copy the github template and change some settings to create a new, independent pipeline.
Another benefit is that developers don’t have to coordinate schedules or sync with each other’s pipelines: they just need to know that a table that is updated daily exists and can be relied on as a data source for an application. Each developer can progress their work independently without worrying about interfering with other developers’ use of the platform.
Making iteration our forte
Out of the box, BigQuery met and exceeded our performance expectations, but ML performance was the area that really took us by surprise. Suddenly, we found ourselves going through millions of rows in a few seconds, where the previous method might have taken an hour. This performance boost ultimately led to us improving our artist clustering workload from more than 24 hours on a job running 100 CPU workers to 10 minutes on a BigQuery pipeline running inference queries in a loop until convergence. This more than 140x performance improvement also came at 3% of the cost.
Currently we have more than 100 Neural Network ML models being trained and run regularly in batch in BQML. This setup has become our favorite method for both fast prototyping and creating production ready models. Not only is it fast and easy to hypertune in BQML, but our benchmarks show comparable performance metrics to using our own Tensorflow code. We now use Tensorflow sparingly. Differences in input data can have an even greater impact on the experience of the end user than individual tweaks to the models.
BigQuery’s performance makes it easy to iterate with the domain experts who help shape our recommendations engine or who are concerned about churn, as we are able to show them the outcome on our recommendations from changes to input data in real-time. One of our favorite things to do is to build a Data Studio report that has the ML.predict query as part of its data source query. This report shows examples of good/bad predictions in the report along with bias/variance summaries and a series of drop-downs, thresholds and toggles to control the input features and the output threshold. We give that report to our team of domain experts to help manually tune the models, putting the model tuning right in the hands of the domain experts. Having humans in the loop has become trivial for our team. In addition to fast iteration, the BigQuery ML approach is also very low maintenance. You don’t need to write a lot of Python or Scala code or maintain and update multiple frameworks—everything can be written as SQL queries run against the data store.
Helping brands to beat the band—and the competition
BigQuery has allowed us to establish a single source of truth for our company that our developers and domain experts can build on to create new and innovative applications that help our customers find the sound that fits their brand.
Instead of cobbling together data from arbitrary sources, our developers now always start with a data set from BigQuery and build forward. This guarantees the stability of our data pipeline and makes it possible to build outward into new applications with confidence. Moreover, the performance of BigQuery means domain experts can interact with the analytics and applications that developers create more easily and see the results of their recommended improvements to ML models or data inputs quickly. This rapid iteration drives better business results, keeps our developers and domain experts aligned, and ensures Soundtrack Your Brand keeps delivering sound that stands out from the crowd.
More Relevant Stories for Your Company

Mrs. T’s Pierogies Moves SAP Systems to Google Cloud for Faster Analytics Capabilities for its SAP Data
Pierogies might just be the ultimate comfort food. But when Mrs. T’s Pierogies — the leading manufacturer of frozen pierogies in the US — learned it needed to transition its existing on-premises SAP ECC to S/4HANA, the company sought a little comfort for itself. Founded in 1952, Mrs. T’s Pierogies

DR for Cloud: Architecting Microsoft SQL Server with Google Cloud
Database disaster recovery (DR) planning is an important component of a bigger DR plan, and for enterprises using Microsoft SQL Server on Compute Engine, it often involves critical data. When you’re architecting a disaster recovery solution with Microsoft SQL Server running on Google Cloud Platform (GCP), you have some decisions to make

Maximizing Storage Efficiency: A Guide to Reducing Point-in-Time Recovery Impact
Point-In-Time Recovery (PITR) is a critical capability for enterprise applications. It allows database administrators to recover from accidental data deletion by restoring their production databases to a time before the incident. Cloud SQL for PostgreSQL launched support for PITR in July 2020, allowing you to recover from disasters like data


Business Modernization with Oracle Workloads in Google Cloud
With today's ever-changing business dynamics, business continuity is a key focus for all of us, and enterprise databases like Oracle play a critical role. We’ll explore how running Oracle workloads in Google Cloud creates a variety of solutions, from a Bare Metal Solution to open source and cloud-native databases, to
