





Data to Business Outcomes with Google’s Data Analytics Design Pattern

6729
Of your peers have already read this article.
1:30 Minutes
The most insightful time you'll spend today!
Companies today are inundated with vast amounts of data from various sources. This overwhelming amount of data is meant to benefit the company, but often leaves data teams feeling overwhelmed, which can create data bottlenecks and result in a slow time to value. In fact, only twenty seven percent of companies agree that data and analytics projects produce insights and recommendations that are highly actionable (Accenture). This means that nearly 3 in 4 companies are not unlocking value in their data, which poses a huge challenge for organizations trying to move the needle and drive real business results. We at Google Cloud, however, saw opportunity in this challenge, which is why we created Data Analytics Design Patterns: cross-product technical solutions designed to accelerate a customer’s path to value realization with their data. These industry solutions bring together product capabilities alongside design methodology, open source deployable code, data models, and reference architectures to accelerate your business outcomes.

With Data Analytics Design Patterns, you get access to more than 30 ready-to-deploy data analytics solutions. Design patterns leverage the best of Google and our rich partner ecosystem, including Technology Partners & System Integrators. In this blog, we will cover 3 examples on how a design pattern can be applied to unlock the value of data:
- Improve mobile app experience with Unified App Analytics
- Maximize digital shop’s revenue with Price Optimization
- Protect internal systems from security and malware threat with Anomaly Detection
Unified App Analytics
If mobile apps are part of your go-to-market strategy, you have several data sources that can provide invaluable customer insights. In addition to tools such as CRM (e.g. Salesforce) and customer care (e.g. Zendesk), you likely use Google Analytics to log app events and Firebase Crashlytics to gather data about app errors. But can you easily combine back-end server data with app front-end data to unlock customer insights?
The Unified App Analytics design pattern makes it easy to plug all the disparate data sources into a single warehouse (BigQuery) and start analyzing it with a Business Intelligence tool (Looker). Once you have a complete and real time view of your customer experience with your app, you can take action. For example, if you notice an increase in app errors, you can quickly combine your Crashlytics data with your CRM data to narrow down the crashes with the highest revenue impact and prioritize their resolution. Further, you can automate your issue resolution workflow by creating a rule for any future crash that impacts a subset of VIP customers.

With the Unified App Analytics design pattern, you’ll gain access to valuable insights about your user experience with your app so you can inform your future app strategy. For example, NPR, an American media company, increased user engagement by showing content that better mapped to listener interests and behaviors.
Price Optimization
In a competitive and hectic global marketplace, strategic pricing matters more than ever, but often projects are consumed by the tedium of standardizing, cleaning, and preparing data—from transactions, inventory, demand, among other sources.
Price Optimization solution allows retailers to build a data driven pricing model. The solution consists of three main components:
- Dataprep by Trifacta: integrates different data sources into a single Common Data Model (CDM). Dataprep is an intelligent data service for visually exploring, cleaning, and preparing structured and unstructured data for analysis, reporting, and machine learning.
- BigQuery: allows you to create and store pricing models in a consistent and scalable way as a serverless Cloud Data Warehouse service
- Looker dashboards: surface insights and enable business teams to take action with enterprise ready BI platform
With the Price Optimization design pattern from Google Cloud and our partner Trifacta, you’ll be able to rapidly unify multiple data sources and create a real-time and ML-powered analysis, leveraging predictive models to estimate future sales. For example, PDPAOLA, an online jewelry company, doubled sales with dynamic pricing adjustments enabled by a single data view.

Anomaly Detection
Organizations need to anticipate and act on risks and opportunities to stay competitive in a digitally transforming society. Anomaly detection helps organizations identify and respond to data points and data trends in high velocity, high volume data sets that deviate from historical standards and expected behaviors, allowing them to take action on changing user needs, mitigate malicious actors and behaviors, and prevent unnecessary costs and monetary losses.
The Anomaly Detection design pattern uses Google Pub/Sub, BigQuery, Dataflow, and Looker to:
- Stream events in real time
- Process the events, extract useful data points, train the detection algorithm of choice
- Apply the detection algorithm in near-real time to the events to detect anomalies
- Update dashboards and/or send alerts
The challenge of finding the important insights and anomalies in vast amounts of data applies to organizations across all industries and lines of business, but is especially important to protecting the security of an organization. For example, TELUS, a national communications company, modernized their security analytics platform leveraging this pattern, allowing them to detect anomalies in near real time to detect and mitigate suspicious activity.
Get started
Turn your data into business outcomes with Google Cloud and our broad partner ecosystem by deploying Data Analytics Design Patterns at your organization. There are more than 30 Data Analytics Design Patterns ready for you to use. We have more than 200+ more ideas in the pipeline, so be sure to check in regularly as new patterns will be added soon.
To dive deeper and find out more about how Data Analytics Design Patterns can help your organization accelerate use cases and create faster time to value, check out this video.
Data to Business Outcomes with Google’s Data Analytics Design Pattern
6730
Of your peers have already read this article.
1:30 Minutes
The most insightful time you'll spend today!
Companies today are inundated with vast amounts of data from various sources. This overwhelming amount of data is meant to benefit the company, but often leaves data teams feeling overwhelmed, which can create data bottlenecks and result in a slow time to value. In fact, only twenty seven percent of companies agree that data and analytics projects produce insights and recommendations that are highly actionable (Accenture). This means that nearly 3 in 4 companies are not unlocking value in their data, which poses a huge challenge for organizations trying to move the needle and drive real business results. We at Google Cloud, however, saw opportunity in this challenge, which is why we created Data Analytics Design Patterns: cross-product technical solutions designed to accelerate a customer’s path to value realization with their data. These industry solutions bring together product capabilities alongside design methodology, open source deployable code, data models, and reference architectures to accelerate your business outcomes.
With Data Analytics Design Patterns, you get access to more than 30 ready-to-deploy data analytics solutions. Design patterns leverage the best of Google and our rich partner ecosystem, including Technology Partners & System Integrators. In this blog, we will cover 3 examples on how a design pattern can be applied to unlock the value of data:
- Improve mobile app experience with Unified App Analytics
- Maximize digital shop’s revenue with Price Optimization
- Protect internal systems from security and malware threat with Anomaly Detection
Unified App Analytics
If mobile apps are part of your go-to-market strategy, you have several data sources that can provide invaluable customer insights. In addition to tools such as CRM (e.g. Salesforce) and customer care (e.g. Zendesk), you likely use Google Analytics to log app events and Firebase Crashlytics to gather data about app errors. But can you easily combine back-end server data with app front-end data to unlock customer insights?
The Unified App Analytics design pattern makes it easy to plug all the disparate data sources into a single warehouse (BigQuery) and start analyzing it with a Business Intelligence tool (Looker). Once you have a complete and real time view of your customer experience with your app, you can take action. For example, if you notice an increase in app errors, you can quickly combine your Crashlytics data with your CRM data to narrow down the crashes with the highest revenue impact and prioritize their resolution. Further, you can automate your issue resolution workflow by creating a rule for any future crash that impacts a subset of VIP customers.
With the Unified App Analytics design pattern, you’ll gain access to valuable insights about your user experience with your app so you can inform your future app strategy. For example, NPR, an American media company, increased user engagement by showing content that better mapped to listener interests and behaviors.
Price Optimization
In a competitive and hectic global marketplace, strategic pricing matters more than ever, but often projects are consumed by the tedium of standardizing, cleaning, and preparing data—from transactions, inventory, demand, among other sources.
Price Optimization solution allows retailers to build a data driven pricing model. The solution consists of three main components:
- Dataprep by Trifacta: integrates different data sources into a single Common Data Model (CDM). Dataprep is an intelligent data service for visually exploring, cleaning, and preparing structured and unstructured data for analysis, reporting, and machine learning.
- BigQuery: allows you to create and store pricing models in a consistent and scalable way as a serverless Cloud Data Warehouse service
- Looker dashboards: surface insights and enable business teams to take action with enterprise ready BI platform
With the Price Optimization design pattern from Google Cloud and our partner Trifacta, you’ll be able to rapidly unify multiple data sources and create a real-time and ML-powered analysis, leveraging predictive models to estimate future sales. For example, PDPAOLA, an online jewelry company, doubled sales with dynamic pricing adjustments enabled by a single data view.
Anomaly Detection
Organizations need to anticipate and act on risks and opportunities to stay competitive in a digitally transforming society. Anomaly detection helps organizations identify and respond to data points and data trends in high velocity, high volume data sets that deviate from historical standards and expected behaviors, allowing them to take action on changing user needs, mitigate malicious actors and behaviors, and prevent unnecessary costs and monetary losses.
The Anomaly Detection design pattern uses Google Pub/Sub, BigQuery, Dataflow, and Looker to:
- Stream events in real time
- Process the events, extract useful data points, train the detection algorithm of choice
- Apply the detection algorithm in near-real time to the events to detect anomalies
- Update dashboards and/or send alerts
The challenge of finding the important insights and anomalies in vast amounts of data applies to organizations across all industries and lines of business, but is especially important to protecting the security of an organization. For example, TELUS, a national communications company, modernized their security analytics platform leveraging this pattern, allowing them to detect anomalies in near real time to detect and mitigate suspicious activity.
Get started
Turn your data into business outcomes with Google Cloud and our broad partner ecosystem by deploying Data Analytics Design Patterns at your organization. There are more than 30 Data Analytics Design Patterns ready for you to use. We have more than 200+ more ideas in the pipeline, so be sure to check in regularly as new patterns will be added soon.
To dive deeper and find out more about how Data Analytics Design Patterns can help your organization accelerate use cases and create faster time to value, check out this video.
Cloud IoT Core Helps Businesses Leverage their IoT Data to Build a Competitive Edge

7085
Of your peers have already read this article.
1:30 Minutes
The most insightful time you'll spend today!
The ability to gain real-time insights from IoT data can redefine competitiveness for businesses. Intelligence allows connected devices and assets to interact efficiently with applications and with human beings in an intuitive and non-disruptive way. After your IoT project is up and running, many devices will be producing lots of data. You need an efficient, scalable, affordable way to both manage those devices and handle all that information.
IoT Core is a fully managed service for managing IoT devices. It supports registration, authentication, and authorization inside the Google Cloud resource hierarchy as well as device metadata stored in the cloud, and the ability to send device configuration from other GCP or third-party services to devices.
Main components
The main components of Cloud IoT Core are the device manager and the protocol bridges:
- The device manager registers devices with the service, so you can then monitor and configure them. It provides:
- Device identity management
- Support for configuring, updating, and controlling individual devices
- Role-level access control
- Console and APIs for device deployment and monitoring
- Two protocol bridges (MQTT and HTTP) can be used by devices to connect to Google Cloud Platform for:
- Bi-directional messaging
- Automatic load balancing
- Global data access with Pub/Sub
How does Cloud IoT Core work?
Device telemetry data is forwarded to a Cloud Pub/Sub topic, which can then be used to trigger Cloud Functions as well as other third-party apps to consume the data. You can also perform streaming analysis with Dataflow or custom analysis with your own subscribers.
Cloud IoT Core supports direct device connections as well as gateway-based architectures. In both cases the real time state of the device and the operational data is ingested into Cloud IoT Core and the key and certificates at the edge are also managed by Cloud IoT Core. From Pub/Sub the raw input is fed into Dataflow for transformation, and the cleaned output is populated in Cloud Bigtable for real-time monitoring or BigQuery for warehousing and machine learning. From BigQuery the data can be used for visualization in Looker or Data Studio and it can be used in Vertex AI for creating machine learning models. The models created can be deployed at the edge using Edge Manager (in experimental phase). Device configuration updates or device commands can be triggered by Cloud Functions or Dataflow to Cloud IoT Core, which then updates the device.
Design principles of Cloud IoT Core
As a managed service to securely connect, manage, and ingest data from global device fleets, Cloud IoT COre is designed to be:
- Flexible, providing easy provisioning of device identities and enabling devices to access most of Google Cloud
- IThe industry leader in IoT scalability and performance
- Interoperable, with supports for the most common industry-standard IoT protocols
Use cases
IoT use cases range across numerous industries. Some typical examples include:
- Asset tracking, visual inspection, and quality control in retail, automotive, industrial, supply chain and logistics
- Remote monitoring and predictive maintenance in oil & gas, utilities, manufacturing, and transportation
- Connected homes and consumer technologies.
- Vision intelligence in retail, security, manufacturing, and industrial sectors
- Smart living in commercial, residential, and smart spaces
- Smart factories with predictive maintenance and real-time plant floor analytics
For a more in-depth look into Cloud IoT Core check out the documentation.
https://youtube.com/watch?v=76v16P-Wqe4%3Fenablejsapi%3D1%26
For more #GCPSketchnote, follow the GitHub repo. For similar cloud content follow me on Twitter @pvergadia and keep an eye out on thecloudgirl.dev.
Architecting Multi-region Database Disaster Recovery for MySQL

4092
Of your peers have already read this article.
4:30 Minutes
The most insightful time you'll spend today!
Enterprises expect extreme reliability of the database infrastructure that’s accessed by their applications. Despite your best intentions and careful engineering, database errors happen, whether that’s machine crashes or network partitioning. Good planning can help you stay ahead of problems and recover more quickly when issues do occur.
This blog shows one approach of deploying a database architecture that implements high availability and disaster recovery for MySQL on Compute Engine, using regional disks as well as load balancers.
Any database architecture must provide approaches to tolerate errors and recover from those errors quickly without losing data. These approaches are expressed in RTO (recovery time objective) and RPO (recovery point objective), which offer ways to set and then measure how long a service can be unavailable, and how far back data should be saved.
After a database error, a database must recover as fast as possible with an RTO as small as possible, ideally in seconds. There must be as little data loss as possible—ideally, none at all. The desired RPO is the last consistent database state.
From a database architecture and deployment viewpoint, this can be accomplished with two distinct concepts: high availability and disaster recovery. Use both at the same time in order to achieve an architecture that’s prepared for the widest range of errors or incidents.
Creating a resilient database architecture
A high-availability database architecture has database instances in two or more zones. If a server on a zone fails, or the zone becomes inaccessible, the instances in other zones are available to continue the processing. The figure below shows two instances, one in zone zn1, and one in zone zn2. The load balancer in front supports directing traffic to a healthy database instance available for read and write queries.
A disaster recovery architecture adds a second high-availability database setup in a second region. If one of the regions becomes inaccessible or fails, the other region takes over. The figure below shows two regions, primary and DR. Data is replicated from the primary to the DR region so that the DR region can take over from the latest consistent database state. The load balancer in front of the regions directs traffic to the region in charge of the read and write traffic. Here’s how this architecture looks:
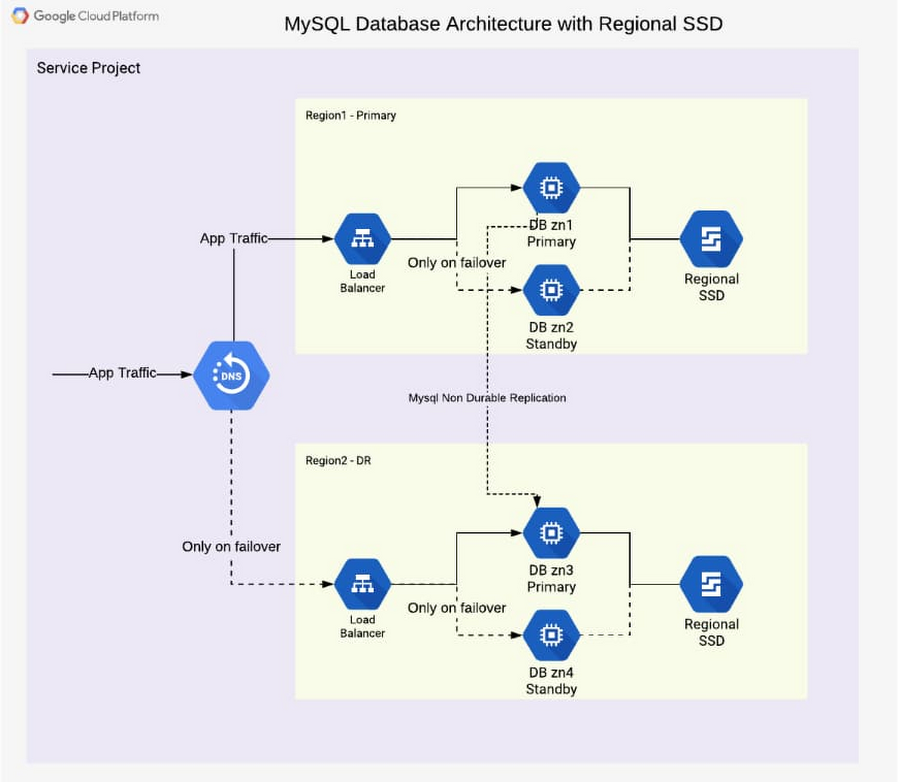
In addition to the database instance setup, a regional disk is deployed so that data is written simultaneously in two zones, proving fail-safe in the event of zone failure. This is a huge advantage of Google Cloud, allowing you to skip MySQL-level replication within a region. Each write operation to disk is done in two zones synchronously. When the primary instance fails, a standby instance is mounted with regional persistent disk(s), and the database service (MySQL) is then started using the same. This brings the peace of mind of not worrying about replication lag or database state for high availability.
From a disaster recovery process view, the following happens over time during a failure situation:
- Normal steady state database operation
- A failure happens and a region becomes unavailable or the database instance inaccessible
- A decision must be made to fail over or not (in case there is the expectation that the region becomes available soon enough or the instance becomes responsive again)
- DNS is updated manually, therefore it redirects application traffic to a second region
- Fallback to the primary region after it becomes available again is optional, as the second region is a fully built-out deployment
From a high-availability process view, the following happens over time during a failure situation:
- Normal steady state database operation
- Database instance fails or becomes unavailable
- Launch the standby instance
- Mount regional SSD and start database
- Automatic redirection of application traffic to the standby via load balancer
- After the failed or unavailable instance becomes available again, a fallback can take place or not
The database architecture shown demonstrates a highly available architecture supporting disaster recovery. With regional disks and load balancers, it is straightforward to provide a resilient database deployment.
Find out more about load balancers and regional disks. Check out general HA and DR processes and detailed steps in the initial part of the reference guide. Try it out to become familiar with the architecture as well as the two major failover processes.
10508
Of your peers have already watched this video.
2:15 Minutes
The most insightful time you'll spend today!
The True Story of How HotStar Broke a World-Record–Thanks to Firebase and Google BigQuery
Hotstar, India’s largest video streaming platform with 150 million monthly active users around the world, provides live-streaming of TV shows, movies, sports, and news on the go.
By using a combination of Firebase products together, Hotstar safely rolled out new features to its watch screen during a major live-streaming event without disrupting users, sacrificing stability, or releasing a new build. They also used Firebase with BigQuery to analyze their event data and reduce app startup time.
“We have an ambitious mission, but our engineering team is only a fraction of the size of most of our competitors. But we are still keeping up, and we are doing it with the help of Firebase,” says Ayushi Gupta, Android Engineer, Hotstar.
5035
Of your peers have already watched this video.
21:00 Minutes
The most insightful time you'll spend today!
Uber’s Story of Scaling Their App with Millions of Concurrent Requests
Uber has millions of concurrent customers who use the platform to book rides and place food delivery orders, generating billions of database transactions per day. In just a click of a button, Uber captures users’ intent which bases their fulfillment model to meet the customers’ demand, and match it to active providers that address their demand with supply.
Uber’s fulfillment platform capability is the lifeline powering every line of business and also allows rapid scaling of new verticals. Hundreds of microservices at Uber depend on this fulfillment platform as a source of truth for all their active booking, delivery or order session. The events generated by this platform are used by hundreds of offline data sets to power business decisions. Additionally over hundreds of developers at Uber extend the platform with APIs, events and codes to build 120+ unique fulfillment flows!
Watch the video to learn about Uber’s decision to move from on-prem to Google Cloud’s Cloud Spanner while still taking live orders at scale and meeting customers’ expectations.
More Relevant Stories for Your Company

Cart.com to Transform e-Commerce for Brands Globally
The ecommerce playing field has been hard to navigate for most retailers, and Cart.com is on a mission to change that. Traditionally, retailers needing to run their online store, order fulfillment, customer service, marketing, and other essential activities have had to cobble together systems to get the capabilities they need

GCP Launches Datastream, A Serverless Change Data Capture and Replication Service
Today, we’re announcing Datastream, a serverless change data capture (CDC) and replication service, available now in preview. Datastream allows enterprises to synchronize data across heterogeneous databases, storage systems, and applications reliably and with minimal latency to support real-time analytics, database replication, and event-driven architectures. You can now easily and seamlessly deliver

Data Cloud Skills to Pick Up in 2022: Google Experts Recommended
It’s 2022 and nanosatellites, NFTs, and autonomous cars that deliver your pizza are in full force. In a world where people rely on simple technology to untangle complex problems, companies must deliver simple experiences to be successful in today’s landscape. For many cloud providers this means enabling tightly integrated data

Neo4J & Google Cloud: Graph Data in Cloud to Address Challenges in FinServ Industry
Over the last decade, financial service organizations have been adopting a cloud-first mindset. According to InformationWeek, lower costs and enhanced scalability were the biggest drivers for cloud adoption in financial services, and cloud-native applications allow access to the latest technology and talent, enabling adopters to rebuild transaction processing systems capable of
