





10536
Of your peers have already watched this video.
2:15 Minutes
The most insightful time you'll spend today!
The True Story of How HotStar Broke a World-Record–Thanks to Firebase and Google BigQuery
Hotstar, India’s largest video streaming platform with 150 million monthly active users around the world, provides live-streaming of TV shows, movies, sports, and news on the go.
By using a combination of Firebase products together, Hotstar safely rolled out new features to its watch screen during a major live-streaming event without disrupting users, sacrificing stability, or releasing a new build. They also used Firebase with BigQuery to analyze their event data and reduce app startup time.
“We have an ambitious mission, but our engineering team is only a fraction of the size of most of our competitors. But we are still keeping up, and we are doing it with the help of Firebase,” says Ayushi Gupta, Android Engineer, Hotstar.
6092
Of your peers have already watched this video.
48:30 Minutes
The most insightful time you'll spend today!
Can Your Data Warehouse Handle a 100-Trillion Row Query?
Today’s enterprise demands from data go far beyond the capabilities of traditional data warehousing and for many leaders, the need to digitally transform their businesses is a key driver for data analytics spending.
Businesses want to make real-time decisions from fresh information as well as make future predictions from their data in order to remain competitive.
In this video, Jordan Tigani, Director of Product Management, Google BigQuery reveals the power of Google Cloud’s modern data warehouse, BigQuery, that helps businesses make informed decisions quickly.
In addition, he talks about how big Google BigQuery can get. He shares examples of how one customer ran a query against a giant table of 100 trillion rows. “I think it was something like 19 petabytes of data scanned. It took about took about 20 minutes. It used 39,000 slots, which is about 20,000 cores,” says Tigani.
He also shares examples of how businesses, such as online retailer, Zulily generate real business benefits from being able to query large datasets faster, and more easily than ever–without having to invest time managing infrastructure.
Finally, Amir Aryanpour, Technical Architect, Channel 4, talks abouut how connecting connecting Google BigQuery to other solutions with the Google Cloud Platform, including storage, data visualisation, and a sentiment analysis engine, among others, helped the company.
BigQuery Omni: Your Solution for Multi-Cloud Geospatial Analytics

1507
Of your peers have already read this article.
6:30 Minutes
The most insightful time you'll spend today!
As we become increasingly reliant on technology to make decisions, geospatial data is becoming more critical than ever. It is a powerful resource that can be used to solve a variety of problems, from tracking the movement of goods, identifying interest areas and potential areas of disaster.
Geospatial data incorporates data with a geographic component, such as latitude and longitude coordinates, addresses, postal codes, or place names, and can be obtained from a variety of sources, including satellites, sensors, and surveys, making it an incredibly powerful tool with a broad range of applications.
One of the key features of BigQuery, Google Cloud’s serverless enterprise data warehouse, is its ability to analyze geospatial data. However, oftentimes geospatial data sits in a variety of public clouds, not just Google Cloud. To access it effectively, you need a multi-cloud analytics solution that lets you capitalize on the distinct capabilities of each cloud platform, while extracting insights and value from data sitting across multiple cloud platforms.
BigQuery Omni is a multi-cloud analytics solution that enables the analysis of data stored across public cloud environments, including Google Cloud, Amazon Web Services (AWS) and Microsoft Azure, without the need to transfer the data. With BigQuery Omni, users can employ the same SQL queries and tools used to analyze data in Google Cloud to analyze data in other clouds, making it easier to gain insights from all data, regardless of the storage location. For businesses using multiple clouds, BigQuery Omni is an excellent tool to unify analytics and optimize the value of data.
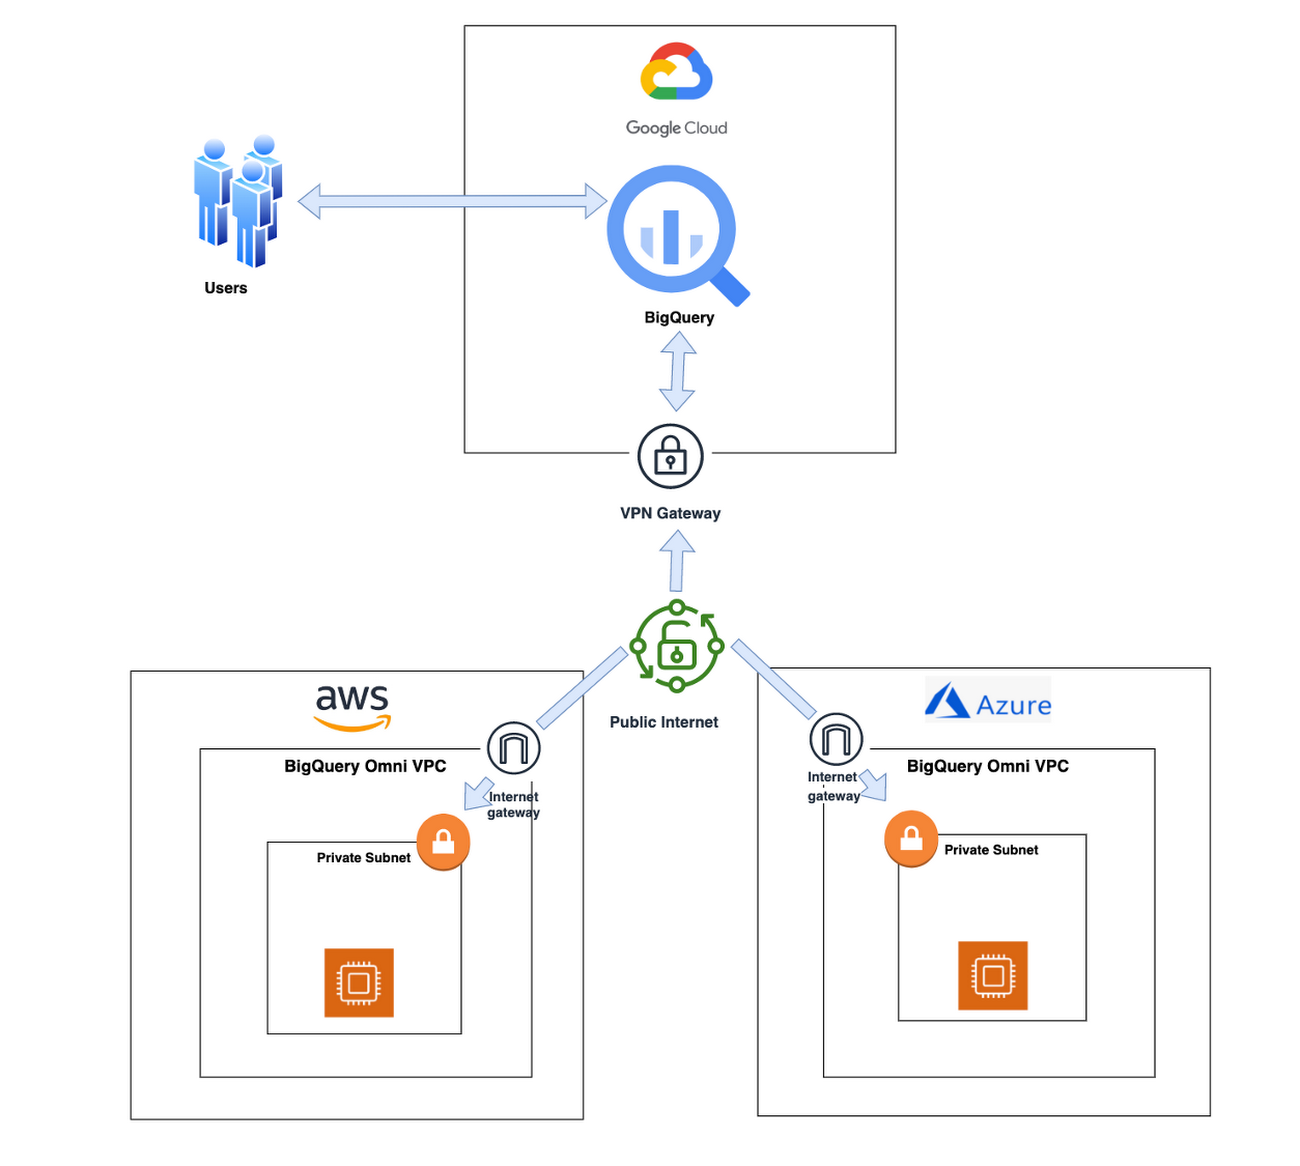
With BigQuery Omni, organizations can analyze location-based information or geographic components, such as latitude and longitude coordinates, addresses, postal codes, or place names without even copying their data to Google Cloud. For example, you could use BigQuery Omni to analyze data from a fleet of delivery vehicles to track their location and identify potential problems.
BigQuery Omni and geospatial data analysis
If you are working with geospatial data, BigQuery Omni is a powerful tool that can help you to get insights from your data. It is scalable, reliable, and secure, making it a great option for unifying your analytics and getting the most out of your data.
Here are a few examples of ways organizations might use BigQuery Omni for geospatial data:
- A transportation company could use BigQuery Omni to analyze data from GPS sensors in its vehicles to track the movement of its fleet and identify potential problems.
- A retail company could use BigQuery Omni to analyze data from its point-of-sale systems to track customer behavior and identify trends.
- A government agency could use BigQuery Omni to analyze data from its weather sensors to track the movement of storms and identify areas at risk of flooding.
BigQuery Omni and geospatial data can be used together to gain insights into a variety of business problems. Specifically, some of the advantages of using BigQuery Omni and geospatial data include:
- Access to quality geospatial data: BigQuery supports loading of newline-delimited GeoJSON files and provides built-in support for loading and querying geospatial data. Data from public data sources like BigQuery public datasets, the Earth Engine catalog, and the United States Geological Survey (USGS) can be easily integrated into your BigQuery environment. Earth Engine has an integrated data catalog with a comprehensive collection of analysis-ready datasets, including satellite imagery and climate data. This data can be combined with proprietary data sources such as SAP, Oracle, Esri ArcGIS Server, Carto, and QGIS.
- Loading and preprocessing of geospatial data: BigQuery has built-in support for loading and querying geospatial data types, and you can use partner solutions such as FME Spatial ETL to load data.
- Working with different geospatial data types and formats: BigQuery supports a variety of file types and formats including WKT, WKB, CSV and GeoJSON.
- Coordinate reference systems: BigQuery’s geography data type is globally consistent. That means that your data is registered to the WGS84 reference system and your analyses can span a city block or multiple continents.
Overall, geospatial analytics with BigQuery Omni provides a wide range of technical capabilities for processing and analyzing geospatial data, making it a powerful tool for businesses that need to work with location-based data.
Analyzing geospatial data with BigQuery Omni
Imagine a retailer who has a large chain of department stores with locations all over the country. They are looking to expand their business and want to identify areas with high sales potential. They want a way to get a better understanding of their sales volume within specific geographic boundaries. To achieve this goal, the retailer turns to the GIS (Geographic Information System) functions built into BigQuery. Here are the steps what the retailer takes to analyze this dataset:
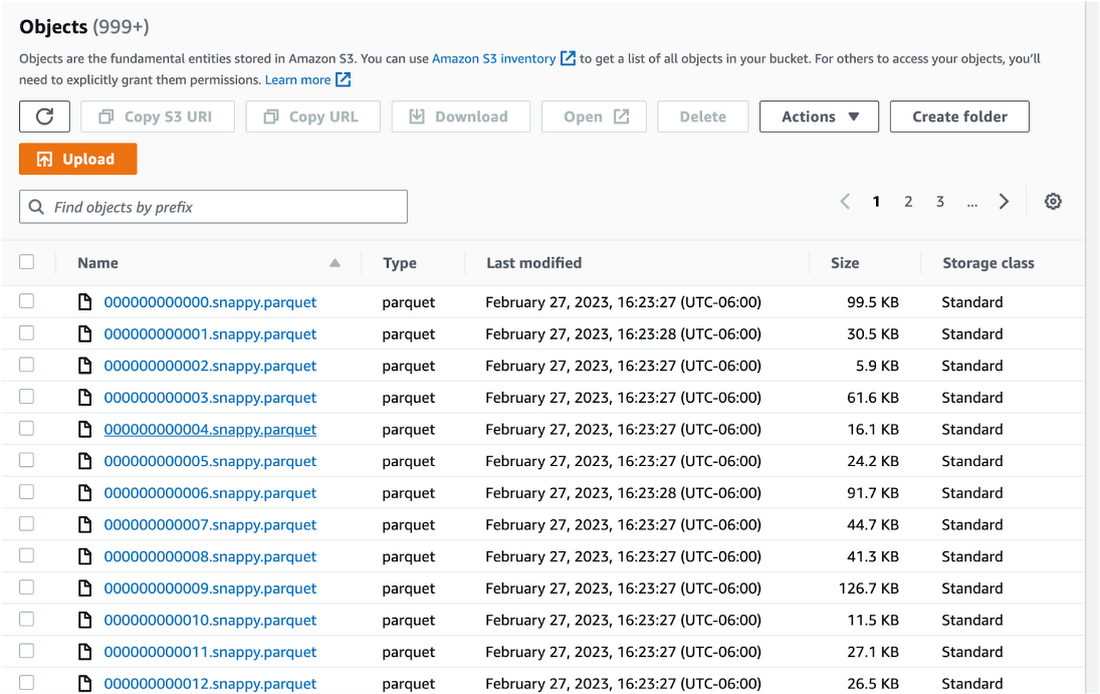
Step 1 : An initial orders dataset on AWS S3 contains 5.54 million rows, and with separate locations (300 rows) and zipcode (33144 rows) metadata files on AWS S3.
Orders Parquet files:
Location and Zipcode files:

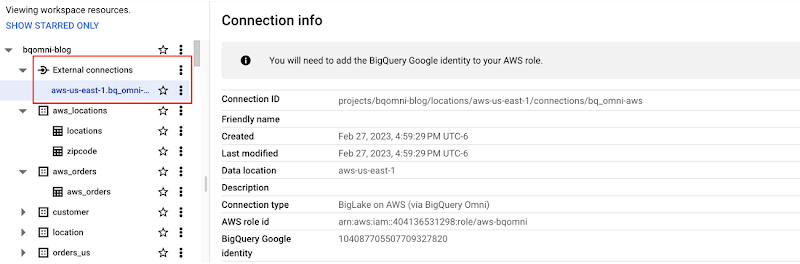
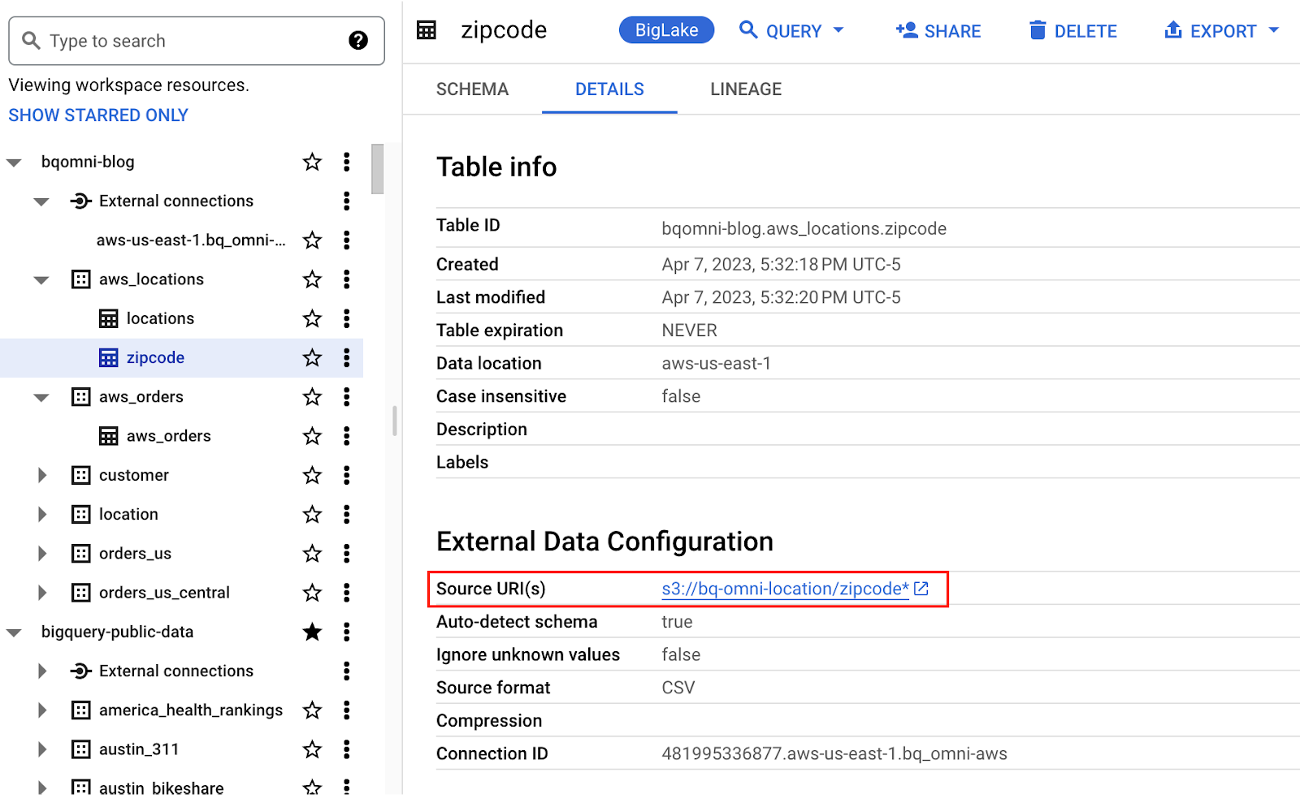
Step 2 : The retailer uses BigQuery Omni to establish a connection between the data stored in AWS and BigQuery, enabling them to access the S3 datasets externally.
External Connection for AWS
External Table for orders
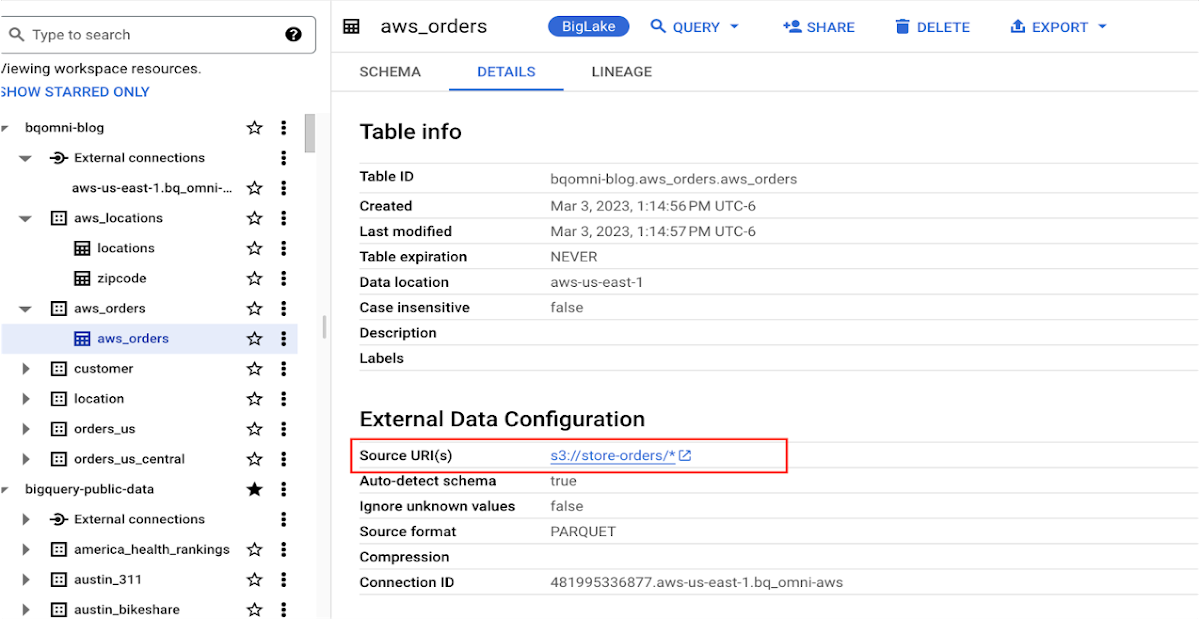
External Table for locations
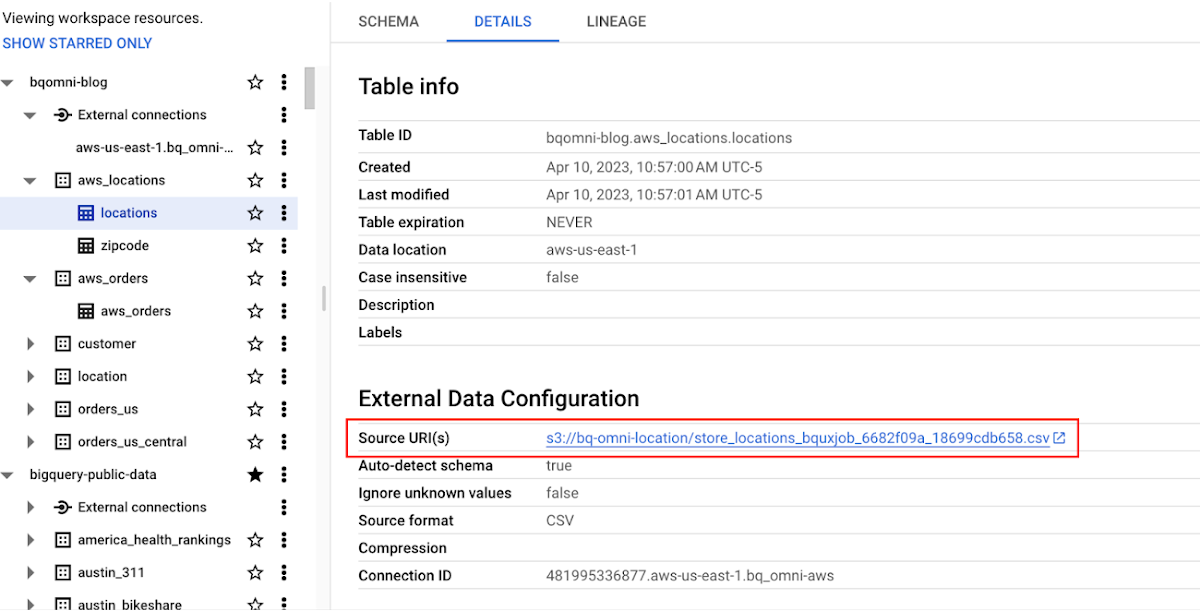
External Table for zipcode
Step 3 : They combine the orders and locations datasets using BigQuery Omni, and remotely aggregate the data on AWS. Joining this dataset with geospatial datasets helps them derive geospatial coordinates.
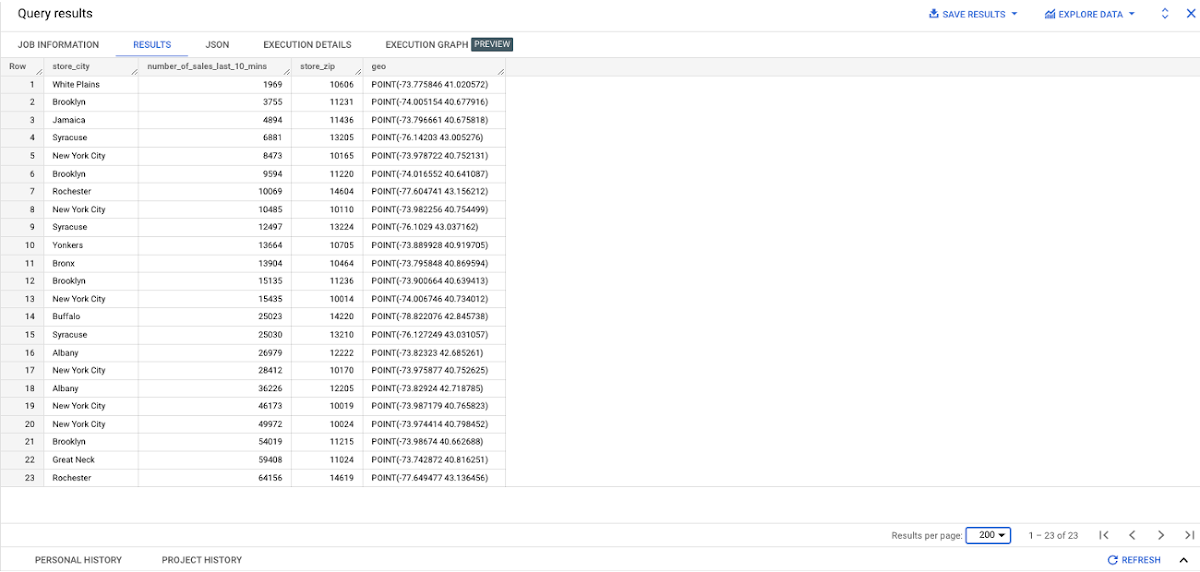
The final aggregated dataset is reduced to 23 rows. Subsequently, they bring back the result dataset, which contains just 23 rows. This helps them reduce the extraction of millions of rows to just 23 rows for their geospatial analytics.
Select sales.store_city store_city,
sales.number_of_sales_last_10_mins number_of_sales_last_10_mins,
sales.store_zip store_zip,
 ST_GeogPoint(zip_lat_lng.longitude ,
   zip_lat_lng.latitude  ) geo
FROM (
 SELECT
   FORMAT_DATETIME("%X",
     CURRENT_DATETIME("America/Los_Angeles")) current_time,
   MAX(DATETIME(time_of_sale,
       "America/Los_Angeles")) time_of_last_sale,
   COUNT(1) number_of_sales_last_10_mins,
   locations.city store_city,
   locations.zip store_zip
 FROM
   `bqomni-blog.aws_locations.orders_small`  sales
 JOIN
   `bqomni-blog.aws_locations.locations` locations
 ON
   sales.store_id = locations.id
 GROUP BY
   locations.city,
   locations.zip ) sales
JOIN
   `bqomni-blog.aws_locations.zipcode` zip_lat_lng
ON
 cast(sales.store_zip as INT) = cast(zip_lat_lng.zipcode as INT)
 WHERE ST_WITHIN( ST_GeogPoint(zip_lat_lng.longitude , zip_lat_lng.latitude  ) ,ST_GeogFromText(zip_lat_lng.zipcode_geom ) )
 AND zip_lat_lng.state_name  = "New York"
 ORDER BY number_of_sales_last_10_mins
Aggregated Sales data by region
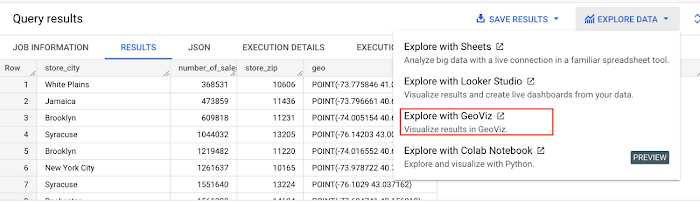
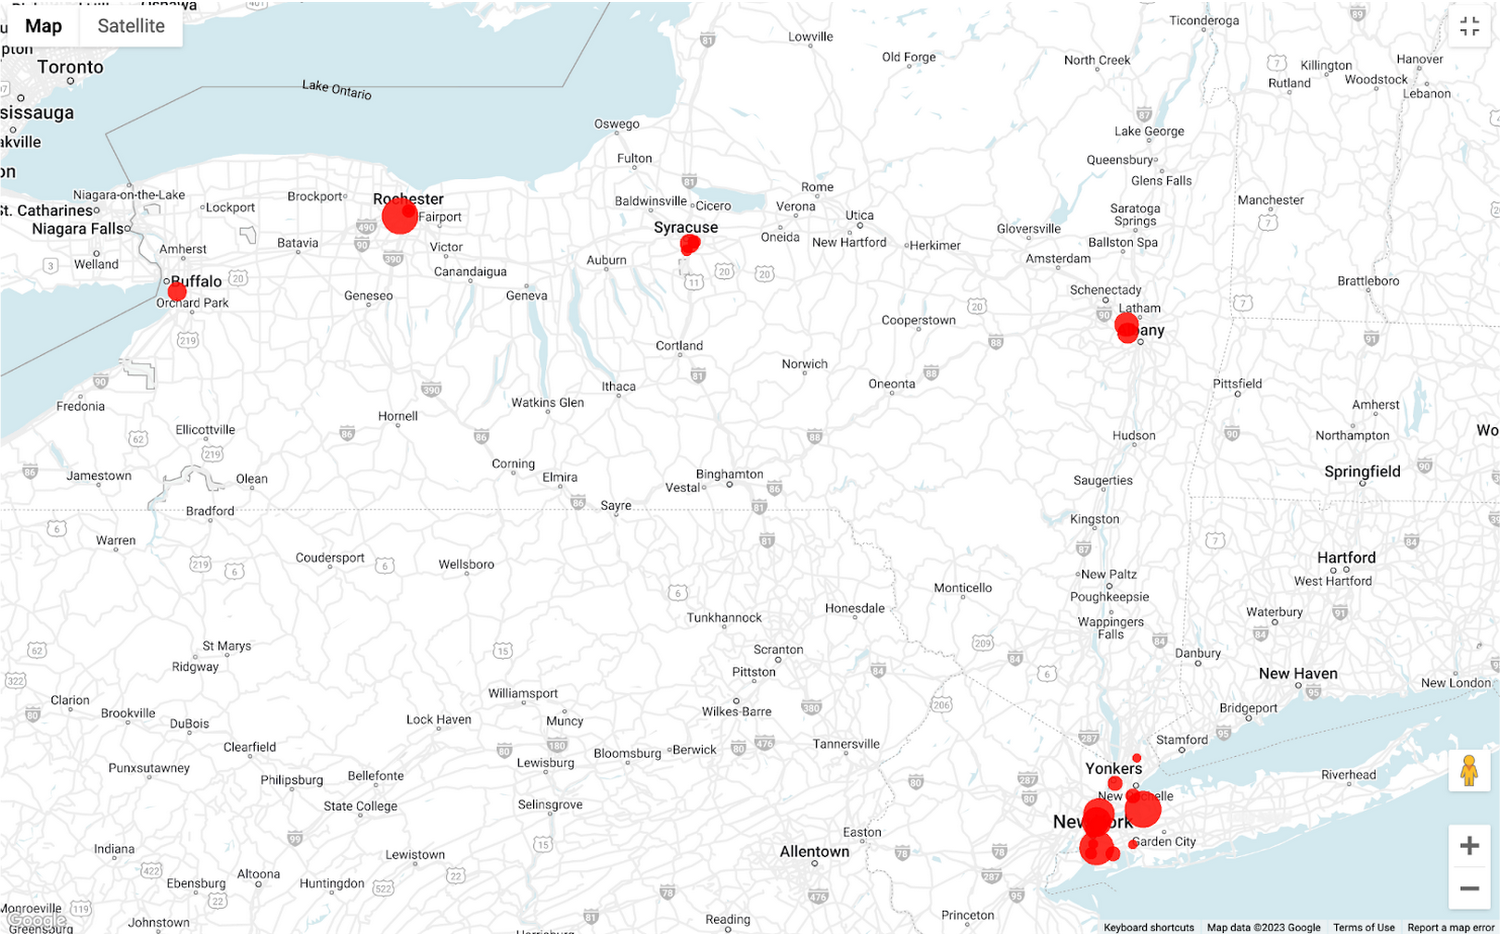
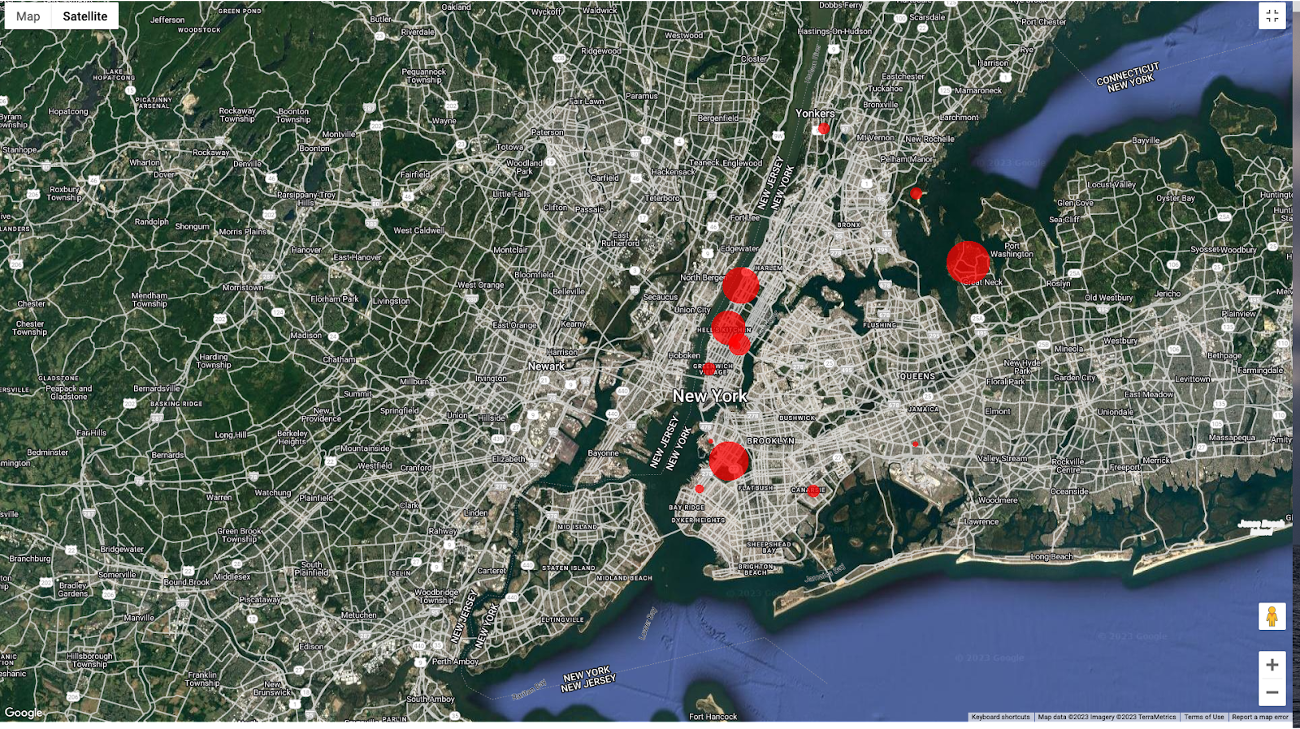
To build richer views of their sales volume data, the retailer uses BigQuery GeoViz integration, a powerful tool that allows for visualizing geographic data on maps.BigQuery Geo Viz is a web tool for visualization of geospatial data in BigQuery using Google Maps APIs. You can run a SQL query and display the results on an interactive map
BigQuery Geo view for sales data analysis
With the geo-tagged data in place, the retailer can now see regional sales volume, sales density, distribution by department by time, and distribution within department, all powered through BigQuery.
Satellite view
Benefits of using BigQuery Omni
Beyond geospatial analysis, BigQuery Omni offers a number of benefits, including:
Reduced costs: BigQuery Omni’s ability to eliminate data transfers between clouds can help organizations reduce costs and simplify data management, making it a valuable tool for multi-cloud analytics. Also, the ability to access and analyze data across multiple clouds can reduce the need for data replication and synchronization, which can further simplify the ETL process and improve data consistency.
Unified governance: BigQuery Omni uses the same security controls as BigQuery, which include features such as encryption, access controls, and audit logs, to help protect data from unauthorized access.
Single pane for analytics: BigQuery Omni provides a single interface for querying data across all three clouds, which can simplify the process of analyzing data and reduce the need for organizations to use multiple analytics tools.
Flexibility: Analyze data stored in any of the supported cloud storage services, giving organizations the flexibility to work with the data they have regardless of where it’s located.
BigQuery Omni is a valuable tool for geospatial analysis because it allows you to analyze data from multiple sources without having to move the data. This can save you time and money, and it can also help you to get more accurate insights from your data.If you are looking for a way to improve the accuracy, efficiency, and decision-making of your business, using BigQuery Omni to analyze geospatial data can be a powerful tool.
References
- Omni-introduction
- Omni-benefits
- Omni-aws-create-connection
- Omni-azure-create-connection
- BigQuery Omni Retail Demo on Looker
- Omni-pricing
- Working with Geospatial Data
- Geospatial Analytics – Intro
Learn more about how BigQuery Omni can help your organization.

3700
Of your peers have already downloaded this article
16:30 Minutes
The most insightful time you'll spend today!
Organizations today are being forced to make difficult decisions. Innovation has moved down the list for many companies, replaced with realities like making sure your business systems stay up and running during a disaster, managing unexpected shifts in demand,and above all, staying in business.
In the short term, this means looking for cost savings wherever possible, and making sure you’re up and running, no matter what circumstances come your way. In the longer term, it means identifying areas to reduce capital expenditures—including things like data center commitments, migration costs, and other overhead.
Google Cloud database solutions can help with both the short- and longer-term issues. Our solutions provide the opportunity to reduce the load that managing legacy applications is placing on your IT department and ensure you can manage unforeseen demand, all while making sure your databases are up and running, no matter what circumstances come your way.
In this whitepaper we’ll look in detail at some Google Cloud database solutions that can help you re-host, re-platform, or re-write your enterprise database with Google Cloud. You’ll see how we can help you plan for both the short- and long-term health of your Oracle workloads.
Vodafone Leverages Google Cloud to Aid COVID-19 Frontline with Anonymized Insights on Population Mobility

11219
Of your peers have already read this article.
1:30 Minutes
The most insightful time you'll spend today!
Editor’s note: When Europe’s largest mobile communications company, Vodafone, was asked by the European Commission to help understand population movement across the European Union and the UK to help fight COVID-19, it was able to provide anonymized mobile network-based insights to answer the call. Here’s how Vodafone, with the support of Google Cloud, rapidly mobilized the COVID-19 frontline, while respecting its customers’ privacy.
With the emergence of COVID-19 in early 2020, the European Commission—the executive branch of the European Union (EU)—knew that technology would be instrumental in its fight to control the pandemic. With various lockdowns imposed across its member states, the Commission was keen to predict and prevent the spread of COVID-19 and to manage the related social, political and financial impacts.
Mobile network data helps track COVID-19 across the EU
Mobile networks produce location data, which can be turned into useful anonymous insights to understand population movement within a geographic area. The European Commission, working with mobile industry association GSMA (Groupe Speciale Mobile Association), asked Europe’s major mobile phone operators for help in producing insights to support the fight against COVID-19. As the largest mobile network operator within the EU, Vodafone saw this as a critical opportunity to participate.
Vodafone had previous experience of using mobile network data to support pandemic research. For example, in 2019, Vodafone provided mobility pattern analysis to help track the spread of Malaria in Mozambique. And, during the early stages of the COVID-19 pandemic (prior to working with the European Commission), Vodafone assisted the Italian and Spanish governments in understanding their citizens’ mobility patterns. Vodafone had also previously offered anonymized and aggregated population mobility insights to support public transport and tourism authorities and retail organizations in a number of countries. Consequently, Vodafone was perfectly placed to play a greater role in supporting the European Commission’s response to the pandemic.
When asked to assist the European Commission, Vodafone first considered how it could safely share its data with the governing body without providing details on the individual movements of its customers. It realized it could achieve this through an elaborate set of anonymization and aggregation techniques. Insights are aggregated from a minimum of 50 users and Vodafone only shared these anonymous insights and never the actual raw data with the Commission. As specified by the EU, these insights are then presented onto a large geographical region, typically a city or a county with thousands of people living in that area.
These insights illustrate how people move, helping to determine how lockdowns and self-isolation measures were impacting behaviors.
Using Google Cloud to collate and store population mobility data
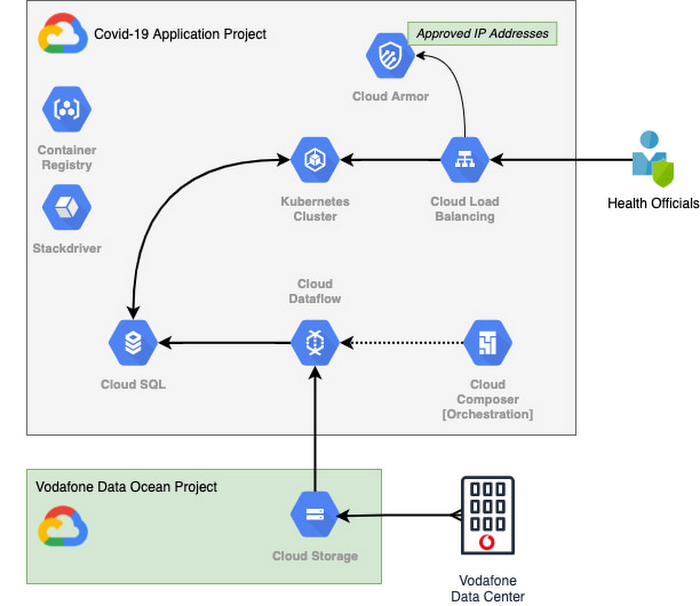
In April 2020, Vodafone began migrating its operations, including its mobile data, to Google Cloud on servers in Europe and the UK with elaborate security safeguards, including encryption, building on a previous partnership.
With the data residing in EU and UK data centers and not the United States, Vodafone could then retrieve anonymous insights from Google Cloud Storage instantaneously. Before supplying any information to the European Commission, however, Vodafone used Dataflow to validate the data and run a series of tests to ensure the database had accurate data, before ingesting and archiving the relevant metrics. For instant access, the data was then made available to the European Commission using a Redis database on Google Kubernetes Engine.
To ensure aggregate Vodafone customer data was always safe, secure, and anonymous, all entry points to the front-end were protected behind Google Cloud Armor, where only specific IP addresses were allowed. Using these tools, seamless data pipelines fed in predefined key performance indicators from each specified European market. While data quality measures ensured the definitions for metrics across markets were consistent and could be accurately compared.
The architecture (pictured below) shows how Vodafone integrated and anonymized its data on Google Cloud.
Live interactive dashboard shows population mobility in real-time
With its data integrated on Google Cloud, Vodafone created a live, interactive dashboard to track mobility patterns and share relevant information with the European Commission in real-time.
The European Commission Joint Research Center (JRC) was able to gather valuable information from these insights, which enabled them to see where population mobility was aiding the spread of the disease, when cross-referenced with health data. It could also assess the implications of lockdowns on different populations and forecast cross-country spreading.
Mobile data aids disease modeling for multiple stakeholders
The Vodafone data became instrumental in modeling the likely course of the disease too. For example, the University of Southampton in the UK used it to predict the outcome of different coordinated COVID-19 exit strategies across Europe. This research was published in Science Magazine in September 2020.
The Vodafone data dashboard continues to be used by individual governments, NGOs and organizations to further investigate the impacts of the pandemic and to measure the effectiveness of response strategies alongside the rollout of vaccination programs. The project also helped Vodafone win a DataIQ award for most effective stakeholder engagement.
Using the learnings from this project, Vodafone has been able to adapt its own B2B solution, called Vodafone Analytics, by adaptIng and migrating the code to work in Google Cloud Platform. This solution has been rolled out across Germany, Greece, Portugal and South Africa, and new countries are being onboarded every day. Vodafone Analytics already has more than 100 customers leveraging it for a variety of use cases—Italian fashion retailer OVS, uses it for its smart retail operation, while global real estate company, JLL, uses it to understand the footfall passing through its properties.
Working together, Vodafone and Google Cloud continue to help a range of organizations, governments, and NGOs navigate through the ongoing pandemic, optimize their operations, and help the greater good, without infringing individuals’ fundamental rights to privacy.
To learn more about Google Cloud and Vodafone, watch our full interview here.
Enhancing Data Governance through Automation with Dataplex and BigLake

3000
Of your peers have already read this article.
2:00 Minutes
The most insightful time you'll spend today!
Unlocking the full potential of data requires breaking down the silo between open-source data formats and data warehouses. At the same time, it is critical to enable data governance team to apply policies regardless of where the data happens, whether – on file or columnar storage.
Today, data governance teams have to become subject matter experts on each storage system the corporate data happens to reside on. Since February 2022, Dataplex has offered a unified place to apply policies, which are propagated across both lake storage and data warehouses in GCP. Rather than specifying policies in multiple places, bearing the cognitive load of translating policies from “what you want the storage system to do” to “how your data should behave” Dataplex offers a single point for unambiguous policy management. Now, we are making it easier for you to use BigLake.
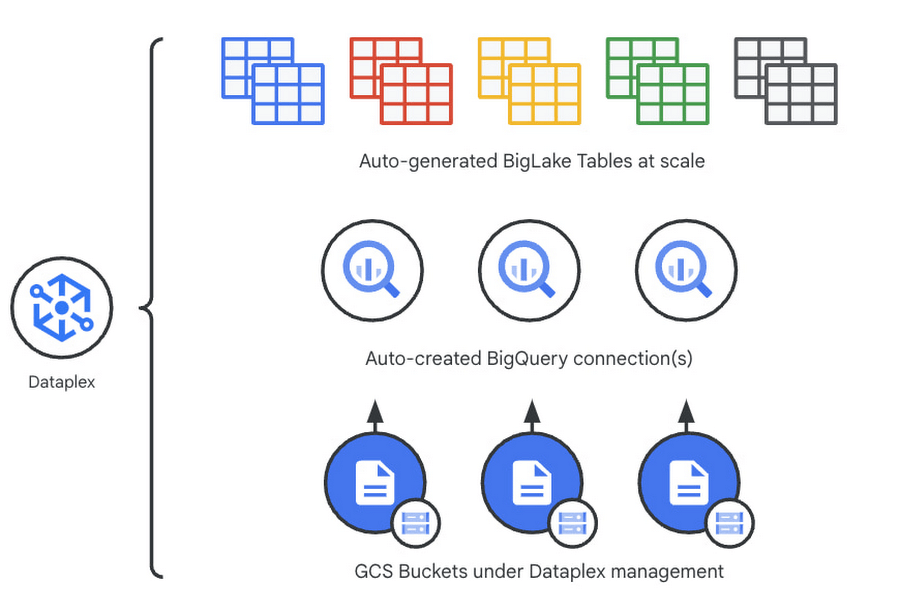
Earlier this year, we launched BigLake into general availability, BigLake unifies data fabric between Data Lakes and Data Warehouses by extending BigQuery storage to open file formats. Today, we announce BigLake Integration with Dataplex (available in preview). This integration eliminates the configuration steps for the admin taking advantage of BigLake and managing policies across GCS and BigQuery from a unified console.
Previously, you could point Dataplex at a Google Cloud Storage (GCS) bucket, and Dataplex will discover and extract all metadata from the data lake and register this metadata in BigQuery (and Dataproc Metastore, Data Catalog) for analysis and search. With the BigLake integration capability, we are building on this capability by allowing an “upgrade” of a bucket asset, and instead of just creating external tables in BigQuery for analysis – Dataplex will create policy-capable BigLake tables!
The immediate implication is that admins can now assign column, row, and table policies to the BigLake tables auto-created by Dataplex, as with BigLake – the infrastructure (GCS) layer is separate from the analysis layer (BigQuery). Dataplex will handle the creation of a BigQuery connection and a BigQuery publishing dataset and ensure the BigQuery service account has the correct permissions on the bucket.
But wait – there’s more.
With this release of Dataplex, we are also introducing advanced logging called governance logs. Governance logs allow tracking the exact state of policy propagation to tables and columns – adding an additional level of detail going beyond the high-level “status” for the bucket and into fine-grained status and logs for tables, columns.
What’s next?
- We have updated our documentation for managing buckets and have additional detail regarding policy propagation and the upgrade process.
- Stay tuned for an exciting roadmap ahead, with more automation around policy management.
For more information, please visit:
More Relevant Stories for Your Company

Accelerate Innovation with Google Cloud’s Managed Database Services
Google Cloud’s managed database services can help you innovate faster and reduce operational overhead. The migration tools and resources included in this whitepaper will help you plan your migration. This whitepaper provides guidance on: Managing services for maximum compatibility with your workloads Leveraging services that are compatible with the most

Google Cloud Announces General Availability of BigQuery Row-level Security
Data security is an ongoing concern for anyone managing a data warehouse. Organizations need to control access to data, down to the granular level, for secure access to data both internally and externally. With the complexity of data platforms increasing day by day, it's become even more critical to identify

Recommendations for Modelling SAP Data inside BigQuery
Over the past few years, many organizations have experienced the benefits of migrating their SAP solutions to Google Cloud. But this migration can do more than reduce IT maintenance costs and make data more secure. By leveraging BigQuery, SAP customers can complement their SAP investments and gain fresh insights by consolidating enterprise

BigQuery Explainable AI for Demystifying the Inner Workings of ML Models. Now GA!
Explainable AI (XAI) helps you understand and interpret how your machine learning models make decisions. We're excited to announce that BigQuery Explainable AI is now generally available (GA). BigQuery is the data warehouse that supports explainable AI in a most comprehensive way w.r.t both XAI methodology and model types. It does this at
