





BigQuery Explainable AI for Demystifying the Inner Workings of ML Models. Now GA!

6556
Of your peers have already read this article.
2:00 Minutes
The most insightful time you'll spend today!
Explainable AI (XAI) helps you understand and interpret how your machine learning models make decisions. We’re excited to announce that BigQuery Explainable AI is now generally available (GA). BigQuery is the data warehouse that supports explainable AI in a most comprehensive way w.r.t both XAI methodology and model types. It does this at BigQuery scale, enabling millions of explanations within seconds with a single SQL query.
Why is Explainable AI so important? To demystify the inner workings of machine learning models, Explainable AI is quickly becoming an essential and growing need for businesses as they continue to invest in AI and ML. With 76% of enterprises now prioritizing artificial intelligence (AI) and machine learning (ML) over other initiatives in 2021 IT budgets, the majority of CEOs (82%) believe that AI-based decisions must be explainable to be trusted according to a PwC survey.
While the focus of this blogpost is on BigQuery Explainable AI, Google Cloud provides a variety of tools and frameworks to help you interpret models outside of BigQuery, such as with Vertex Explainable AI, which includes AutoML Tables, AutoML Vision, and custom-trained models.
So how does Explainable AI in BigQuery work exactly? And how might you use it in practice?
Two types of Explainable AI: global and local explainability
When it comes to Explainable AI, the first thing to note is that there are two main types of explainability as they relate to the features used to train the ML model: global explainability and local explainability.
Imagine that you have a ML model that predicts housing price (as a dollar amount), based on three features: (1) number of bedrooms, (2) distance to the nearest city center, and (3) construction date.
Global explainability (a.k.a. global feature importance) describes the features’ overall influence on the model and helps you understand if a feature had a greater influence than other features over the model’s predictions. For example, global explainability can reveal that the number of bedrooms and distance to city center typically has a much stronger influence than the construction date on predicting housing prices. Global explainability is especially useful if you have hundreds or thousands of features and you want to determine which features are the most important contributors to your model. You may also consider using global explainability as a way to identify and prune less important features to improve the generalizability of their models.
Local explainability (a.k.a. feature attributions) describes the breakdown of how each feature contributes towards a specific prediction. For example, if the model predicts that house ID#1001 has a predicted price of $230,000, local explainability would describe a baseline amount (e.g. $50,000) and how each of the features contributes on top of the baseline towards the predicted price. For example, the model may say that on top of the baseline of $50,000, having 3 bedrooms contributed an additional $50,000, close proximity to the city center added $100,000, and construction date of 2010 added $30,000, for a total predicted price of $230,000. In essence, understanding the exact contribution of each feature used by the model to make each prediction is the main purpose of local explainability.
What ML models does BigQuery Explainable AI apply to?
BigQuery Explainable AI applies to a variety of models, including supervised learning models for IID data and time series models. The documentation for BigQuery Explainable AI provides an overview of the different ways of applying explainability per model. Note that each explainability method has its own way of calculation (e.g. Shapley values), which are covered more in-depth in the documentation.

Examples with BigQuery Explainable AI
In this next section, we will show three examples of how to use BigQuery Explainable AI in different ML applications:
Regression models with BigQuery Explainable AI
Let’s use a boosted tree regression model to predict how much a taxi cab driver will receive in tips for a taxi ride, based on features such as number of passengers, payment type, total payment and trip distance. Then let’s use BigQuery Explainable AI to help us understand how the model made the predictions in terms of global explainability (which features were most important?) and local explainability (how did the model arrive at each prediction?).
The taxi trips dataset comes from the BigQuery public datasets and is publicly available in the table: bigquery-public-data.new_york_taxi_trips.tlc_yellow_trips_2018.
First, you can train a boosted tree regression model.
CREATE OR REPLACE MODEL bqml_tutorial.taxi_tip_regression_modelOPTIONS (model_type='boosted_tree_regressor',input_label_cols=['tip_amount'],max_iterations = 50,tree_method = 'HIST',subsample = 0.85,enable_global_explain = TRUE) ASSELECTvendor_id,passenger_count,trip_distance,rate_code,payment_type,total_amount,tip_amountFROM`bigquery-public-data.new_york_taxi_trips.tlc_yellow_trips_2018`WHERE tip_amount >= 0LIMIT 1000000
Now let’s do a prediction using ML.PREDICT, which is the standard way in BigQuery ML to make predictions without explainability.
SELECT *FROMML.PREDICT(MODEL bqml_tutorial.taxi_tip_regression_model,(SELECT"0" AS vendor_id,1 AS passenger_count,CAST(5.85 AS NUMERIC) AS trip_distance,"0" AS rate_code,"0" AS payment_type,CAST(55.56 AS NUMERIC) AS total_amount))

But you might wonder—how did the model generate this prediction of ~11.077?
BigQuery Explainable AI can help us answer this question. Instead of using ML.PREDICT, you use ML.EXPLAIN_PREDICT with an additional optional parameter top_k_features. ML.EXPLAIN_PREDICT extends the capabilities of ML.PREDICT by outputting several additional columns that explain how each feature contributes to the predicted value. In fact, since ML.EXPLAIN_PREDICT includes all the output from ML.PREDICT anyway, you may want to consider using ML.EXPLAIN_PREDICT every time instead.
SELECT *FROMML.EXPLAIN_PREDICT(MODEL bqml_tutorial.taxi_tip_regression_model,(SELECT"0" AS vendor_id,1 AS passenger_count,CAST(5.85 AS NUMERIC) AS trip_distance,"0" AS rate_code,"0" AS payment_type,CAST(55.56 AS NUMERIC) AS total_amount),STRUCT(6 AS top_k_features))

The way to interpret these columns is:
Σfeature_attributions + baseline_prediction_value = prediction_value
Let’s break this down. The prediction_value is ~11.077, which is simply the predicted_tip_amount. The baseline_prediction_value is ~6.184, which is the tip amount for an average instance. top_feature_attributions indicates how much each of the features contributes towards the prediction value. For example, total_amount contributes ~2.540 to the predicted_tip_amount.
ML.EXPLAIN_PREDICT provides local feature explainability for regression models. For global feature importance, see the documentation for ML.GLOBAL_EXPLAIN.
Classification models with BigQuery Explainable AI
Let’s use a logistic regression model to show you an example of BigQuery Explainable AI with classification models. We can use the same public dataset as before: bigquery-public-data.new_york_taxi_trips.tlc_yellow_trips_2018.
Train a logistic regression model to predict the bracket of the percentage of the tip amount out of the taxi bill.
CREATE OR REPLACE MODEL bqml_tutorial.taxi_tip_classification_modelOPTIONS(model_type='logistic_reg',input_label_cols=['tip_bucket'],enable_global_explain=true) ASSELECTvendor_id,passenger_count,trip_distance,rate_code,payment_type,total_amount,CASEWHEN tip_amount > total_amount*0.20 THEN '20% or more'WHEN tip_amount > total_amount*0.15 THEN '15% to 20%'WHEN tip_amount > total_amount*0.10 THEN '10% to 15%'ELSE '10% or less'END AS tip_bucketFROM`bigquery-public-data.new_york_taxi_trips.tlc_yellow_trips_2018`WHERE tip_amount >= 0LIMIT 1000000
Next, you can run ML.EXPLAIN_PREDICT to get both the classification results and the additional information for local feature explainability. For global explainability, you can use ML.GLOBAL_EXPLAIN. Again, since ML.EXPLAIN_PREDICT includes all the output from ML.PREDICT anyway, you may want to consider using ML.EXPLAIN_PREDICT every time instead.
SELECT *FROMML.EXPLAIN_PREDICT(MODEL bqml_tutorial.taxi_tip_classification_model,(SELECT"0" AS vendor_id,1 AS passenger_count,CAST(5.85 AS NUMERIC) AS trip_distance,"0" AS rate_code,"0" AS payment_type,CAST(55.56 AS NUMERIC) AS total_amount),STRUCT(6 AS top_k_features))

Similar to the regression example earlier, the formula is used to derive the prediction_value:
Σfeature_attributions + baseline_prediction_value = prediction_value
As you can see in the screenshot above, the baseline_prediction_value is ~0.296. total_amount is the most important feature in making this specific prediction, contributing ~0.067 to the prediction_value, though followed by trip_distance. The feature passenger_count contributes negatively to prediction_value by -0.0015. The features vendor_id, rate_code, and payment_type did not seem to contribute much to the prediction_value.
You may wonder why the prediction_value of ~0.389 doesn’t equal the probability value of ~0.359. The reason is that unlike for regression models, for classification models, prediction_value is not a probability score. Instead, prediction_value is the logit value (i.e., log-odds) for the predicted class, which you could separately convert to probabilities by applying the softmax transformation to the logit values. For example, a three-class classification has a log-odds output of [2.446, -2.021, -2.190]. After applying the softmax transformation, the probability of these class predictions is [0.9905, 0.0056, 0.0038].
Time-series forecasting models with BigQuery Explainable AI

Explainable AI for forecasting provides more interpretability into how the forecasting model came to its predictions. Let’s go through an example of forecasting the number of bike trips in NYC using the new_york.citibike_trips public data in BigQuery.
You can train a time-series model ARIMA_PLUS:
CREATE OR REPLACE MODEL bqml_tutorial.nyc_citibike_arima_modelOPTIONS(model_type = 'ARIMA_PLUS',time_series_timestamp_col = 'date',time_series_data_col = 'num_trips',holiday_region = 'US') ASSELECTEXTRACT(DATE from starttime) AS date,COUNT(*) AS num_tripsFROM`bigquery-public-data.new_york.citibike_trips`GROUP BY dateNext, you can first try forecasting without explainability using ML.FORECAST:SELECT*FROMML.FORECAST(MODEL bqml_tutorial.nyc_citibike_arima_model,STRUCT(365 AS horizon, 0.9 AS confidence_level))
This function outputs the forecasted values and the prediction interval. Plotting it in addition to the input time series gives the following figure.

But how does the forecasting model arrive at its predictions? Explainability is especially important if the model ever generates unexpected results.
With ML.EXPLAIN_FORECAST, BigQuery Explainable AI provides extra transparency into the seasonality, trend, holiday effects, level (step) changes, and spikes and dips outlier removal. In fact, since ML.EXPLAIN_FORECAST includes all the output from ML.FORECAST anyway, you may want to consider using ML.EXPLAIN_FORECAST every time instead.
SELECT*FROMML.EXPLAIN_FORECAST(MODEL bqml_tutorial.nyc_citibike_arima_model,STRUCT(365 AS horizon, 0.9 AS confidence_level))

Compared to the previous figure which only shows the forecasting results, this figure shows much richer information to explain how the forecast is made.
First, it shows how the input time series is adjusted by removing the spikes and dips anomalies, and by compensating the level changes. That is:
time_series_adjusted_data = time_series_data - spikes_and_dips - step_changes
Second, it shows how the adjusted input time series is decomposed into different components such as both weekly and yearly seasonal components, holiday effect component and trend component. That is
time_series_adjusted_data = trend + seasonal_period_yearly + seasonal_period_weekly + holiday_effect + residual
Finally, it shows how these components are forecasted separately to compose the final forecasting results. That is:
time_series_data = trend + seasonal_period_yearly + seasonal_period_weekly + holiday_effect
For more information on these time series components, please see the documentation here.
Conclusion
With the GA of BigQuery Explainable AI, we hope you will now be able to interpret your machine learning models with ease.
Thanks to the BigQuery ML team, especially Lisa Yin, Jiashang Liu, Amir Hormati, Mingge Deng, Jerry Ye and Abhinav Khushraj. Also thanks to the Vertex Explainable AI team, especially David Pitman and Besim Avci.
What Differences in Functionalities Can I Expect Between Google Cloud’s SQL Database and Standard MySQL?

3965
Of your peers have already read this article.
5:30 Minutes
The most insightful time you'll spend today!
In general, the MySQL functionality provided by a Google Cloud’s SQL Database (Cloud SQL) instance is the same as the functionality provided by a locally-hosted MySQL instance.
However, there are a few differences between a standard MySQL instance and a Cloud SQL for MySQL instance.
Unsupported Features
Unsupported Statements
Sending any of the following types of SQL statements will generate an error with the message “Error 1290: The MySQL server is running with the google option so it cannot execute this statement”:
- LOAD DATA INFILE
- Note that LOAD DATA LOCALINFILE is supported.
- SELECT … INTO OUTFILE
- SELECT … INTO DUMPFILE
- INSTALL PLUGIN …
- UNINSTALL PLUGIN
- CREATE FUNCTION … SONAME …
Unsupported Statements for Second Generation Instances
The following statements are not supported because Second Generation instances use GTID replication:
- CREATE TABLE … SELECT statements
- CREATE TEMPORARY TABLE statements inside transactions
- Transactions or statements that update both transactional and nontransactional tables
For more information, see the MySQL documentation.
Unsupported Functions
- LOAD_FILE()
Unsupported Client Program Features
- mysqlimport without using the –local option. This is because of the LOAD DATA INFILE restriction. If you need to load data remotely, use the Cloud SQL import function.
- mysqldump using the –tab option or options that are used with –tab. This is because the FILE privilege is not granted for instance users. All other mysqldump options are supported.
- If you want to import databases with binary data into your Cloud SQL for MySQL instance, you must use the –hex-blob option with mysqldump.
- Although hex-blob is not a required flag when you are using a local MySQL server instance and the mysql client, it is required if you want to import any databases with binary data into your Cloud SQL instance. For more information about importing data, see Importing Data.
- Not all MySQL options and parameters are enabled for editing as Cloud SQL flags.
- To request the addition of a configurable Cloud SQL flag, use the Cloud SQL Discussion group.
- For Second Generation instances, InnoDB is the only supported storage engine. For help with converting tables from MyISAM to InnoDB, see the MySQL documentation.
- You cannot import or export triggers, functions, stored procedures, or views into Cloud SQL. However, you can create and use these elements on a Cloud SQL instance.
Notable MySQL Options
Cloud SQL runs MySQL with a specific set of options. If an option might impact how your applications work, we note it here for your information.
skip-name-resolve
This flag impacts how hostnames are resolved for client connections. Learn more.
Cloud SQL for PostgreSQL
Features
- Fully managed PostgreSQL databases in the cloud, based on the Cloud SQL Second Generation platform.
- Custom machine types with up to 416 GB of RAM and 64 CPUs.
- Up to 10TB of storage available, with the ability to automatically increase storage size as needed.
- Create and manage instances in the Google Cloud Platform Console.
- Instances available in US, EU, or Asia.
- Customer data encrypted on Google’s internal networks and in database tables, temporary files, and backups.
- Support for secure external connections with the Cloud SQL Proxy or with the SSL/TLS protocol.
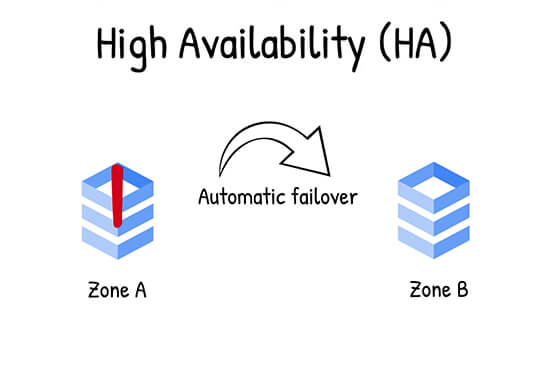
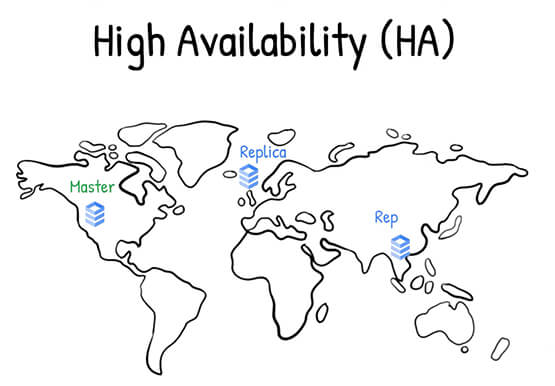
- Data replication between multiple zones with automatic failover.
- Import and export databases using SQL dump files.
- Support for PostgreSQL client-server protocol and standard PostgreSQL connectors.
- Automated and on-demand backups.
- Instance cloning.
- Integration with Stackdriver logging and monitoring.
Some features are not yet available for Cloud SQL for PostgreSQL:
- Point-in-time recovery (PITR)
- Import/export in CSV format using GCP Console or the gcloud command-line tool.
Supported Extensions
Cloud SQL for PostgreSQL supports many PostgreSQL extensions. For a complete list, see PostgreSQL Extensions.
Supported Procedural Languages
Cloud SQL for PostgreSQL supports the PL/pgSQL SQL procedural language.
Supported Languages
You can use Cloud SQL for PostgreSQL with App Engine applications running in the flexible environment that are written in Java, Python, PHP, Node.js, Go, and Ruby. You can also use Cloud SQL for PostgreSQL with external applications using the standard PostgreSQL client-server protocol.
Differences between Cloud SQL and standard PostgreSQL functionality
In general, the PostgreSQL functionality provided by a Cloud SQL instance is the same as the functionality provided by a locally-hosted PostgreSQL instance. However, there are a few differences between a standard PostgreSQL instance and a Cloud SQL for PostgreSQL instance.
Unsupported Features
- Any features that require SUPERUSER privileges. An exception to this rule is made for the CREATE EXTENSION statement, but only for supported extensions.
- Custom background workers
- The psql client in Cloud Shell does not support operations that require a reconnection, such as connecting to a different database using the \c command.
Notable Differences
There are a number of PostgreSQL options and parameters that are not enabled for editing as Cloud SQL flags.
To request the addition of a configurable Cloud SQL flag, use the Cloud SQL Discussion group.
Maximizing Storage Efficiency: A Guide to Reducing Point-in-Time Recovery Impact

1459
Of your peers have already read this article.
1:30 Minutes
The most insightful time you'll spend today!
Point-In-Time Recovery (PITR) is a critical capability for enterprise applications. It allows database administrators to recover from accidental data deletion by restoring their production databases to a time before the incident.
Cloud SQL for PostgreSQL launched support for PITR in July 2020, allowing you to recover from disasters like data corruption or accidental deletion by restoring your Cloud SQL instance to a previous time. We’re excited to announce an additional enhancement to PITR for Cloud SQL for PostgreSQL that makes enabling PITR an even easier decision: for instances with Point-in-Time Recovery newly-enabled, the write-ahead logs being stored for PITR operations (which are the transaction logs that are used to go back in time) will no longer consume disk storage space. Instead, when you enable PITR for new instances, Cloud SQL will store transaction logs collected during the retention window in Google Cloud Storage, and retrieve them when you perform a restore. Because transaction logs can grow rapidly when your database experiences a burst of activity, this move will help reduce the impact these bursts have on your provisioned disk storage. These logs will be stored for up to seven days in the same Google Cloud region as your instance at no additional cost to you.
PITR is enabled by default when you create a new Cloud SQL for PostgreSQL instance from the Google Cloud console, and transaction logs will no longer be stored on the instance for instances that have PITR newly enabled. If you have already enabled PITR on your PostgreSQL instances, this enhancement will be rolled out to your instances at a later point. If you want to take advantage of this change sooner, you can first disable and then re-enable PITR on your instance (which will reset your ability to perform a point-in-time restore to the time at which PITR was re-enabled). On instances with this feature enabled, you’ll notice that consumed storage on your instance will reduce relative to the volume of write-ahead logs (WAL) generated by your instance. The actual amount of storage your logs consume will vary by instance and by database activity – during busy times for your database, log size may shrink or grow. However, these logs will now only be stored on your instance long enough to successfully replicate to any replicas of the instance and to ensure that they are safely written to Cloud Storage; afterwards, they will be removed from your instance.
We’re excited to continue to enhance Cloud SQL for PostgreSQL to ensure that disaster recovery is easy to enable, cost effective, and seamless to use. Learn more about this change in our documentation.
Architecting Data Pipelines Directly Improves Customer Experience at Universe.com

6095
Of your peers have already read this article.
3:30 Minutes
The most insightful time you'll spend today!
At Universe, we serve customers day and night and are always working to make sure they have a great experience, whether online or at one of our live events.
Our technology has to make that possible, and our legacy systems weren’t cutting it anymore. What we needed was a consistent, reliable infrastructure that would help our internal teams provide a fast and innovative ticket-buying experience to customers.
With our data well-managed, we could free up time for our developers to bring new web features to customers, like tailored add-ons at checkout.
Our team of about 20 software engineers needed more flexibility and agility in our infrastructure; we were using various data processing tools, and it wasn’t easy to share data across teams so that everyone saw the same information.
We also needed to incorporate streaming data into the data warehouse to ensure the consistency and integrity of data that’s read in a particular window of time from multiple sources. Our developer teams needed to be able to ship new features faster, and the data back ends were getting in the way.
In addition, when GDPR regulations went into effect, we needed to make sure all our data was anonymized, and we couldn’t do that with our legacy tools.
Finding the right data tools for the job
To make sure our customers were getting a top-notch online experience, we had to make the right technology choices.
Our first step was to centralize multiple data sources and create a single data warehouse that could serve as the foundation for all of our reporting requirements, both internal and external.
The new technology infrastructure we built had to let us move and analyze data easily, so our teams could focus on using that data and insights to better serve our customers.
Previously, we had lots of siloed systems and applications running in AWS. We did a trial using Redshift, but we needed more flexibility than it offered in how we loaded historical data into our cloud data warehouse. Though we were using MongoDB Atlas for our transactional database, it was important to continue using SQL for querying data.
The trial task that really sold us on BigQuery was when we wanted to alter a small table that had about 20 million rows, used for internal reporting.
We needed to add a value, but our PostgreSQL system wouldn’t allow it. Using Apache Beam, we set up a simple pipeline that moved data from the original source into BigQuery to see if we could add the column there.
BigQuery ingested the data and let us add the new value in seconds. That was a significant moment that led us to start looking at how we could build end-to-end solutions on Google Cloud. BigQuery gave us multiple options to load our historical data in batches and build powerful pipelines.
We also explored Google Cloud’s migration tools and data pipeline options. Once we saw how Cloud Dataflow worked, with its Apache Beam back-end, we never looked back. Google Cloud provided us with the data tools we needed to build our data infrastructure.
Cloud for data, and for users
Introducing new technologies isn’t always simple—companies sometimes avoid it altogether because it’s so hard. But our Google Cloud onboarding process has been easy.
It took us less than two months to fully deploy our BigQuery data warehouse using the Cloud Dataflow-Apache Beam combination.
Moving to Google Cloud brought us a lot of technology advantages, but it’s also been hugely helpful for our internal users and customers. The data analytics capabilities that we’re now able to offer users has really impressed our internal teams, including developers and DevOps, even those who haven’t used this type of technology before.
Some internal clients are already entirely self-service. We’ve hosted frequent demos, and also hosted some “hack days,” where we share knowledge with our internal teams to show them what’s possible.
We quickly found that BigQuery helped us solve scale and speed problems.
One of our main pain points had been adding upsell opportunities for customers during the checkout process. The legacy technology hadn’t allowed us to quickly reflect those changes in the data warehouse. With BigQuery, we’re able to do that, and devote fewer resources to making it happen. We’ve also eliminated the time we were spending tuning memory and availability, since BigQuery handles that. Database administration and tuning required specialized knowledge and experience and took up time. With BigQuery, we don’t have to worry about configuring that hardware and software. It just works.
We’ve also eliminated the time we were spending tuning memory and availability, since BigQuery handles that. Database administration and tuning required specialized knowledge and experience and took up time. With BigQuery, we don’t have to worry about configuring that hardware and software. It just works.
Two features in particular that we implemented using BigQuery have helped us improve the performance of our core transactional database. First, using Cloud Dataflow to convert raw MongoDB logs to structured rows under a BigQuery table, which we can then query using SQL to identify slow or underperforming queries. Second, we can now query multiple logging tables using wildcards, since we load Fastly logs to BigQuery.
Along with MongoDB Atlas as our main transactional database, much of our infrastructure now runs as Google Cloud microservices using Google Kubernetes Engine (GKE), including the home page and our payment system. Kubernetes cron jobs power background scheduled jobs, and we also use Cloud Pub/Sub. Cloud Storage handles any data storage if any space constraints emerge.
Our overall performance has increased by about 10x with BigQuery. Both our customers and internal clients, like our sales and finance teams, benefit from the new low-latency reporting. Reports that used to be weekly or monthly are now available in near-real time. It’s not only faster to read records, but faster to move the data, too.
We have Cloud Dataflow pipelines that write to multiple places, and the speed of moving and processing data is incredibly helpful. We stream in financial data using Cloud Dataflow in streaming mode, and plan to have different streaming pipelines as we grow. We have several batch pipelines that run every day. We can move terabytes of data without performance issues, and process more than 100,000 rows of data per second from the underlying database. It used to take us a month to move that volume of data into our data warehouse. With BigQuery, it takes two days.
We’re also enjoying how easy and productive these tools are. They make our life as software engineers easier, so we can focus on the problem at hand, not fighting with our tools.
What’s next for Universe
Our team will continue to push even more into Google Cloud’s data platform. We have plans to explore Cloud Datastore next. We’re also moving our databases to PostgreSQL on GCP, using Cloud Dataflow and Beam. BigQuery’s machine learning tools may also come into play as Universe’s cloud journey evolves, so we can start doing predictive analytics based on our data. We’re looking forward to gaining even more speed and agility to meet our business goals and customer needs.
4563
Of your peers have already watched this video.
43:30 Minutes
The most insightful time you'll spend today!
What is Cloud Spanner and Is It the Right Database for You?
You’ve probably heard about Cloud Spanner, but what exactly does it do that is so different from other databases out there?
How do you know if it’s worth spending your valuable time trying out?
Cloud Spanner is the first enterprise-grade, globally distributed, and strongly consistent database service built for the cloud specifically to combine the benefits of relational database structure with non-relational database scale.
Phew! That was a mouthful.
So, what really differentiates it? It’s unique in the marketplace in that it combines transactions, SQL query, and relational structure with the scalability you typically associate with non-relational or NoSQL databases.
Databases are part of every application. So it’s very important to pick the right database for your application.
With Cloud Spanner, you enjoy all the traditional benefits of a SQL database; transactions, high availability, schema changes without downtime, and SQL queries. But unlike many relational databases, Cloud Spanner scales horizontally from one to thousands of servers, an arbitrarily large number.
With fully automatic data replication and server redundancy, Cloud Spanner delivers up to five nines of availability in multi-region instances and four nines of availability in regional instances.
In fact, Google’s internal Spanner instance has been handling millions of queries per second from many Google services for years.
In this video, you’ll find out what Cloud Spanner is, what it’s useful for, why it’s unique, and the challenges it solves.
Why Data Cloud Matters for Business Transformation

3800
Of your peers have already read this article.
2:00 Minutes
The most insightful time you'll spend today!
I’m so excited to be part of Google Cloud. Data has been a longstanding part of my career and it is at the heart of business transformation. Many companies have mastered the ability to collect data and have mechanisms in place to draw on some of it to solve business problems. But most data collected piles up and is never put to a useful purpose. Accessing it and mining it for helpful insights is practically impossible at many companies. It’s always stuck in hard to reach places, fragmented across departments and unavailable when you need it the most.
Our mission at Google Cloud is to accelerate your ability to digitally transform your business with data. Solving data challenges is in our DNA, and over the last two decades we’ve been in a unique position to help our customers get the most out of data to drive real business value.
Google products are used and loved by billions of people across the globe. These products bring together the complex web of disconnected, disparate, and rapidly changing data that makes up the internet. When you get an answer in milliseconds from google.com via a simple search bar, you know we have this down to a science. Google Cloud brings this expertise in data and software together for businesses of all sizes so that you can gain advantage from your data. We call this the data cloud.
Enter the data cloud
A data cloud offers a comprehensive and proven approach to cloud and embraces the full data lifecycle, from the systems that run your business, where data is born, to analytics that support decision making, to AI and machine learning (ML) that predict and automate the future. A data cloud allows you a way to securely unify data across your entire organization, so you can break down silos, increase agility, innovate faster, get value from your data, and support business transformation. This is the heart of the data cloud.
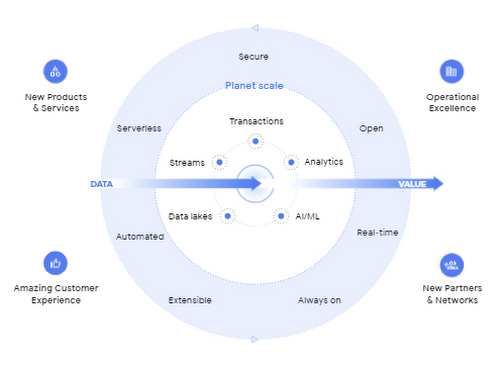
Why a data cloud is essential
Building a data cloud using Google Cloud’s technologies helps organizations accelerate business transformation by giving everyone access to the right information at the right time so that they can act more intelligently based on it.
Since I’ve joined Google, I’ve been not only inspired by the work that the team has done to build products with a user-first mindset, but our customers have been an inspiration to each of us in what’s possible.
- The Home Depot built a data cloud using Google Cloud technologies to help keep 50,000+ items stocked at over 2,000 locations. They’re making their 400,000+ associates smarter by giving them visibility into the things each customer needs, like item location within a local store. By leveraging BigQuery, their query performance dropped from hours and days to seconds and minutes. The Home Depot also uses Cloud SQL, Spanner, and Bigtable for their operational use cases and AI to help locate goods using their mobile apps for in-store navigation.
- Major League Baseball (MLB) is reimagining the fan experience with their data cloud. To build engagement with today’s fans, drive engagement with future generations, and lay the groundwork for future innovation, MLB consolidated its infrastructure and migrated to Google Cloud’s Anthos, Google Kubernetes Engine, Cloud SQL, and BigQuery. MLB tracks every moment of every game for an audience on seven continents with Cloud SQL, this valuable data to drive deeper engagement with fans.
- Vodafone is using their data cloud to offer their customers new, personalized products and services across multiple markets. By identifying more than 700 use cases to deliver new products and services, Vodafone can support fact-based decision-making, reduce costs, remove duplication of data sources, and simplify operations. With Google Cloud, Vodafone’s operating companies in multiple countries can access improved data analytics, intelligence, and machine-learning capabilities.
Here are four reasons why customers trust Google Cloud to build their data cloud strategy:
First, Google delivers insights at planet scale
Customers often gravitate to Google Cloud for our specific data tools that were built for Google’s internal data needs and are unmatched for speed, scale, security, and capability for any size organization. BigQuery is the leading solution for analytics and allows you to run analytics at scale with a 99.99% SLA and up to 34% lower TCO than cloud data warehouse alternatives. Spanner provides unlimited scale, global consistency across regions, and high availability up to 99.999%, at a TCO that is 78% lower compared to on-prem databases and 37% lower than other cloud options. Firestore continues to see rapid adoption with over 2M databases created to power mobile, web, and IoT applications across customer environments. And finally Looker, an API for all your data, offers a single shared place for people and apps to interact with it, no matter the cloud environment.
Second, Google’s AI helps your business be more intelligent
Google was built on pioneering AI research and the principle of making the world’s information useful to people and businesses everywhere. AI powers some of Google’s most popular products, such as Search, Maps, Ads, and YouTube. We have leveraged this expertise to deliver a new, unified AI platform that gives every data scientist, data analyst, and ML engineer access to the same AI toolkit Google uses. Automated machine learning, accelerated experimentation and custom training, and more deployed models than any other platform enable your entire data team to drive business outcomes at any scale.
Third, Google is the open data platform
Google Cloud’s open platform gives customers maximum flexibility for managing transactional, analytical, and AI-based applications. Customers can choose from a wide range of transactional, processing, and analytics engines, open source tools, open APIs, and ML services to eliminate lock-in. This includes choice of deployment across multi-cloud and hybrid environments and easy interoperability with existing partner solutions and investments. With BigQuery Omni, organizations can choose to deploy their data warehousing solution to work natively with AWS or with Azure (coming soon). Looker supports 50+ distinct SQL dialects across multiple clouds and our database services like Cloud SQL, one of the fastest growing services at Google Cloud, offers familiar open source MySQL and PostgreSQL standard connection drivers, so you can work with your preferred tools and stay up-to-date with the latest community enhancements. In addition, Google offers an unrivaled developer community across the fields of AI, machine learning, mobile, application development, microservices, and access to third party solutions and open source systems.
Fourth, Google offers a trusted platform for your data needs
Customers can take advantage of the same secure-by-design infrastructure, built-in data protection, and global network that Google uses to ensure compliance, redundancy, and reliability. All of Google’s data is encrypted in transit and at rest, by default. Google offers industry-leading reliability across regions so you’re always up and running. Spanner offers a 99.999% SLA and BigQuery offers a 99.99% SLA. For BI and embedded analytics, Looker supports data governance via a semantic layer that organizes your data and stores your business logic centrally, delivering consistent and trusted KPIs. And finally, our multi-layered security approach across hardware, services, user identity, storage, internet communication and operations provides peace of mind that your data is protected.
Learn more at Data Cloud Summit
We are committed to helping you build a data cloud that gives you deep insights into your business and process automation. Join me as I welcome Anders Gustafsson, CEO of Zebra and
Gil Perez, CIO of Deutsche Bank at the Data Cloud Summit on May 26, 2021 to learn and share new ways to use data for good. I can’t wait to hear what you accomplish.
More Relevant Stories for Your Company

Data Culture Integral for Building Data Platforms in EdTech Firms
With a data strategy and data warehouse in place, EdTechs are building a data culture that helps everyone - from educators and administrators, to employees in marketing and accounting - make more informed decisions with their data. So how do you build a data culture in your organization? It starts

Creating and Using Storage Buckets for Your Data Needs
So, you want to store objects on the cloud? But you're really new to Google Cloud or Cloud Storage and would like someone to walk you through the process step by step? Today is your lucky day! I will help you understand the big steps involved in setting up and

Boost Database Performance with AlloyDB Index Advisor: The Ultimate Optimization Tool
Intro One of the time consuming tasks for DBAs is to maximize query performance. To optimize slow-running queries, they often have to do detailed analysis, understand optimizer plans, and go through a lot of trial and error before getting to the best set of indexes that help with improved query

What is Google Cloud SQL?
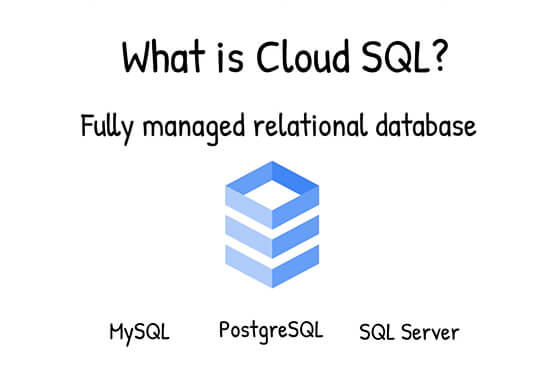
Cloud SQL is a fully managed relational database for MySQL, PostgreSQL, and SQL Server. It reduces maintenance cost and automates database provisioning, storage capacity management, replication, and backups. It offers quick setup, with standard connection drivers and built-in migration tools. How Do You Set It Up? Cloud SQL is easy
