






Accelerate Innovation with Google Cloud’s Managed Database Services
READ FULL INTRODOWNLOAD AGAIN1276
Of your peers have already downloaded this article
4:30 Minutes
The most insightful time you'll spend today!
Fortress Vault Joins Forces with Google Cloud: Launches Private Data Storage for NFTs

2962
Of your peers have already read this article.
2:30 Minutes
The most insightful time you'll spend today!
Over the past two years, the general population has become more acquainted with cryptocurrencies and the first iterations of NFTs, which were among the earliest use cases for blockchain technology. This public awareness and participation has led to a growing interest in, and demand for, Web3 technology at the enterprise level.
But building trust in a new wave of technology, especially in large organizations, doesn’t happen overnight. That is why it’s critical for Web3 technologists to bring the broader benefits, use cases, and core capabilities of blockchain to the forefront of the conversation. If businesses don’t understand how this new technology can help them, how can they prioritize it among competing tech plans and resources? And without baseline protocols that account for privacy, confidential data, and IP, how can they future-proof a business?
Answering these questions and delivering trustworthy infrastructure is exactly why Scott Purcell and I founded Fortress Web3 Technologies — to bring about the next wave of Web3 utility. The company’s goal is to provide infrastructure that eliminates barriers to Web3 adoption with RESTful APIs and widgetized services that enable businesses to quickly launch and scale their Web3 initiatives.
Our tools include embeddable wallets for NFTs and fungible rewards tokens; NFT minting engines; and core financial services. These include payments, compliance, and crypto liquidity via our wholly-owned financial institution, Fortress Trust. Being overseen by a chartered, regulated entity ensures privacy, compliance and business continuity.
Fortress chose Google Cloud to help usher in this new-wave technology because no other cloud provider is better suited to helping regulated industries get up to scale on our Web3 infrastructure and blockchain technology. I’ll get into more specifics below, but at the highest level: IPFS (the current standard distributed storage) is going to face major resistance when it comes to industries that are heavily regulated or deal in ownership rights. By leveraging Google Cloud, which has critical certifications such as HIPPA, Department of Defense, ISO, and Motion Picture, we’re striking the appropriate balance between decentralization and centralization, using the best of both technologies.
The Fortress Vault on Google Cloud is a huge and necessary step forward as the first ever NFT-database solution to protect intellectual property, confidential documents, and other electronic records. It represents the first technology that marries privately stored content with the accessibility, privacy, portability, and provenance that blockchain provides.
Understanding Non-Fungible Tokens (NFTs)
An NFT is not an expensive jpeg. From a technical point of view, an NFT is a unique key stored in a distributed and trustless ledger we call a blockchain. This blockchain token is uniquely identifiable from any other token and acts as a digital key to authenticate ownership and unlock data held in a database.
While different blockchains have adopted different standards, Ethereum standards are a good proxy to represent overall concepts. Going back to the primitives, if you read the EIP 721 proposal, metadata is explicitly optional. While today’s NFT hype has indeed leveraged that technology to monetize and distribute digital art, the potential of blockchain is in the ability to digitally represent ownership of a wide variety of different asset classes on a decentralized ledger.
Unique, non-fungible tokens are not a new concept. We use them every day in technical systems for things like authentication, database keys, idempotency, and much more. Now, thanks to blockchain technology, you can take those out of their walled gardens and into an open platform that can lead to transformational utility and applications.
Take real estate, for example. Instead of a paper-based title documenting you as the owner of your home, imagine that the title is tokenized with an NFT on a blockchain. Any platform could cryptographically verify the authenticity of that form of title along with its provenance in real time and confirm that you’re the rightful owner of that property.
But, perhaps you don’t want the title of your property visible to others, nor the associated permits, tax documents, architectural drawings, contractor lists, and other documents. Maybe you just want banks, insurance companies, and others to be able to confirm that you are indeed the owner without revealing the details of those records. The NFT metadata records immutable public-facing provenance, while the underlying data remains private and protected using Fortress Vault on Google Cloud.
Apply that same utility to other sensitive information such as medical records, intellectual property, estate documents, corporate contracts, and other confidential information and it’s easy to see how enterprises are just now exploring how to hold traditional assets as NFTs.
Fortress Vault: Intellectual Property, Confidential Documents, and Other Electronic Records
What NFTs and Web3 have been lacking is the ability to make the tokenized data accessible exclusively by the owner — and only the owner. NFTs are a digital key to unlock everything ranging from music and event tickets, to real estate deeds and healthcare records, to estate documents, and to everything in the world that’s digital.
This is why we created the Fortress Vault. When building it, we had to make a fundamental decision: Either go with a distributed and permissionless storage protocol like IPFS, filecoin, or other blockchain-based database offerings, or work with an industry-leading cloud platform that understands data integrity and is establishing itself as the leader in the space.
Ultimately, we chose Google Cloud for its industry-leading object storage, professional management, fault tolerance, and myriad of certifications for architecture and data integrity.
Some of the challenges faced when vaulting a vast variety and quantity of digital content at scale include:
- Balancing data availability versus cost of storage
- Data redundancy
- Long term archival needs
- Business continuity
- Flexibility to meet current and future needs of the rapidly evolving Web3 industry.
Google Cloud is the clear leader across all of these pain points. The object lifecycle management of Google Cloud Storage enables efficient transition between storage classes when either the data matures to a certain point or it’s updated with newer files. Content in the Fortress Vault can range from on-demand data to long-term uses, such as estate planning documents that won’t be accessed for 30 years.
When storing NFT data, robust disaster recovery is table stakes. We quickly gravitated to the automatic redundancy options and multi-region storage buckets that let us customize where we store our data without massive devops and management overhead. By leveraging Google Cloud, we can offer industry leading retention, redundancy, and integrity for our customers’ NFT content.
Working with a leader in data storage was key to making this a reality. Additionally, Google Cloud shares our vision of bringing every industry forward into the world of Web3. We are both focused on building the critical infrastructure that allows everyone from Web3 native companies to Fortune 500 brands navigate the strategic shift to blockchain technology.
Why Web3 Matters
“Web3” is shorthand for the “third wave” of the internet and the technological innovation that brought us here.
Web 1 — the earliest internet — democratized reading and access to information, opening the doors to mass communication. Web 2 expanded on that with the ability to read and “write.” It democratized publishing by letting people directly engage in producing information through blogs, social media, gaming, and contributions to collective knowledge.
Web 3 expands our technological capabilities even more with the ability to read, write, and “own.” With blockchain, we can now establish clear provenance with visibility into the origination of ownership of any tokenized asset, and we can see the chain of ownership. We can rely on this next-generation technology to track, authenticate, protect, and keep a ledger of our assets.
With the Fortress Vault on Google Cloud, we have the capability to ensure the integrity of non-public data while making it accessible via NFTs. This is a game changer for Web3 adoption, particularly in industries like music, event ticketing, gaming, finance, transportation, real estate, and healthcare. Every industry can benefit from the ability to tokenize assets on blockchain technology without leaving the trusted safety of Google Cloud data storage.
The market for NFTs is everyone. And the Fortress Vault on Google Cloud is the technology evolution that makes it possible for Web3 innovators to confidently build, launch, and scale their initiatives across every industry imaginable.
BigQuery Explainable AI for Demystifying the Inner Workings of ML Models. Now GA!

6545
Of your peers have already read this article.
2:00 Minutes
The most insightful time you'll spend today!
Explainable AI (XAI) helps you understand and interpret how your machine learning models make decisions. We’re excited to announce that BigQuery Explainable AI is now generally available (GA). BigQuery is the data warehouse that supports explainable AI in a most comprehensive way w.r.t both XAI methodology and model types. It does this at BigQuery scale, enabling millions of explanations within seconds with a single SQL query.
Why is Explainable AI so important? To demystify the inner workings of machine learning models, Explainable AI is quickly becoming an essential and growing need for businesses as they continue to invest in AI and ML. With 76% of enterprises now prioritizing artificial intelligence (AI) and machine learning (ML) over other initiatives in 2021 IT budgets, the majority of CEOs (82%) believe that AI-based decisions must be explainable to be trusted according to a PwC survey.
While the focus of this blogpost is on BigQuery Explainable AI, Google Cloud provides a variety of tools and frameworks to help you interpret models outside of BigQuery, such as with Vertex Explainable AI, which includes AutoML Tables, AutoML Vision, and custom-trained models.
So how does Explainable AI in BigQuery work exactly? And how might you use it in practice?
Two types of Explainable AI: global and local explainability
When it comes to Explainable AI, the first thing to note is that there are two main types of explainability as they relate to the features used to train the ML model: global explainability and local explainability.
Imagine that you have a ML model that predicts housing price (as a dollar amount), based on three features: (1) number of bedrooms, (2) distance to the nearest city center, and (3) construction date.
Global explainability (a.k.a. global feature importance) describes the features’ overall influence on the model and helps you understand if a feature had a greater influence than other features over the model’s predictions. For example, global explainability can reveal that the number of bedrooms and distance to city center typically has a much stronger influence than the construction date on predicting housing prices. Global explainability is especially useful if you have hundreds or thousands of features and you want to determine which features are the most important contributors to your model. You may also consider using global explainability as a way to identify and prune less important features to improve the generalizability of their models.
Local explainability (a.k.a. feature attributions) describes the breakdown of how each feature contributes towards a specific prediction. For example, if the model predicts that house ID#1001 has a predicted price of $230,000, local explainability would describe a baseline amount (e.g. $50,000) and how each of the features contributes on top of the baseline towards the predicted price. For example, the model may say that on top of the baseline of $50,000, having 3 bedrooms contributed an additional $50,000, close proximity to the city center added $100,000, and construction date of 2010 added $30,000, for a total predicted price of $230,000. In essence, understanding the exact contribution of each feature used by the model to make each prediction is the main purpose of local explainability.
What ML models does BigQuery Explainable AI apply to?
BigQuery Explainable AI applies to a variety of models, including supervised learning models for IID data and time series models. The documentation for BigQuery Explainable AI provides an overview of the different ways of applying explainability per model. Note that each explainability method has its own way of calculation (e.g. Shapley values), which are covered more in-depth in the documentation.

Examples with BigQuery Explainable AI
In this next section, we will show three examples of how to use BigQuery Explainable AI in different ML applications:
Regression models with BigQuery Explainable AI
Let’s use a boosted tree regression model to predict how much a taxi cab driver will receive in tips for a taxi ride, based on features such as number of passengers, payment type, total payment and trip distance. Then let’s use BigQuery Explainable AI to help us understand how the model made the predictions in terms of global explainability (which features were most important?) and local explainability (how did the model arrive at each prediction?).
The taxi trips dataset comes from the BigQuery public datasets and is publicly available in the table: bigquery-public-data.new_york_taxi_trips.tlc_yellow_trips_2018.
First, you can train a boosted tree regression model.
CREATE OR REPLACE MODEL bqml_tutorial.taxi_tip_regression_modelOPTIONS (model_type='boosted_tree_regressor',input_label_cols=['tip_amount'],max_iterations = 50,tree_method = 'HIST',subsample = 0.85,enable_global_explain = TRUE) ASSELECTvendor_id,passenger_count,trip_distance,rate_code,payment_type,total_amount,tip_amountFROM`bigquery-public-data.new_york_taxi_trips.tlc_yellow_trips_2018`WHERE tip_amount >= 0LIMIT 1000000
Now let’s do a prediction using ML.PREDICT, which is the standard way in BigQuery ML to make predictions without explainability.
SELECT *FROMML.PREDICT(MODEL bqml_tutorial.taxi_tip_regression_model,(SELECT"0" AS vendor_id,1 AS passenger_count,CAST(5.85 AS NUMERIC) AS trip_distance,"0" AS rate_code,"0" AS payment_type,CAST(55.56 AS NUMERIC) AS total_amount))

But you might wonder—how did the model generate this prediction of ~11.077?
BigQuery Explainable AI can help us answer this question. Instead of using ML.PREDICT, you use ML.EXPLAIN_PREDICT with an additional optional parameter top_k_features. ML.EXPLAIN_PREDICT extends the capabilities of ML.PREDICT by outputting several additional columns that explain how each feature contributes to the predicted value. In fact, since ML.EXPLAIN_PREDICT includes all the output from ML.PREDICT anyway, you may want to consider using ML.EXPLAIN_PREDICT every time instead.
SELECT *FROMML.EXPLAIN_PREDICT(MODEL bqml_tutorial.taxi_tip_regression_model,(SELECT"0" AS vendor_id,1 AS passenger_count,CAST(5.85 AS NUMERIC) AS trip_distance,"0" AS rate_code,"0" AS payment_type,CAST(55.56 AS NUMERIC) AS total_amount),STRUCT(6 AS top_k_features))

The way to interpret these columns is:
Σfeature_attributions + baseline_prediction_value = prediction_value
Let’s break this down. The prediction_value is ~11.077, which is simply the predicted_tip_amount. The baseline_prediction_value is ~6.184, which is the tip amount for an average instance. top_feature_attributions indicates how much each of the features contributes towards the prediction value. For example, total_amount contributes ~2.540 to the predicted_tip_amount.
ML.EXPLAIN_PREDICT provides local feature explainability for regression models. For global feature importance, see the documentation for ML.GLOBAL_EXPLAIN.
Classification models with BigQuery Explainable AI
Let’s use a logistic regression model to show you an example of BigQuery Explainable AI with classification models. We can use the same public dataset as before: bigquery-public-data.new_york_taxi_trips.tlc_yellow_trips_2018.
Train a logistic regression model to predict the bracket of the percentage of the tip amount out of the taxi bill.
CREATE OR REPLACE MODEL bqml_tutorial.taxi_tip_classification_modelOPTIONS(model_type='logistic_reg',input_label_cols=['tip_bucket'],enable_global_explain=true) ASSELECTvendor_id,passenger_count,trip_distance,rate_code,payment_type,total_amount,CASEWHEN tip_amount > total_amount*0.20 THEN '20% or more'WHEN tip_amount > total_amount*0.15 THEN '15% to 20%'WHEN tip_amount > total_amount*0.10 THEN '10% to 15%'ELSE '10% or less'END AS tip_bucketFROM`bigquery-public-data.new_york_taxi_trips.tlc_yellow_trips_2018`WHERE tip_amount >= 0LIMIT 1000000
Next, you can run ML.EXPLAIN_PREDICT to get both the classification results and the additional information for local feature explainability. For global explainability, you can use ML.GLOBAL_EXPLAIN. Again, since ML.EXPLAIN_PREDICT includes all the output from ML.PREDICT anyway, you may want to consider using ML.EXPLAIN_PREDICT every time instead.
SELECT *FROMML.EXPLAIN_PREDICT(MODEL bqml_tutorial.taxi_tip_classification_model,(SELECT"0" AS vendor_id,1 AS passenger_count,CAST(5.85 AS NUMERIC) AS trip_distance,"0" AS rate_code,"0" AS payment_type,CAST(55.56 AS NUMERIC) AS total_amount),STRUCT(6 AS top_k_features))

Similar to the regression example earlier, the formula is used to derive the prediction_value:
Σfeature_attributions + baseline_prediction_value = prediction_value
As you can see in the screenshot above, the baseline_prediction_value is ~0.296. total_amount is the most important feature in making this specific prediction, contributing ~0.067 to the prediction_value, though followed by trip_distance. The feature passenger_count contributes negatively to prediction_value by -0.0015. The features vendor_id, rate_code, and payment_type did not seem to contribute much to the prediction_value.
You may wonder why the prediction_value of ~0.389 doesn’t equal the probability value of ~0.359. The reason is that unlike for regression models, for classification models, prediction_value is not a probability score. Instead, prediction_value is the logit value (i.e., log-odds) for the predicted class, which you could separately convert to probabilities by applying the softmax transformation to the logit values. For example, a three-class classification has a log-odds output of [2.446, -2.021, -2.190]. After applying the softmax transformation, the probability of these class predictions is [0.9905, 0.0056, 0.0038].
Time-series forecasting models with BigQuery Explainable AI

Explainable AI for forecasting provides more interpretability into how the forecasting model came to its predictions. Let’s go through an example of forecasting the number of bike trips in NYC using the new_york.citibike_trips public data in BigQuery.
You can train a time-series model ARIMA_PLUS:
CREATE OR REPLACE MODEL bqml_tutorial.nyc_citibike_arima_modelOPTIONS(model_type = 'ARIMA_PLUS',time_series_timestamp_col = 'date',time_series_data_col = 'num_trips',holiday_region = 'US') ASSELECTEXTRACT(DATE from starttime) AS date,COUNT(*) AS num_tripsFROM`bigquery-public-data.new_york.citibike_trips`GROUP BY dateNext, you can first try forecasting without explainability using ML.FORECAST:SELECT*FROMML.FORECAST(MODEL bqml_tutorial.nyc_citibike_arima_model,STRUCT(365 AS horizon, 0.9 AS confidence_level))
This function outputs the forecasted values and the prediction interval. Plotting it in addition to the input time series gives the following figure.

But how does the forecasting model arrive at its predictions? Explainability is especially important if the model ever generates unexpected results.
With ML.EXPLAIN_FORECAST, BigQuery Explainable AI provides extra transparency into the seasonality, trend, holiday effects, level (step) changes, and spikes and dips outlier removal. In fact, since ML.EXPLAIN_FORECAST includes all the output from ML.FORECAST anyway, you may want to consider using ML.EXPLAIN_FORECAST every time instead.
SELECT*FROMML.EXPLAIN_FORECAST(MODEL bqml_tutorial.nyc_citibike_arima_model,STRUCT(365 AS horizon, 0.9 AS confidence_level))

Compared to the previous figure which only shows the forecasting results, this figure shows much richer information to explain how the forecast is made.
First, it shows how the input time series is adjusted by removing the spikes and dips anomalies, and by compensating the level changes. That is:
time_series_adjusted_data = time_series_data - spikes_and_dips - step_changes
Second, it shows how the adjusted input time series is decomposed into different components such as both weekly and yearly seasonal components, holiday effect component and trend component. That is
time_series_adjusted_data = trend + seasonal_period_yearly + seasonal_period_weekly + holiday_effect + residual
Finally, it shows how these components are forecasted separately to compose the final forecasting results. That is:
time_series_data = trend + seasonal_period_yearly + seasonal_period_weekly + holiday_effect
For more information on these time series components, please see the documentation here.
Conclusion
With the GA of BigQuery Explainable AI, we hope you will now be able to interpret your machine learning models with ease.
Thanks to the BigQuery ML team, especially Lisa Yin, Jiashang Liu, Amir Hormati, Mingge Deng, Jerry Ye and Abhinav Khushraj. Also thanks to the Vertex Explainable AI team, especially David Pitman and Besim Avci.
Two Ad Agencies Leverage BigQuery to Support Next-gen Ad Campaigns

4799
Of your peers have already read this article.
2:30 Minutes
The most insightful time you'll spend today!
Advertising agencies are faced with the challenge of providing the precision data that marketers require to make better decisions at a time when customers’ digital footprints are rapidly changing. They need to transform customer information and real-time data into actionable insights to inform clients what to execute to ensure the highest campaign performance.
In this post, we’ll explore how two of our advertising agency customers are turning to Google BigQuery to innovate, succeed, and meet the next generation of digital advertising head on.
Net Conversion eliminated legacy toil to reach new heights
Paid marketing and comprehensive analytics agency Net Conversion has made a name for itself with its relentless attitude and data-driven mindset. But like many agencies, Net Conversion felt limited by traditional data management and reporting practices.
A few years ago, Net Conversion was still using legacy data servers to mine and process data across the organization, and analysts relied heavily on Microsoft Excel spreadsheets to generate reports. The process was lengthy, fragmented, and slow—especially when spreadsheets exceeded the million-row limit.
To transform, Net Conversion built Conversionomics, a serverless platform that leverages BigQuery, Google Cloud’s enterprise data warehouse, to centralize all of its data and handle all of its data transformation and ETL processes. BigQuery was selected for its serverless architecture, high scalability, and integration with tools that analysts were already using daily, such as Google Ads, Google Analytics, and Data Hub. After moving to BigQuery, Net Conversion discovered surprising benefits that streamlined reporting processes beyond initial expectations. For instance, many analysts had started using Google Sheets for reports, and BigQuery’s native integration with Connected Sheets gave them the power to analyze billions of rows of data and generate visualizations right where they were already working.If you’re still sending Excel files that are larger than 1MB, you should explore Google Cloud.
Kenneth Eisinger
Manager of Paid Media Analytics at Net Conversion
Since modernizing their data analytics stack, Net Conversion has saved countless hours of time that can now be spent on taking insights to the next level. Plus, BigQuery’s advanced data analytics capabilities and robust integrations have opened up new roads to offer more dynamic insights that help clients better understand their audience.
For instance, Net Conversion recently helped a large grocery retailer launch a more targeted campaign that significantly increased downloads of their mobile application. The agency was able to better understand and predict their customers’ needs by analyzing buyer behavior across the website, mobile application, and their purchase history. Net Conversion analyzed website data in real-time with BigQuery, ran analytics on their mobile app data through the Firebase’s integration with BigQuery, and enriched these insights with sales information from the grocery retailer’s CRM to generate propensity behavior models that accurately predicted which customers would most likely install their mobile app.
WITHIN helped companies weather the COVID storm
WITHIN is a performance branding company, focused on helping brands maximize growth by fusing marketing and business goals together in a single funnel. During the COVID-19 health crisis, WITHIN became an innovator in the ad agency world by sharing real-time trends and insights with customers through its Marketing Pulse Dashboard. This dashboard was part of the company’s path to adopting BigQuery for data analytics transformation.
Prior to using BigQuery, WITHIN used a PostgreSQL database to house its data and manual reporting. Not only was the team responsible for managing and maintaining the server, which took focus away from the data analytics, but query latency issues often slowed them down.
BigQuery’s serverless architecture, blazing-fast compute, and rich ecosystem of integrations with other Google Cloud and partner solutions made it possible to rapidly query, automate reporting, and completely get rid of CSV files.
Using BigQuery, WITHIN is able to run Customer Lifetime Value (LTV) analytics and quickly share the insights with their clients in a collaborative Google Sheet. In order to improve the effectiveness of their campaigns across their marketing channels, WITHIN further segments the data into high and low LTV cohorts and shares the predictive insights with their clients for in-platform optimizations.
By distilling these types of LTV insights from BigQuery, WITHIN has been able to use those to empower their campaigns on Google Ads with a few notable success stories.
- WITHIN worked with a pet food company to analyze historical transactional data to model predicted LTV of new customers. They found significant differences between product category and autoship vs single order customers, and they implemented LTV-based optimization. As a result, they saw a 400% increase in average customer LTV.
- WITHIN helped a coffee brand increase their customer base by 560%, with the projected 12-month LTV of newly acquired customers jumping a staggering 1280%.
Through integration with Google AI Platform Notebooks, BigQuery also advanced WITHIN’s ability to use machine learning (ML) models. Today, the team can build and deploy models to predict dedicated campaign impact across channels without moving the data. The integration of clients’ LTV data through Google Ads has also impacted how WITHIN structures their clients’ accounts and how they make performance optimization decisions.
Now, WITHIN can capitalize on the entire data lifecycle: ingesting data from multiple sources into BigQuery, running data analytics, and empowering people with data by automatically visualizing data right in Google Data Studio or Google Sheets.A year ago, we delivered client reporting once a week. Now, it’s daily. Customers can view real-time campaign performance in Data Studio — all they have to do is refresh.
Evan Vaughan
Head of Data Science at WITHIN
Having a consistent nomenclature and being able to stitch together a unified code name has allowed WITHIN to scale their analytics. Today, WITHIN is able to create an internal Media Mix Modeling (MMM) tool with the help of Google Cloud that they’re trialing with their clients.
The overall unseen benefit of BigQuery was that it put WITHIN in a position to remain nimble and spot trends before other agencies when COVID-19 hit. This aggregated view of data allowed WITHIN to provide unique insights to serve their customers better and advise them on rapidly evolving conditions.
Ready to modernize your data analytics? Learn more about how Google BigQuery unlocks the insights hidden in your data.
Firestore Cheatsheet to Unlock Application Innovation

3724
Of your peers have already read this article.
2:00 Minutes
The most insightful time you'll spend today!
Your product teams might ask – “Why does it take so long to build a feature or application?” Building applications is a heavy lift due to the technical complexity, which includes the complexity of backend services that are used to manage and store data. Every moment focused on this technical complexity is a distraction from delivering on core business value. Firestore alters this by having Google Cloud manage your backend complexity through a complete backend-as-a-service!
Firestore is a serverless, NoSQL document database that unlocks application innovation with simplicity, speed and confidence.
It acts as a glue that intelligently brings together the complete Google Cloud backend ecosystem, in-app services from Firebase and core UI frameworks & OS from Google.
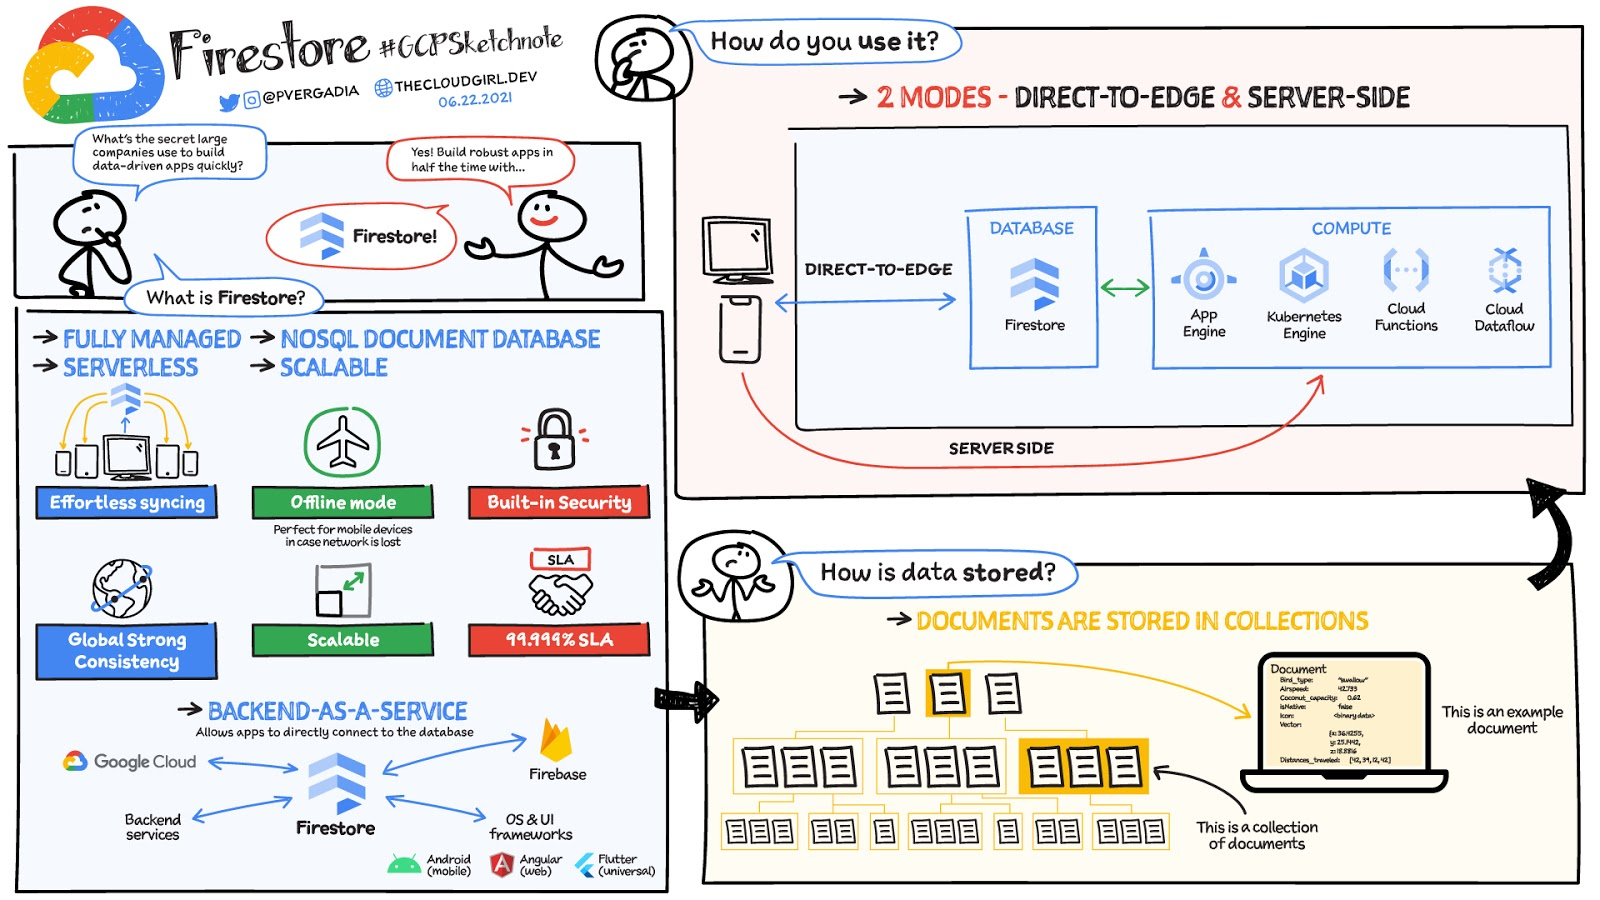
What is Firestore?
Firestore is a serverless, fully managed NoSQL document database that scales from zero to global scale without configuration or downtime. Here’s what makes Firestore unique:
- Ideal for rapid, flexible and scalable web and mobile development with direct connectivity to the database.
- Supports effortless real time data synchronization with changes in your database as they happen.
- Robust support for offline mode, so your users can keep interacting with your app even when the internet isn’t available or is unreliable.
- Fully customizable security and data validation rules to ensure the data is always protected
- Built-in strong consistency, elastic scaling, high performance & best in class 99.999% availability
- Integration with Firebase and Google Cloud services like Cloud Functions and BigQuery, serverless data warehouse.
- In addition to a rich set of Google Cloud service integrations, Firestore also offers deep one-click integrations with a growing set of 3rd party partners via Firebase Extensions to help you even more rapidly build applications.
Document-model database

Firestore is a Document-model database. All of your data is stored in “documents” and then “collections”. You can think of a document as a JSON object. It’s a dictionary with a set of key-value mappings, where the values can be several different supported data types including strings, numbers or binary values..
These documents are stored in collections. Documents can’t directly contain other documents, but they can point to subcollections that contain other documents, which can point to subcollections, and so on. This structure brings with it a number of advantages. For starters, all queries that you make are shallow, meaning that you can grab a document without worrying about grabbing all the data underneath it. And this means that you can structure your data hierarchically in a way that makes sense to you logically, without having to worry about grabbing tons of unnecessary data.
How to use Firestore?
Firestore can be used in two modes:
- Firestore in Native Mode: This mode is differentiated by its ability to directly connect your web & mobile app to Firestore. Native Mode supports up to 10K writes per second, and over a million connections.
- Firestore in Datastore Mode: This mode supports only server-side usage of Firestore, but supports unlimited scaling, including writes.
Conclusion
Whatever your application use case may be, if you want to build a feature or an application quickly using Firestore backend-as-a-service. For a more in-depth look into Firestore check out the documentation. https://www.youtube.com/embed/moglAjmwmUQ?enablejsapi=1&
For more #GCPSketchnote, follow the GitHub repo. For similar cloud content follow me on Twitter @pvergadia and keep an eye out on thecloudgirl.dev.
Data Culture Integral for Building Data Platforms in EdTech Firms

5012
Of your peers have already read this article.
2:00 Minutes
The most insightful time you'll spend today!
With a data strategy and data warehouse in place, EdTechs are building a data culture that helps everyone – from educators and administrators, to employees in marketing and accounting – make more informed decisions with their data.
So how do you build a data culture in your organization? It starts by asking these questions:
- Are users able to find answers to their data questions from available data?
- Can they act based on available metrics?
- Can they tell a compelling story with the data at hand?
How well is your company using analytics? The matrix from Looker’s Analytical Maturity eBook, shows ranges from “vanity” (nice to see) metrics to “optimization.”

Adopting and rolling out your organization’s new data platform
As outlined in the previous blog in this series, From data chaos to data-driven: How dedicated data teams can help EdTechs influence the future of education, a comprehensive data team is essential for building a data warehouse. That data team should include a core education intelligence team. This team can align with analytically savvy members of each department they support. It’s critical that the Education Intelligence team understand each department’s reporting needs and can make adjustments based on user feedback.
Include these key components to ensure smooth adoption for internal teams:
- Share a roadmap: An effective rollout team always knows what’s next on their roadmap and communicates that to the entire organization. Launching analytics across an entire company at once usually leads to slow movement, miscommunication, and lack of adoption. A roadmap will ease this transition.
- Train everyone: This approach makes sure everyone is consistent during the data rollout. Show users how to make the most of the platform your data team has created, and be sure they know where they can go for help.
- Monitor and optimize: Monitor your organization’s analytics usage. Understand which individuals are using your education intelligence system to drive their day-to-day operations. These individuals can provide further insight into what is working. Identifying those who may need more guidance and support ensures they don’t miss out on benefits.
Guild Education: Creating a data culture
Guild Education started working with Google Cloud to build a data culture and implemented Looker as their data platform.
The company transformed their student success program—in which coaches work directly with connected employees throughout their educational journey—with Looker. “As enrollments increased, even spreadsheets were not able to accurately keep track of caseloads,” Sean McKeever, Senior Business Intelligence Analyst, recalls. “We needed a singular source of truth that could be updated in almost real-time.” In response, they created “Student Rosters” to manage a coach’s student outreach.
Users were thrilled with the new tools, and when the coaching team grew from 20 to 90, Sean created ambassador groups consisting of data specialists to support each department. This sparked Guild Education’s “data-driven evolution.”
“Unexpectedly, the Student Success task force also became an engine for new BI work,” Sean says. “They blew my highest expectations out of the water and started owning virtually the entire process: building requirements, prototyping, testing, and deploying new dashboards and panels—with hardly any help from the BI team.”
These successes have set Guild Education on its way to becoming a fully data-driven company. Unexpectedly, the Student Success task force also became an engine for new BI work…they blew my highest expectations out of the water and started owning virtually the entire process…with hardly any help from the BI team.
Sean McKeever
Senior Business Intelligence Analyst, Guild Education
Start your journey from data chaos to data-driven
We hope this three-part series has shown how data analytics has an important role to play in transforming the future of education. EdTech companies are unlocking the power of big data to serve their customers. “The education landscape is changing rapidly, and EdTech has a major role to play as institutions adapt to the massive shift in learners’ preferences and expectations,” says Jesus Trujillo Gomez, Strategic Business Executive, Education & Research, Google Cloud.
Feeling inspired? Let’s meet your EdTech challenges together and transform your data culture. Visit Google Cloud for education technology.
More Relevant Stories for Your Company

Is it Cheaper to Run Oracle Workloads on Google Cloud Than On-Prem? Yes, By 78%
On-premises relational database management systems (RDBMS) are the traditional heart of many core business operations, but cloud-based relational databases provide the agility and scalability of the cloud while eliminating many of the onerous tasks associated with maintaining your own infrastructure. To find out how much more value cloud-based relational databases

The Divercity Story: Using Google Cloud to Achieve a More Inclusive and Sustainable Workforce
Despite a growing number of diversity, equity, and inclusion (DEI) initiatives, Black and Latinx people remain highly underrepresented in tech. Although comprising 12.6% and 18% of the U.S. labor force respectively, Black professionals hold only 5% of tech positions, while Latinx professionals fill just 6% of tech roles. Long-standing biases

Home Depot’s Interconnected Retail Experience by Virtue of Google Cloud Migration for SAP Applications
With nearly 2,300 stores, The Home Depot is the world’s largest home-improvement chain — a brand that professional contractors and DIYers alike have come to depend on. The home improvement industry continues to experience unprecedented demand and dramatic increases in online ordering accompanied by expanding consumer expectations for things like

What Drives Your Organization to be Data-driven?
Every organization has its own unique data culture and capabilities. Yet each is expected to use technology trends and solutions in the same way as everyone else. Your organization may be built on years of legacy applications, you may have developed a considerable amount of expertise and knowledge, yet you
