





Recommendations for Modelling SAP Data inside BigQuery

8419
Of your peers have already read this article.
4:00 Minutes
The most insightful time you'll spend today!
Over the past few years, many organizations have experienced the benefits of migrating their SAP solutions to Google Cloud. But this migration can do more than reduce IT maintenance costs and make data more secure. By leveraging BigQuery, SAP customers can complement their SAP investments and gain fresh insights by consolidating enterprise data and easily extending it with powerful datasets and machine learning from Google.
BigQuery is a leading cloud data warehouse, fully managed and serverless, and allows for massive scale, supporting petabyte-scale queries at super-fast speeds. It can easily combine SAP data with additional data sources, such as Google Analytics or Salesforce, and its built-in machine learning lets users operationalize machine learning models using standard SQL — all at a comparatively low cost.
If your SAP-powered organization is looking to supercharge its analytics with the strength of BigQuery, read on for considerations and recommendations for modeling with SAP data. These guidelines are based on our real-world implementation experience with customers and can serve as a roadmap to the analytics capabilities your business needs.
Considerations for data replication
Like most technology journeys, this one should start with a business objective. Keeping your intended business value and goals in mind is critical to making the right decisions in the early steps of the design process.
When it comes to replicating the data from an SAP system into BigQuery, there are multiple ways to do it successfully. Decide which method will work best for your organization by answering these questions:
- Does your business need real-time data? Will you need to time travel into past data?
- Which external datasets will you need to join with the replicated data?
- Are the source structures or business logic likely to change? Will you be migrating the SAP source systems any time soon? For instance, will you be moving from SAP ECC to SAP S/4HANA?
You’ll also need to determine whether replication should be done on a table-by-table basis or whether your team can source from pre-built logic. This decision, along with other considerations such as licensing, will influence which replication tool you should use.
Replicating on a table-by-table basis
Replicating tables, especially standard tables in their raw form, allows sources to be reused and ensures more stability of the source structure and functional output. For example, the SAP table for sales order headers (VBAK) is very unlikely to change its structure across different versions of SAP, and the logic that writes to it is also unlikely to change in a way that affects a replicated table.
Something else to consider: Reconciliation between the source system and the landing table in BigQuery is linear when comparing raw tables, which helps avoid issues in consolidation exercises during critical business processes, such as period-end closing. Since replicated tables aren’t aggregated or subject to process-specific data transformation, the same replicated columns can be reused in different BigQuery views. You can, for instance, replicate the MARA table (the material master) once and use it in as many models as needed.
Replicating pre-built logic
If you replicate pre-built models, such as those from SAP extractors or CDS views, you don’t need to build the logic in BigQuery, since you’re using existing logic. Some of these extraction objects have embedded delta mechanisms, which may complement a replication tool that can’t handle deltas. This will save initial development time, but it can also lead to challenges if you create new columns, or if customizations or upgrades change the logic behind the extraction.
It’s also important to note that different extraction processes may transform and load the same source columns multiple times, which creates redundancy in BigQuery and can lead to higher maintenance needs and costs. However, replicating pre-built models may still be a good choice, since doing so can be especially useful for logic that tends to be immutable, such as flattening a hierarchy, or logic that is highly complex.
How you approach replication will also depend on your long-term plans and other key factors — for example, the availability (and curiosity) of your developers, and the time or effort they can put into applying their SQL knowledge to a new data warehouse.
With either replication approach, bear in mind when designing your replication process that BigQuery is meant to be an append-always database — so post-processing of data and changes will be required in both cases.
Processing data changes
The replication tool you choose will also determine how data changes are captured (known as CDC – change data capture). If the replication tool allows for it (for example as SAP SLT does) the same patterns described in the CDC with BigQuery documentation also apply to SAP data.
Because some data, like transactions, are known to be less static than others (e.g., master data), you need to decide what should be scanned in real time, what will require immediate consistency, and what can be processed in batches to manage costs. This decision will be based on the reporting needs from the business.
Consider the SAP table BUT000, containing our example master data for business partners, where we have replicated changes from an SAP ERP system:
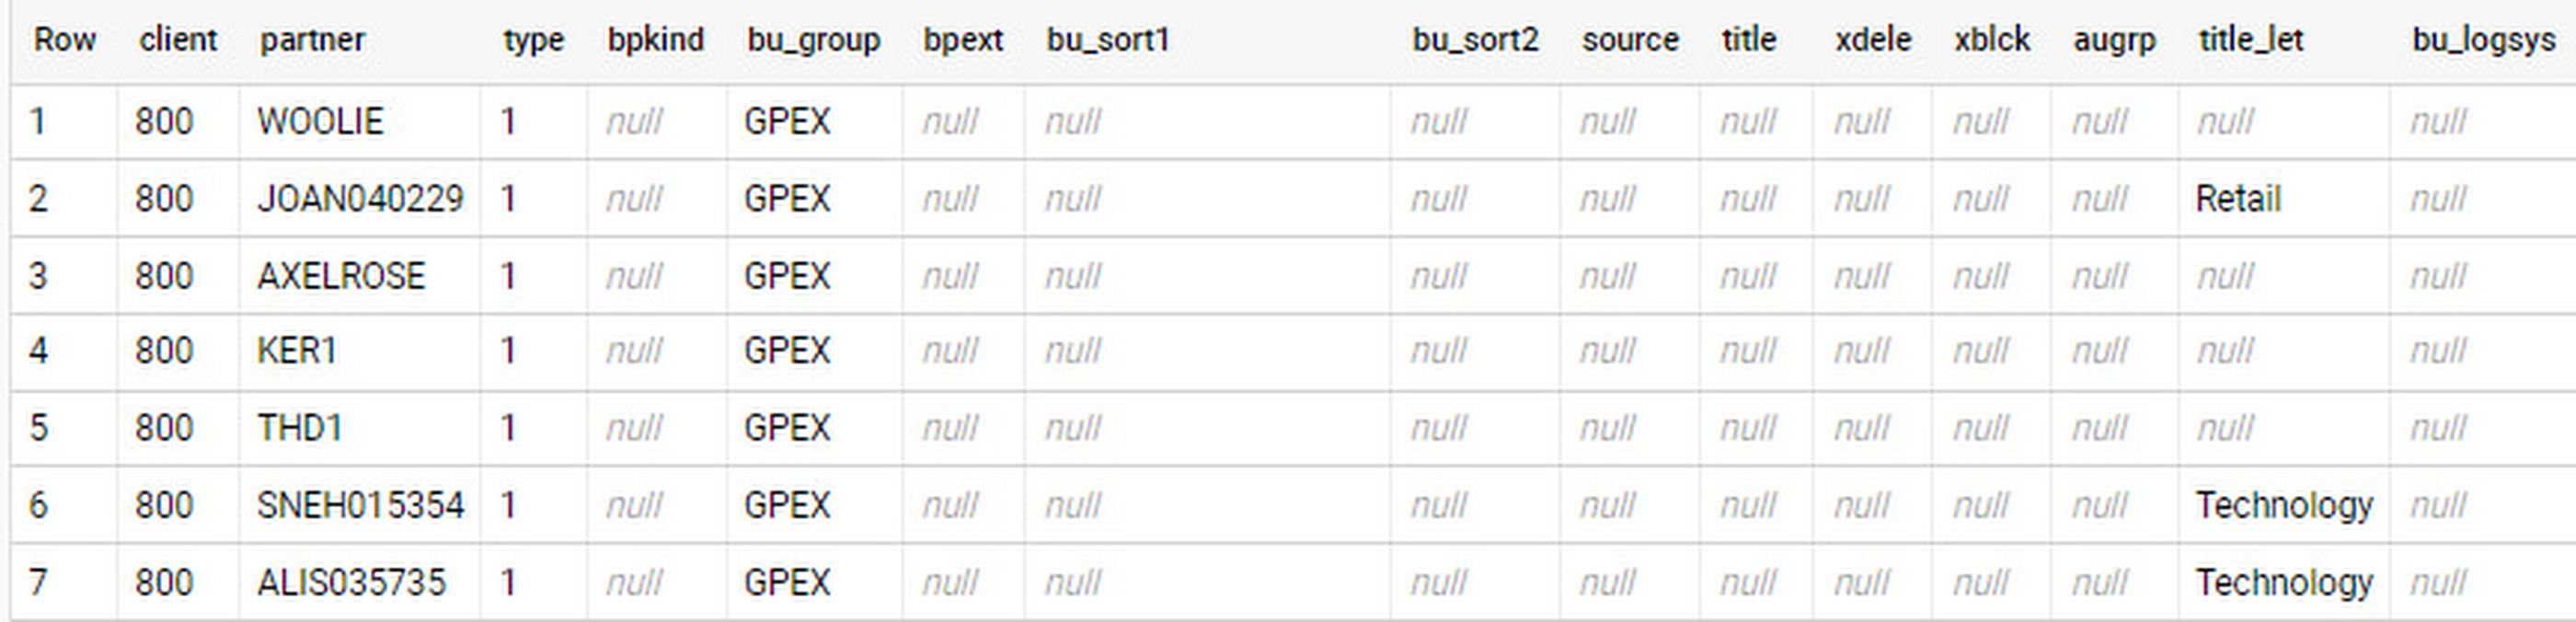
In an append-always replication in BigQuery, all updates are received as new records. For example, deleting a record in the source will be represented as a new record in BigQuery with a deletion flag. This applies to whether the records are coming from raw tables like BUT000 itself or pre-aggregated data, as from a BW extractor or a CDS view.
Let’s take a closer look at data coming particularly from the partners “LUCIA” and “RIZ”. The operation flag tells us whether the new record in BigQuery is an insert (I), update (U) or deletion (D), while the timestamps help us identify the latest version of our business partner.
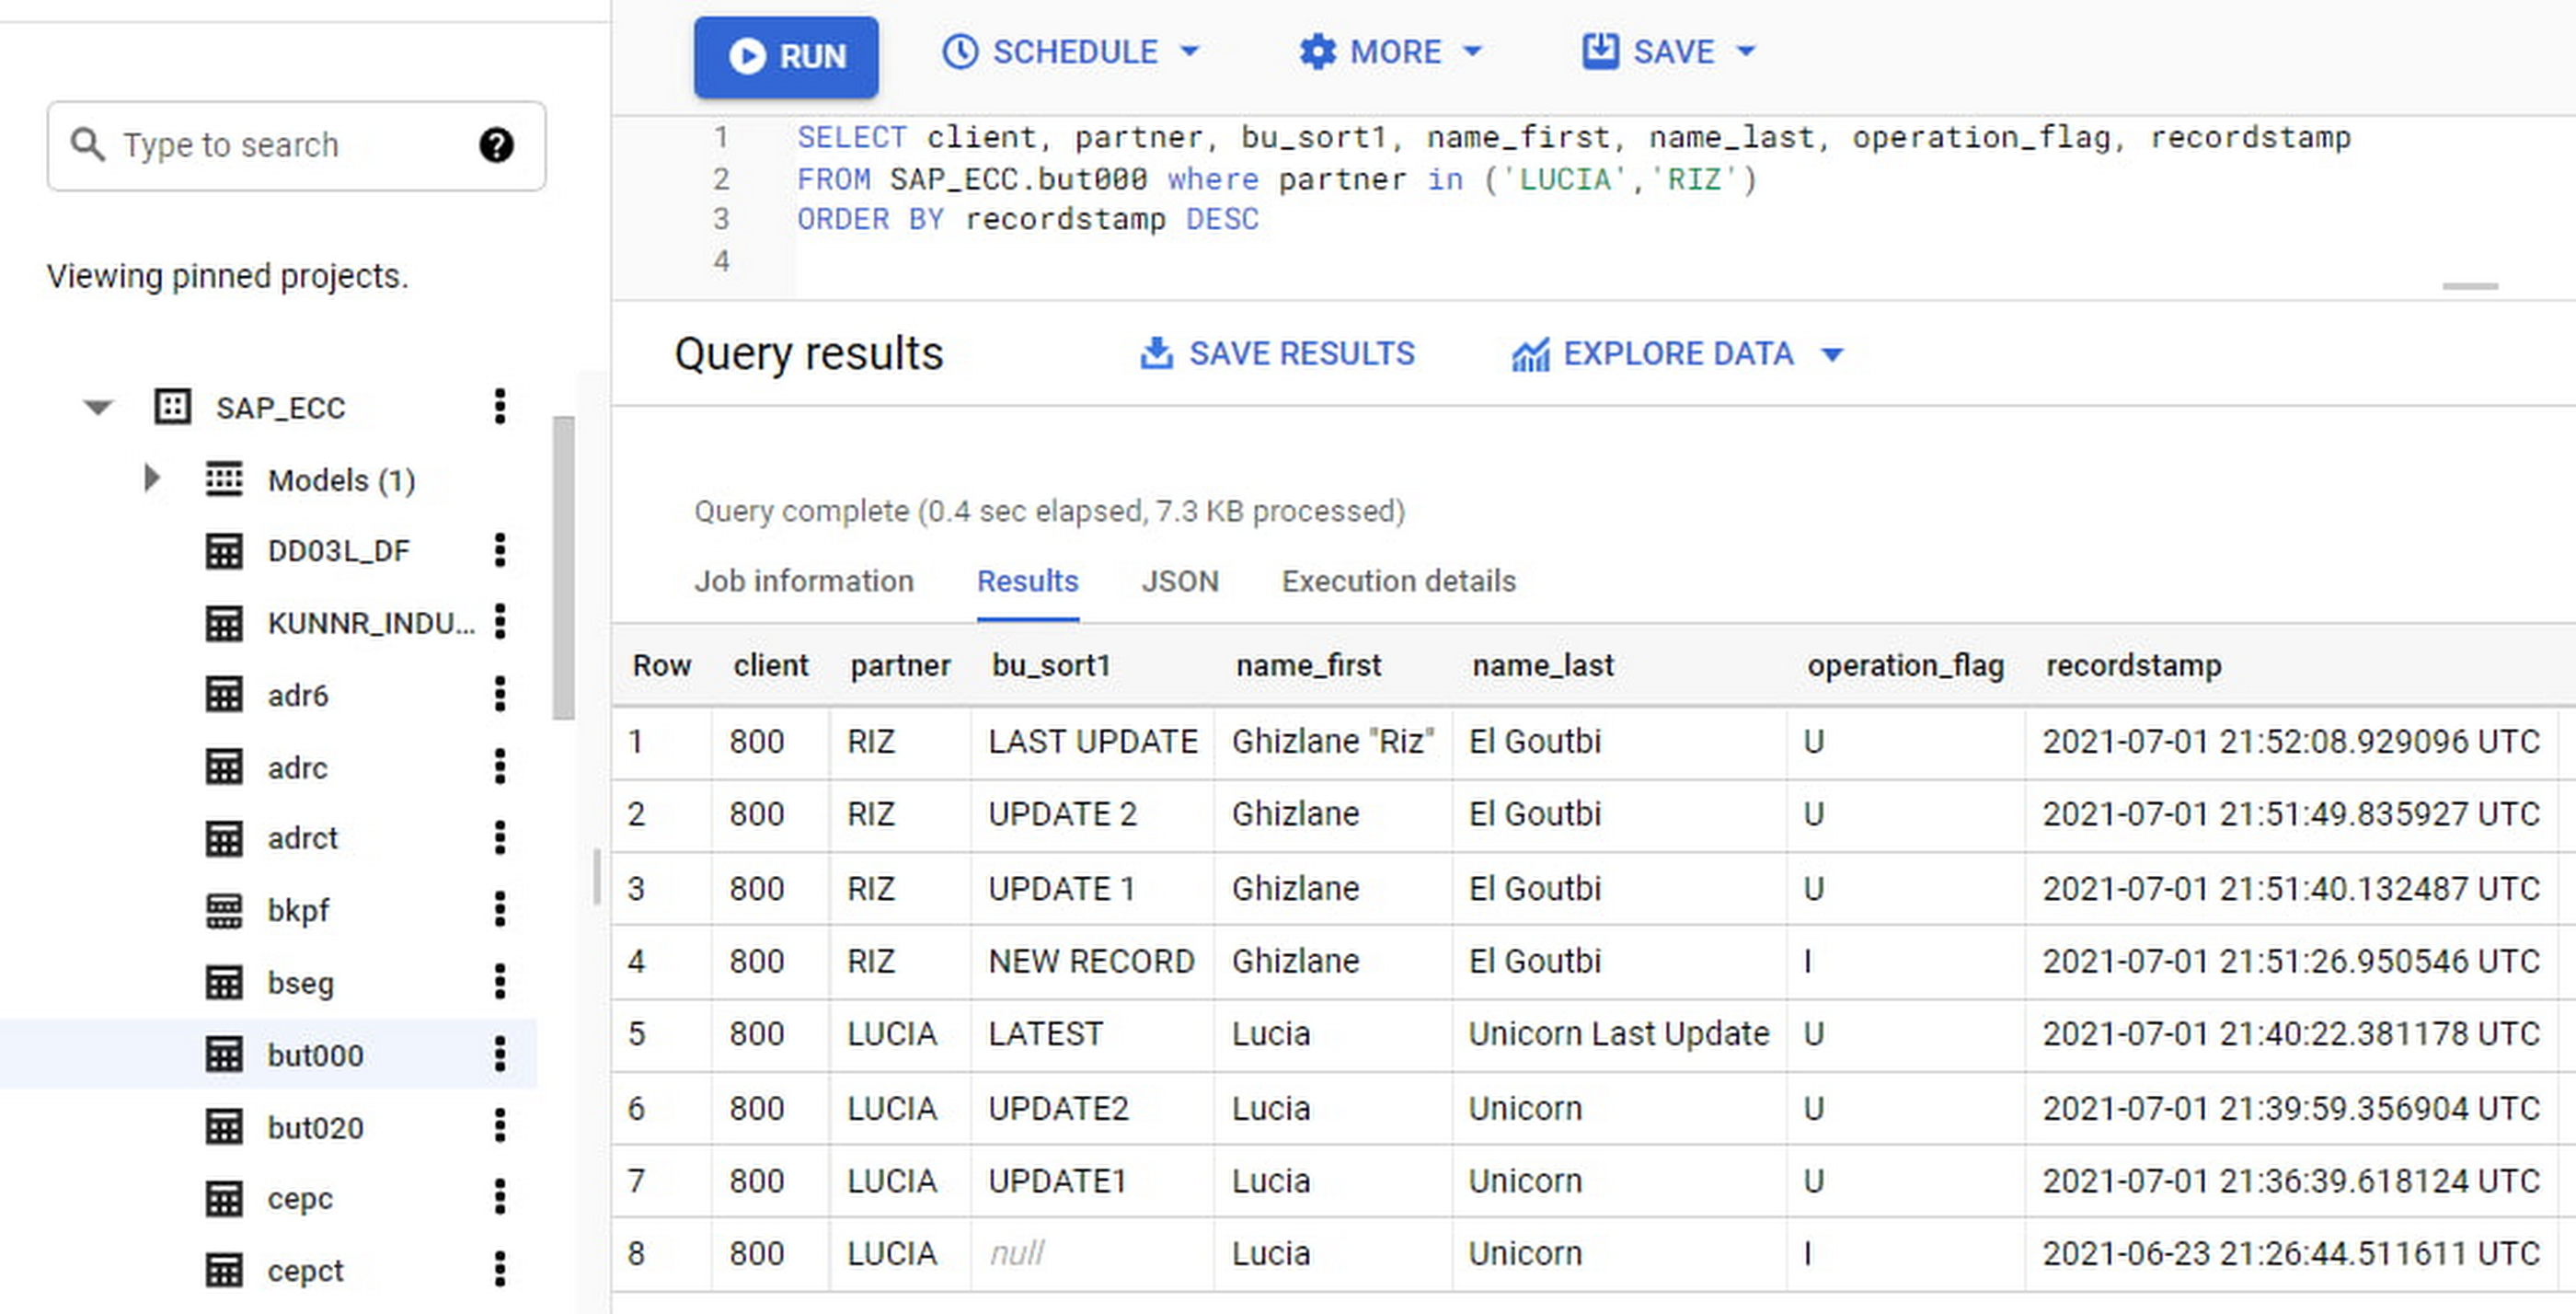
If we want to find the latest updated record for the partners LUCIA and RIZ, this is what the query would look like:
SELECT partner,ARRAY_AGG(i1 ORDER BY i1.recordstamp DESC LIMIT 1) AS rowFROM SAP_ECC.but000 i1WHERE partner in ('LUCIA','RIZ')GROUP BY partner
With the following result:
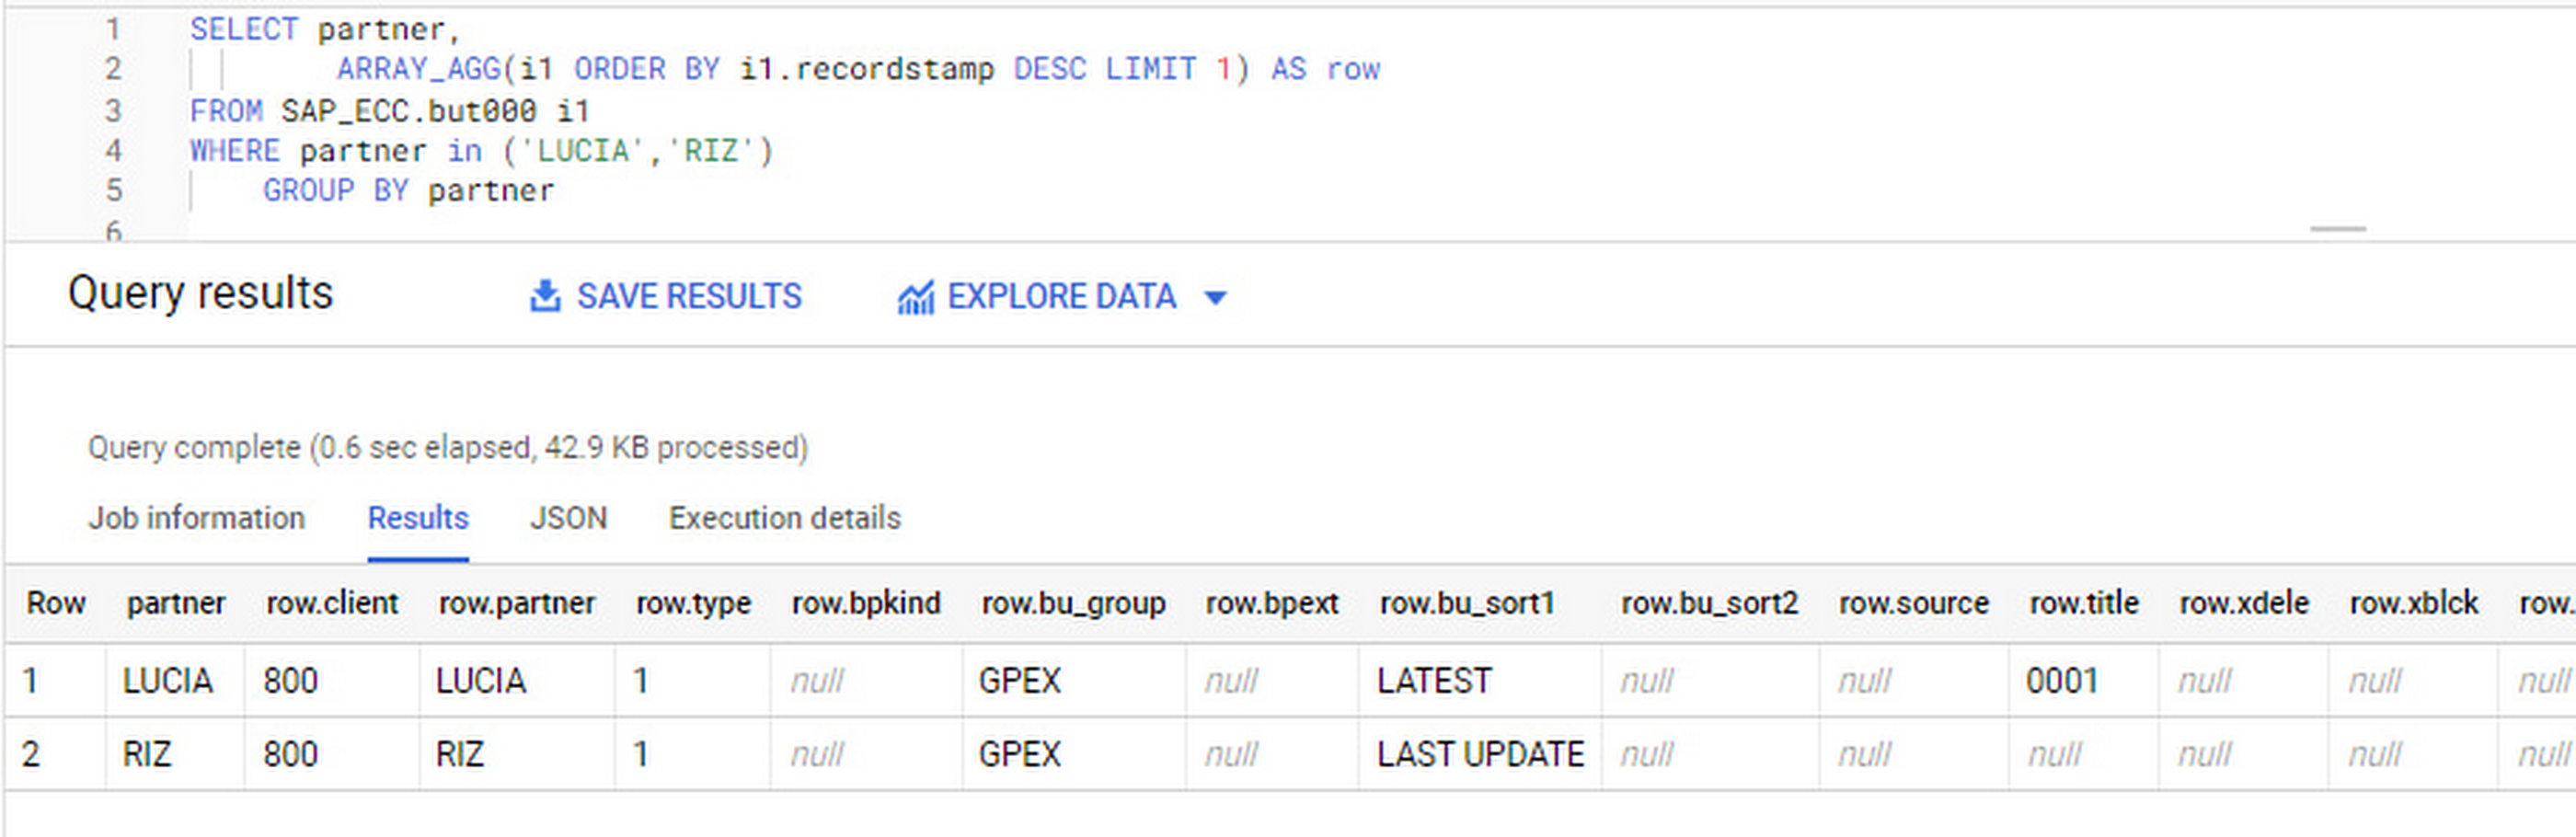
After identifying stale records for “LUCIA” and “RIZ” business partners, we can proceed to deleting all stale records for “LUCIA” if we do not want to retain the history. In this example, we are using a different table to which the same replication has been done, for the purpose of comparison and to check that all stale records have been deleted for the selection made and that we only kept last updated records. For example:
DELETE SAP_HANA.but000 i1WHEREi1.recordstamp < TIMESTAMP_SUB(CURRENT_TIMESTAMP(), INTERVAL 3 HOUR) ANDi1.recordstamp < (SELECT MAX(recordstamp) FROM SAP_HANA.but000 i2WHEREi1.partner = i2.partnerand partner="LUCIA")
You can also use the following query to retrieve stale records for “LUCIA” partner before moving forward with deletion
SELECT partner, operation_flag, recordstamp FROM SAP_HANA.but000 i1WHEREi1.recordstamp < TIMESTAMP_SUB(CURRENT_TIMESTAMP(), INTERVAL 3 HOUR)ANDi1.recordstamp < (SELECT MAX(recordstamp) FROM SAP_HANA.but000 i2WHEREi1.partner = i2.partnerand partner="LUCIA")
Which produces all of the records, except the latest update:

Partitioning and clustering
To limit the number of records scanned in a query, save on cost and achieve the best performance possible, you’ll need to take two important steps: determine partitions and create clusters.
Partitioning
A partitioned table is one that’s divided into segments, called partitions, which make it easier to manage and query your data. Dividing a large table into smaller partitions improves query performance and controls costs because it reduces the number of bytes read by a query.
You can partition BigQuery tables by:
- Time-unit column: Tables are partitioned based on a “timestamp,” “date,” or “datetime” column in the table.
- Ingestion time: Tables are partitioned based on the timestamp recorded when BigQuery ingested the data.
- Integer range: Tables are partitioned based on an integer column.
Partitions are enabled when the table is created, as in the example below. A great tip is to always include the partition filter as shown on the left-hand side of the query.

Clustering
Clustering can be created on top of partitioned tables by applying the fields that are likely to be used for filtering. When you create a clustered table in BigQuery, the table data is automatically organized based on the contents of one or more of the columns in the table’s schema. The columns you specify are then used to colocate related data.
Clustering can improve the performance of certain query types — for example, queries that use filter clauses or that aggregate data. It makes a lot of sense to use them for large tables such as ACDOCA, the table for accounting documents in SAP S/4HANA. In this case, the timestamp could be used for partitioning, and common filtering fields such as the ledger, company code, and fiscal year could be used to define the clusters.
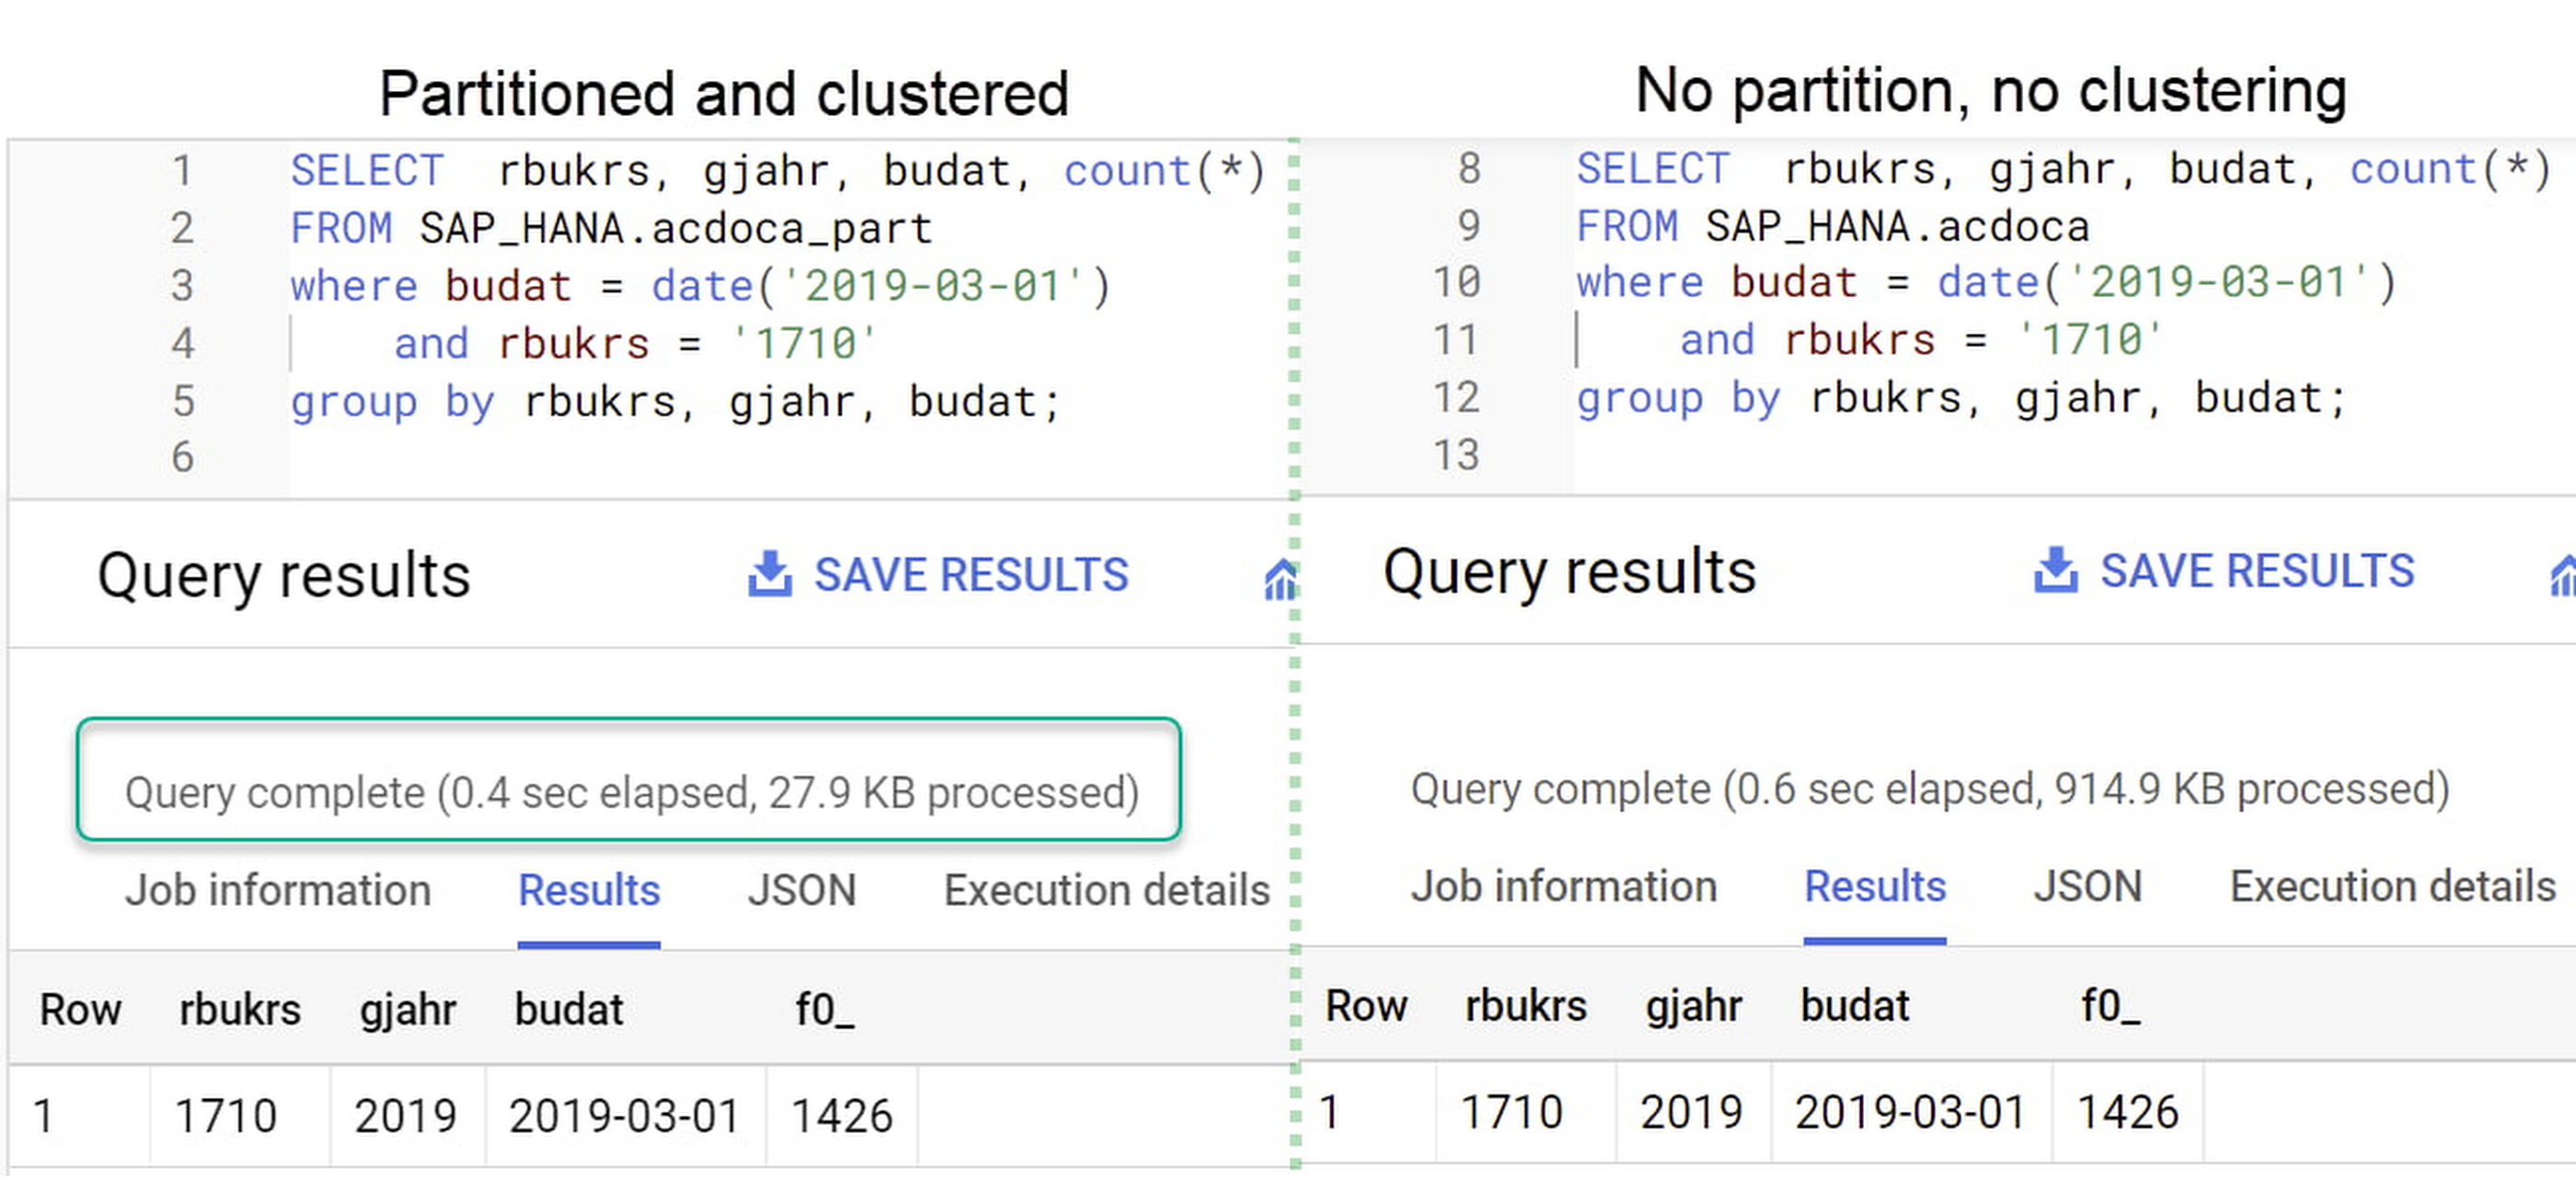
A great feature is that BigQuery will also periodically recluster the data automatically.
Materialized views
In BigQuery, materialized views are precomputed views that periodically cache the results of a query for better performance and efficiency. BigQuery uses precomputed results from materialized views and, whenever possible, reads only the delta changes from the base table to compute up-to-date results quickly. Materialized views can be queried directly or can be used by the BigQuery optimizer to process queries to the base table.
Queries that use materialized views are generally completed faster and consume fewer resources than queries that retrieve the same data only from the base table. If workload performance is an issue, materialized views can significantly improve the performance of workloads that have common and repeated queries. While materialized views currently only support single tables, they are very useful common and frequent aggregations like stock levels or order fulfillment.
Further tips on performance optimization while creating select statements can be found in the documentation for optimizing query computation.
Deployment pipeline and security
For most of the work you’ll do in BigQuery, you’ll normally have at least two delivery pipelines running — one for the actual objects in BigQuery and the other to keep the data staging, transforming, and updated as intended within the change-data-capture flows. Note that you can use most existing tools for your Continuous Integration / Continuous Deployment (CI/CD) pipeline — one of the benefits of using an open system like BigQuery. But, if your organization is new to CI/CD pipelines, this is a great opportunity to gradually gain experience. A good place to start is to read our guide for setting up a CI/CD pipeline for your data-processing workflow.
When it comes to access and security, most end-users will only have access to the final version of the BigQuery views. While row and column-level security can be applied, as in the SAP source system, separation of concerns can be taken to the next level by splitting your data across different Google Cloud projects and BigQuery datasets. While it’s easy to replicate data and structures across your datasets, it’s a good idea to define the requirements and naming conventions early in the design process so you set it up properly from the start.
Start driving faster and more insightful analytics
The best piece of advice we can give you is this: Try it yourself. Anyone with SQL knowledge can get started using the free BigQuery tier. New customers get $300 in free credits to spend on Google Cloud during the first 90 days. All customers get 10 GB storage and up to 1 TB queries/month, completely free of charge. In addition to discovering the massive processing capabilities, embedded machine learning, multiple integration tools, and cost benefits, you’ll soon discover how BigQuery can simplify your analytics tasks.
If you need additional assistance, our Google Cloud Professional Services Organization (PSO) and Customer Engineers will be happy to help show you the best path forward for your organization. For anything else, contact us at cloud.google.com/contact.
Mrs. T’s Pierogies Moves SAP Systems to Google Cloud for Faster Analytics Capabilities for its SAP Data

6839
Of your peers have already read this article.
1:30 Minutes
The most insightful time you'll spend today!
Pierogies might just be the ultimate comfort food. But when Mrs. T’s Pierogies — the leading manufacturer of frozen pierogies in the US — learned it needed to transition its existing on-premises SAP ECC to S/4HANA, the company sought a little comfort for itself.
Founded in 1952, Mrs. T’s Pierogies now produces more than 650 million pierogies a year. Moving that many pierogies requires a powerful ERP system — and an equally powerful IT infrastructure on which to run it. Mrs. T’s realized that the SAP-mandated transition of its ERP solution to SAP S/4HANA was an opportunity to move its SAP systems to Google Cloud and gain real-time analytics capabilities for faster sales forecasting, more effective trade promotions, and more sophisticated planning.
From necessity to opportunity
Mrs. T’s successfully ran its SAP ECC solution on its own on-premises servers for years. But after SAP decided to sunset the product, Mrs. T’s realized that it faced multiple challenges, including:
- Migrating its SAP ECC 6.0 system from an on-premises leagcy OS to a cloud-based Linux environment
- Moving data from its SAP DB2 database to HANA
- Transitioning from ECC to SAP S/4HANA
That complex transition needed to take place with little or no downtime, since nearly all of the company’s invoices, warehouse movements, and transfer orders used the Electronic Data Interchange (EDI) protocol. Missing even a few hours of EDI transactions would put significant revenue at stake. Adding to the challenge: Some Mrs. T’s customers would not accept an invoice past five days, which left little room for error. Mrs. T’s chose Rackspace Technology, a longtime Google Cloud partner, to oversee the move.
Mrs. T’s could have chosen to run S/4HANA on its legacy hardware but saw migration to Google Cloud as an opportunity to improve key aspects of its business, in particular data analytics. Historically, sales planning and forecasting involved time-consuming manual processes. But the speed, availability, and scalability of Google Cloud meant that Mrs. T’s could take advantage of S/4HANA’s embedded analytics capabilities. Migrating could also open the door to leveraging Google Cloud’s native integration of SAP data to power Google tools such as BigQuery, Google Cloud AI Building Blocks, and more.
The move to Google Cloud also gave Mrs. T’s an opportunity to update its disaster recovery process. Previously, the company backed up to tape. So, if its SAP systems went down, a member of the IT department would have to drive the most recent tape backups an hour to its cold site, where the disaster recovery partner would load the SAP backup tape, boot the system up, switch network connections to that site, and cross their fingers. Not only would downtime be significant, but restored data would be limited to the periodic tape backup.
“Everything just worked”
Once Mrs. T’s decided to migrate to Google Cloud, the company worked with Rackspace Technology to implement the system. The first phase focused on moving the SAP production environment from on-premises infrastructure to Google Cloud and updating its database to HANA, which took place over 12 weeks. The switchover occurred over a weekend and was all but invisible to users. “We came in on Monday and everything just worked,” recalls Timothy Coyle, Director of Information Systems & Technology. In a second four-month phase, the company transitioned from ECC to S/4.
The move to Google Cloud paid dividends immediately. Batch transactions occurred twice as fast and on-screen end-user transactions rendered instantly. The upgrade also gave the finance team access to embedded analytics and monitoring for the first time. With everything now in the cloud, disaster recovery could be dynamic and nearly instantaneous, with a worst-case scenario of just 5 to 10 minutes of downtime.
“Mrs. T’s needed a skilled and experienced partner that could move its SAP environment to Google Cloud with no negative impacts to its business. We knew this migration was a key initiative in Mrs. T’s digital transformation journey,” says Chuck Britton, Google Partner Development Manager at Rackspace. “We also knew that running SAP on Google Cloud would give the business the fast and flexible analytical capabilities it needed for its SAP data.”
From ideation to production, Mrs. T’s migrated from its legacy on-premises infrastructure to a modern SAP S/4HANA solution on Google Cloud in only seven months, with minimal downtime and zero disruptions. Now that the migration is complete, Mrs. T’s has a flexible, highly scalable environment to run the SAP applications and data that fuel the business. Says Coyle, “Our strategic intent for IT is to make processes simpler, people more productive, and infrastructure more secure. This project fits right square in the middle of that strategic philosophy.”
Learn more about ways in which Google Cloud can transform your SAP experience and about Rackspace Google Cloud solutions for SAP customers.
Notebook Executor Feature of Vertex AI Workbench to Schedule Notebooks Ad Hoc or on Recurring Basis

4444
Of your peers have already read this article.
3:00 Minutes
The most insightful time you'll spend today!
When solving a new ML problem, it’s common to start by experimenting with a subset of your data in a notebook environment. But if you want to execute a long-running job, add accelerators, or run multiple training trials with different input parameters, you’ll likely find yourself copying code over to a Python file to do the actual computation. That’s why we’re excited to announce the launch of the notebook executor, a new feature of Vertex AI Workbench that allows you to schedule notebooks ad hoc, or on a recurring basis. With the executor, your notebook is run cell by cell on Vertex AI Training. You can seamlessly scale your notebook workflows by configuring different hardware options, passing in parameters you’d like to experiment with, and setting an execution schedule, all via the Console UI or the notebooks API.
Built to Scale
Imagine you’re tasked with building a new image classifier. You start by loading a portion of the dataset into your notebook environment and running some analysis and experiments on a small machine. After a few trials, your model looks promising, so you want to train on the full image dataset. With the notebook executor, you can easily scale up model training by configuring a cluster with machine types and accelerators, such as NVIDIA GPUs, that are much more powerful than the current instance where your notebook is running.
Your model training gets a huge performance boost from adding a GPU, and you now want to run a few extra experiments with different model architectures from TensorFlow Hub. For example, you can train a new model using feature vectors from various architectures, such as Inception, ResNet, or MobileNet, all pretrained on the ImageNet dataset. Using these feature vectors with the Keras Sequential API is simple; all you need to do is pass the TF Hub URL for the particular model to hub.KerasLayer.

Instead of running these trials one by one in the notebook, or making multiples copies of your notebook (inceptionv3.ipynb, resnet50.ipynb, etc) for each of the different TF Hub URLs, you can experiment with different architectures by using a parameter tag. To use this feature, first select the cell you want to parameterize. Then click on the gear icon in the top right corner of your notebook.

Type “parameters” in the Add Tag box and hit Enter. Later when configuring your execution, you’ll pass in the different values you want to test.
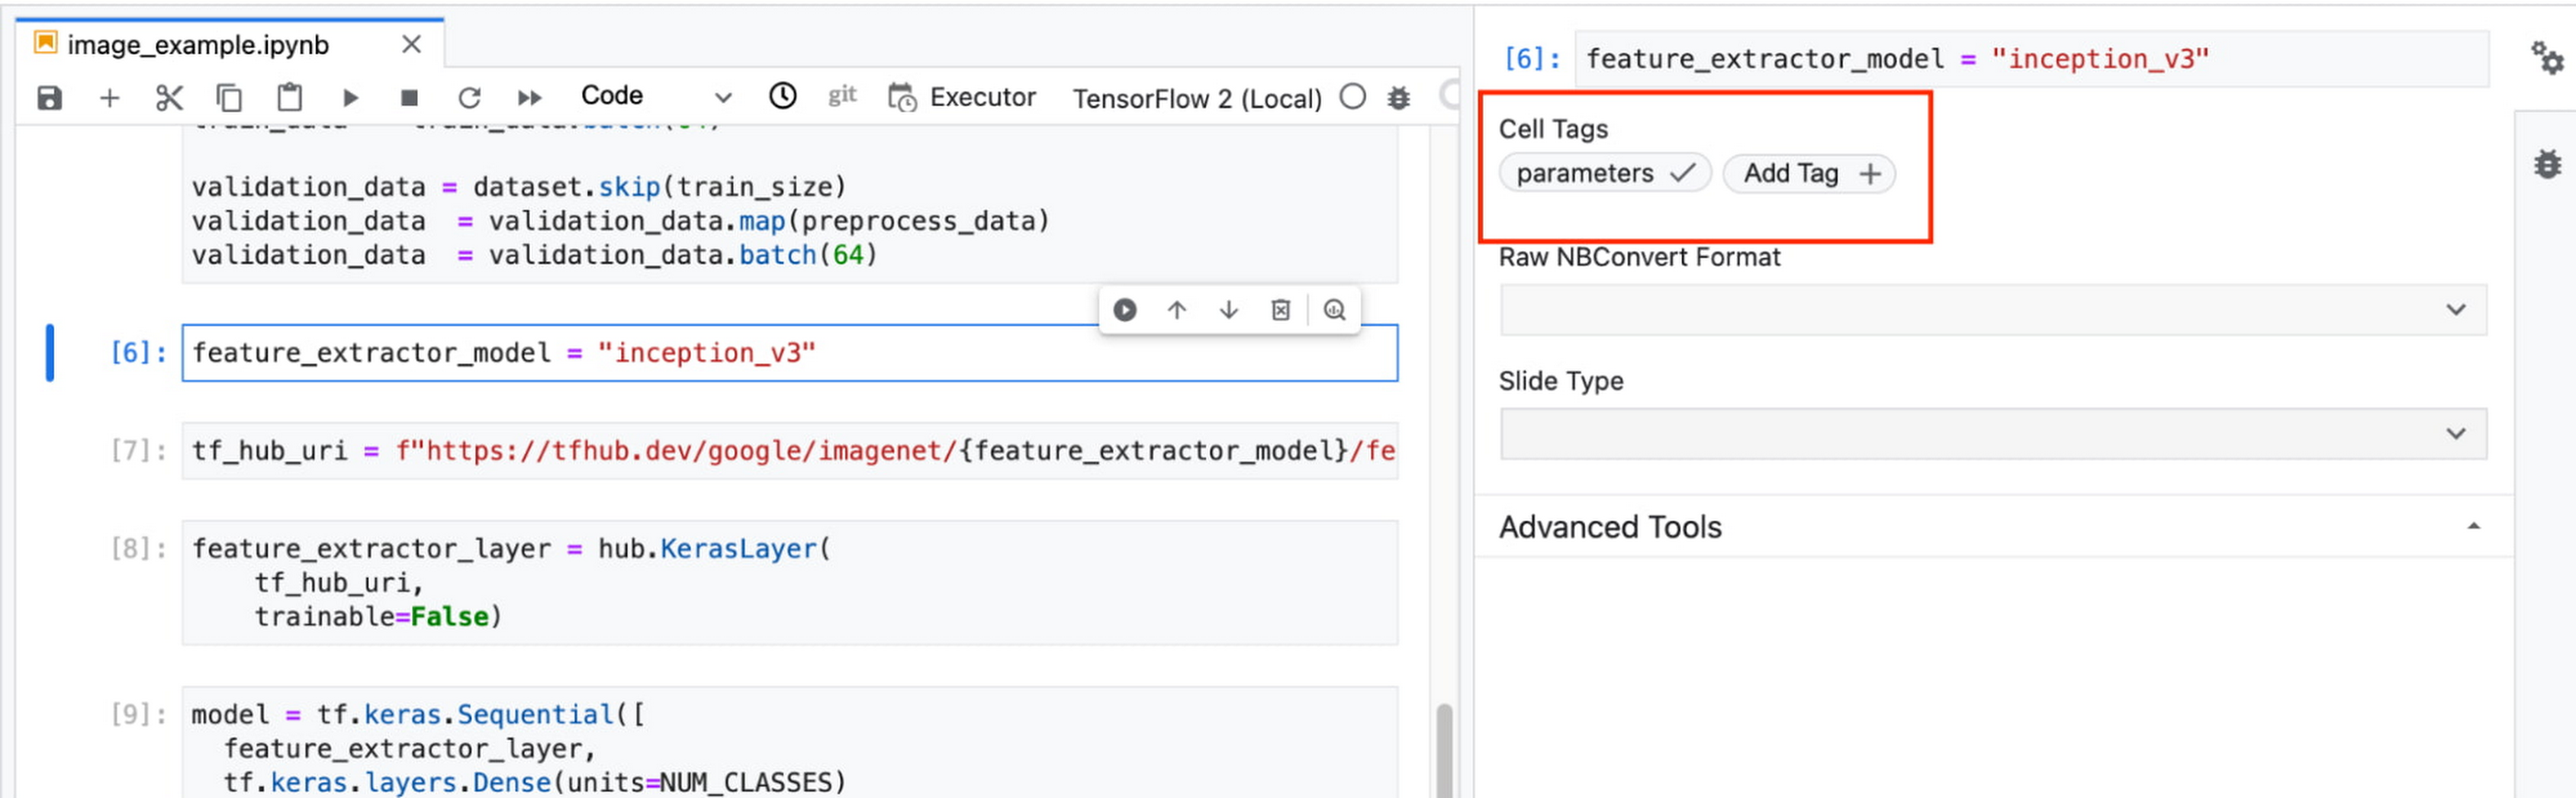
In this example, we create a parameter called feature_extractor_model, and we’ll pass in the name of the TF hub model we want to use when launching the execution. That model name will be substituted into the tf_hub_uri variable, which is then passed to the hub.KerasLayer, as shown in the screenshot above.
After you’ve discovered the optimal model architecture for your use case, you’ll want to track the performance of your model in production. You can create a notebook that pulls the most recent batch of serving data that you have labels for, gets predictions, and computes the relevant metrics. By scheduling these jobs to execute on a recurring basis, you’ve created a lightweight monitoring system that tracks the quality of your model predictions over time. The executor supports your end-to-end ML workflow, making it easy to scale up or scale out notebook experiments written with Vertex AI Workbench.
Configuring Executions
Executions can be configured through the Cloud Console UI or the Notebooks API.
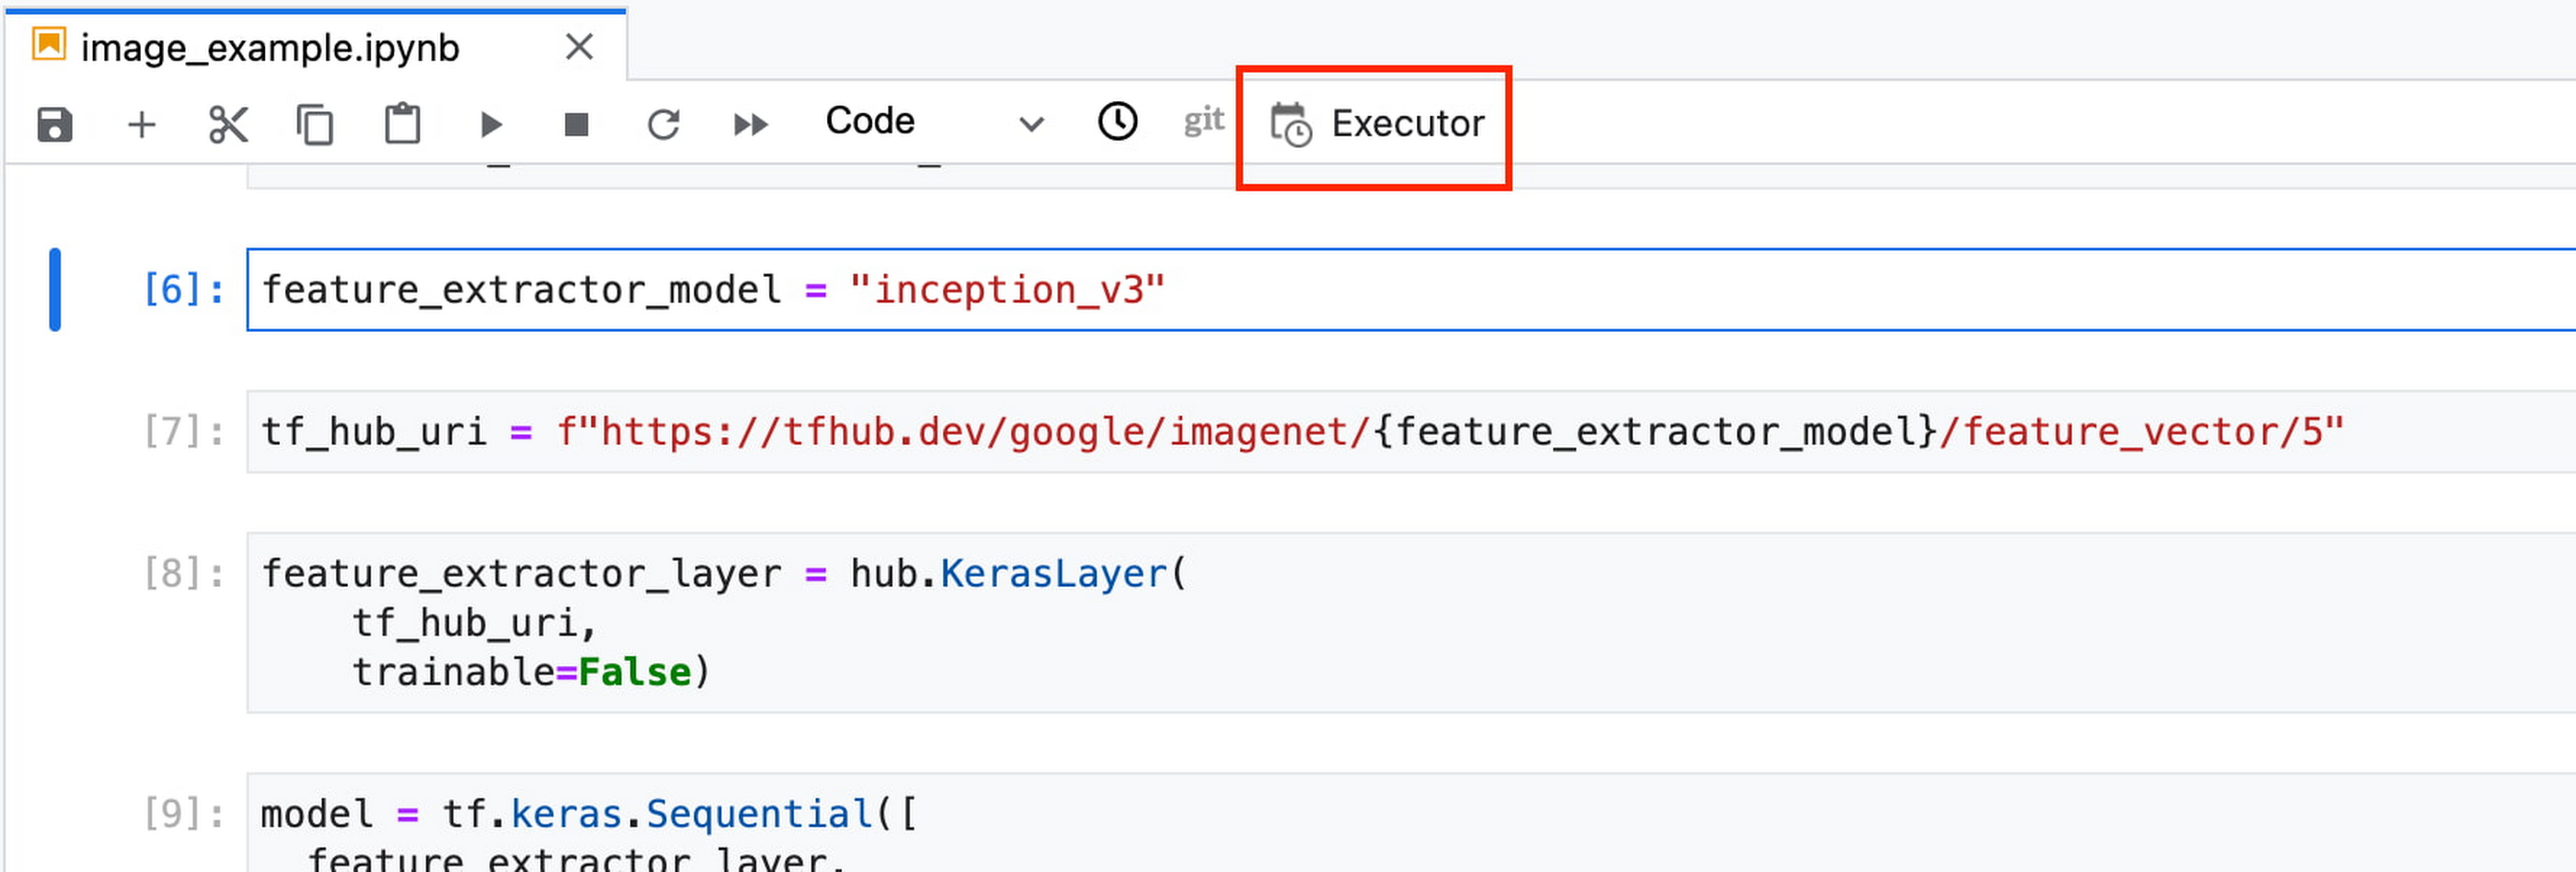
In your notebook, click on the Executor icon.
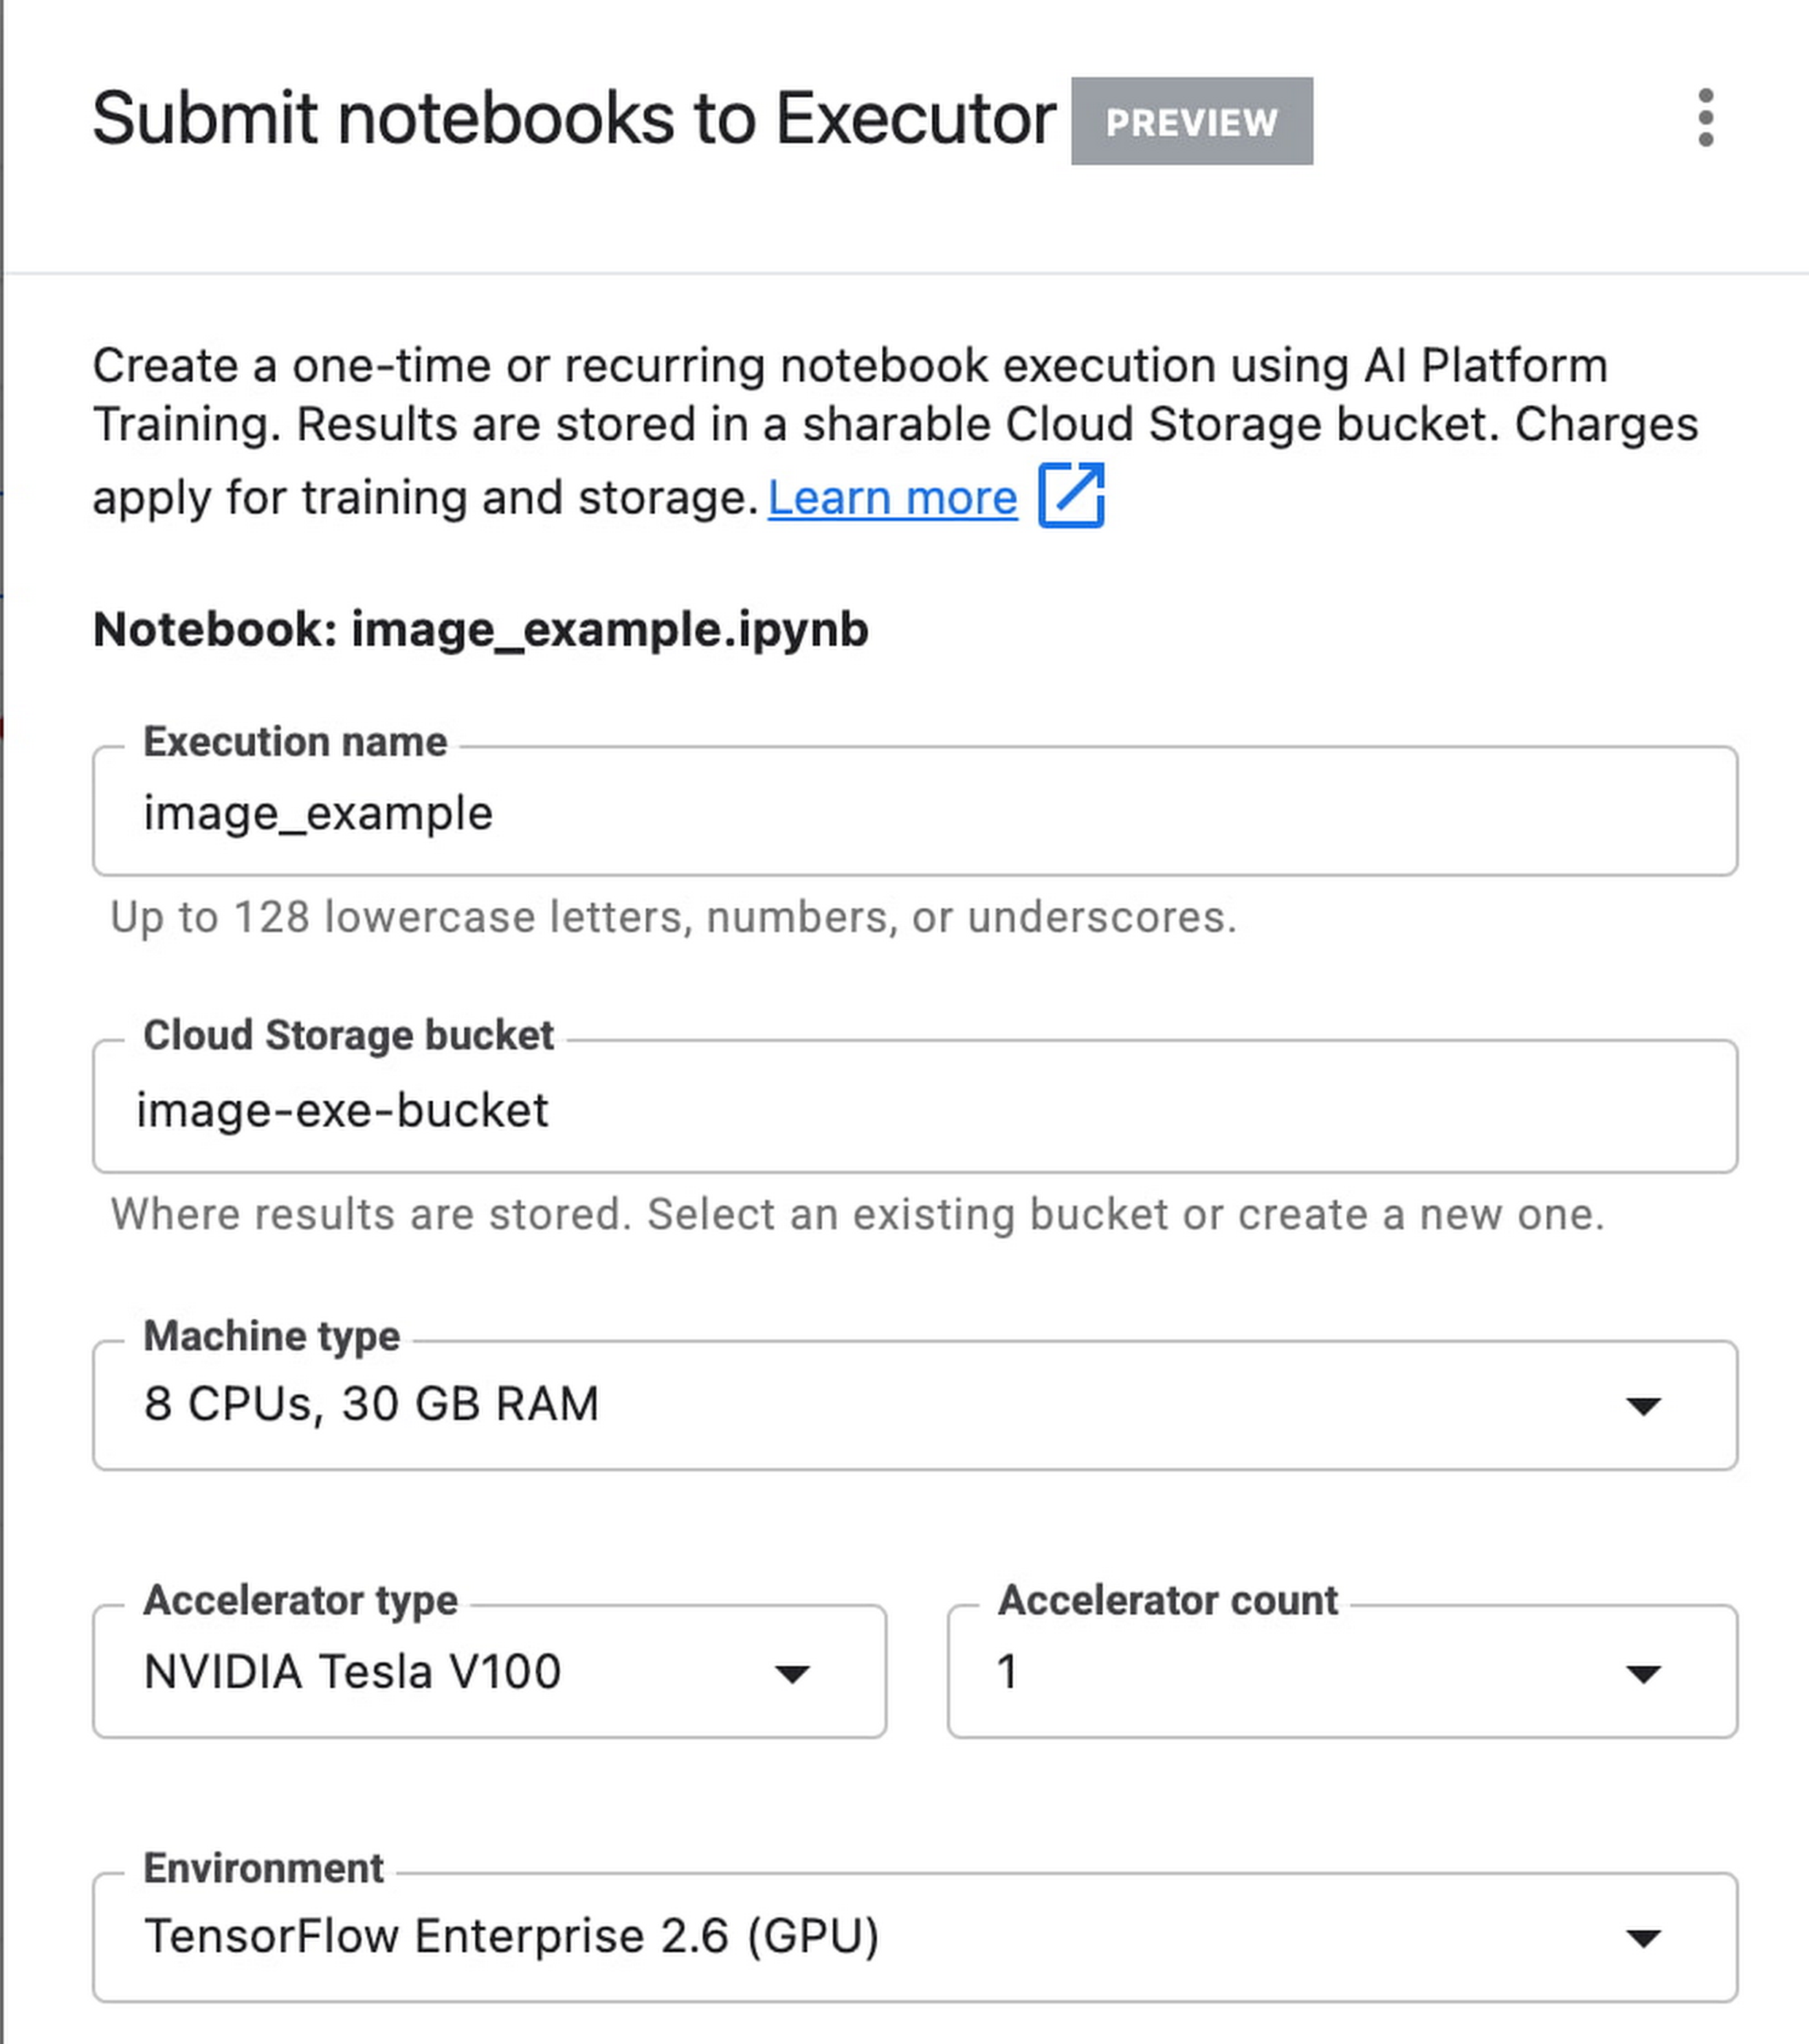
In the side panel on the right specify the configuration for your job, such as the machine type and the environment. You can select an existing image, or provide your own custom docker container image.
If you’ve added parameter tags to any of your notebook cells, you can pass in your parameter values to the executor.

Finally, you can choose to run your notebook as a one time execution, or schedule recurring executions.
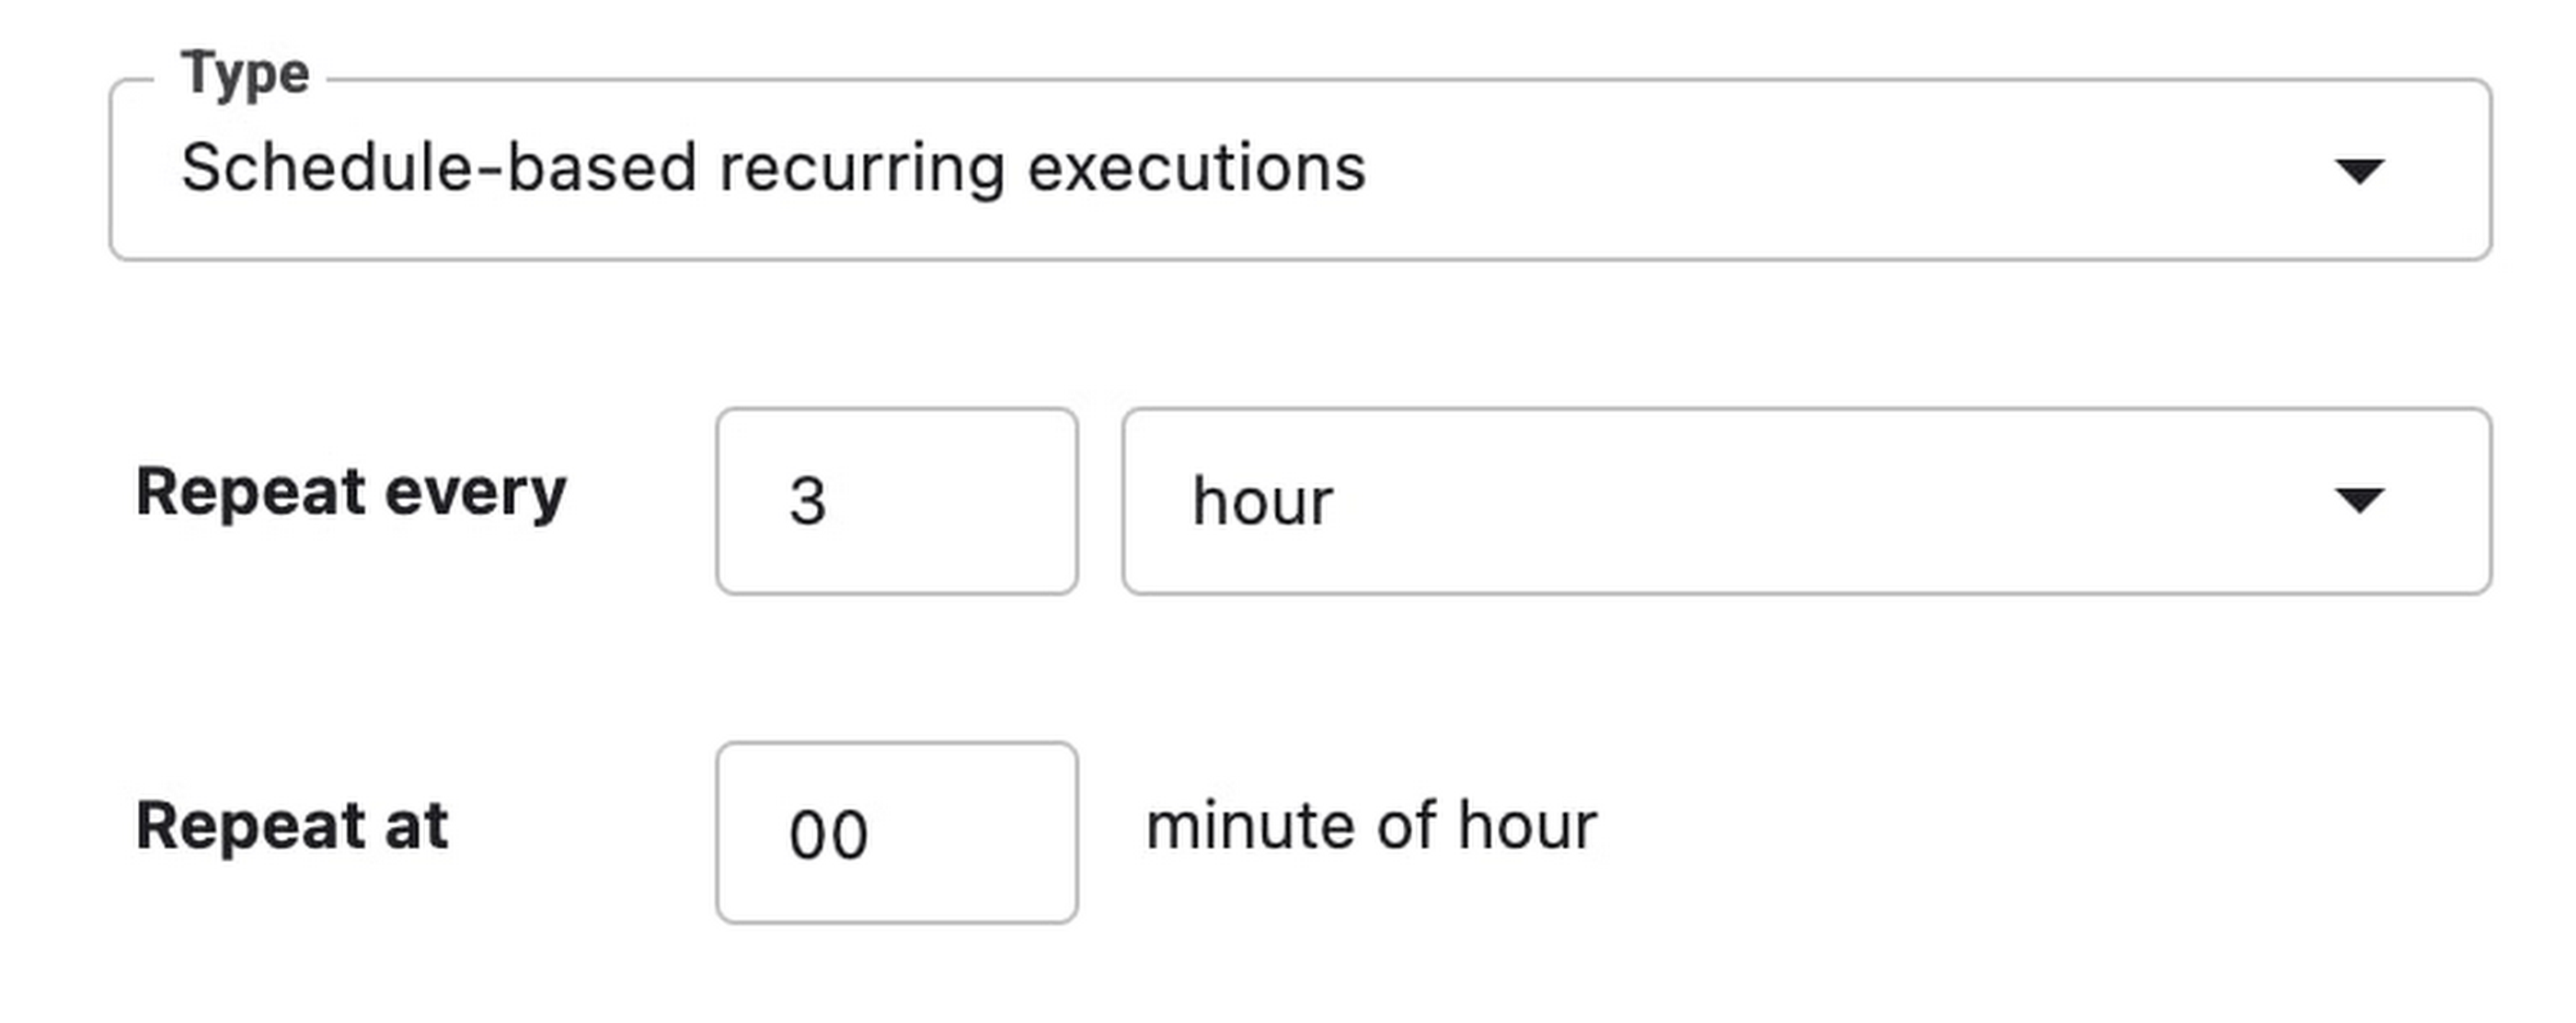
Then click SUBMIT to launch your job.
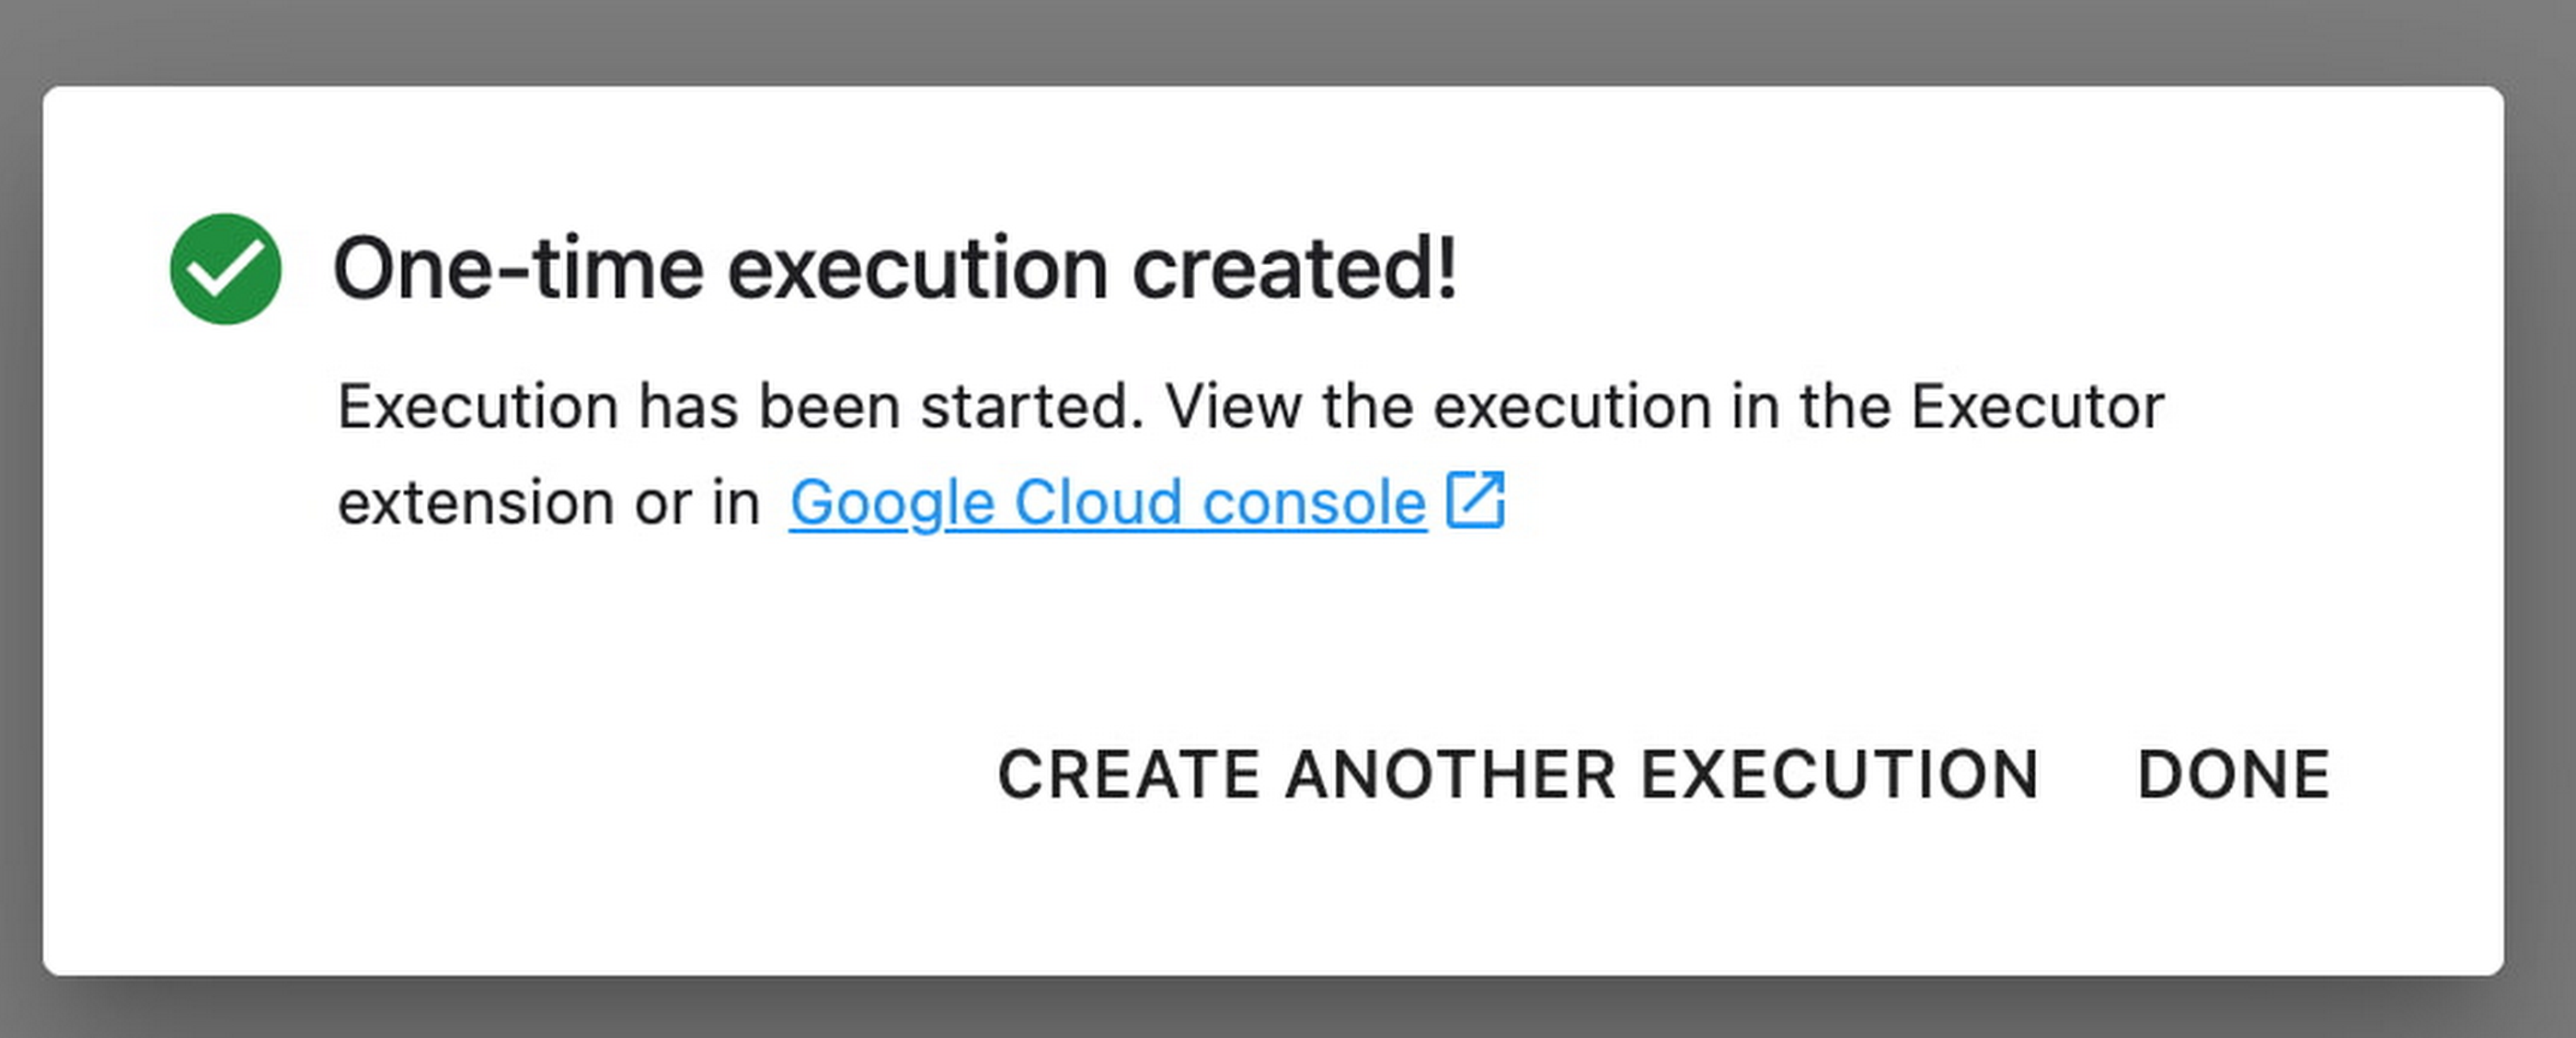
In the EXECUTIONS tab, you’ll be able to track the status of your notebook execution.

When your execution completes, you’ll be able to see the output of your notebook by clicking VIEW RESULT.

You can see that an additional cell was added with the comment # Parameters, that overrides the default value for feature_extractor_model, with the value we passed in at execution time. As a result, the feature vectors used for this execution came from a ResNet50 model instead of an Inception model.
What’s Next?
You now know the basics of how to use the notebook executor to train with a more performant hardware profile, test out different parameters, and track model performance over time. If you’d like to try out an end-to-end example, check out this tutorial. It’s time to run some experiments of your own!
Google and AI Researchers Work towards Building Data-centric AI

6084
Of your peers have already read this article.
1:30 Minutes
The most insightful time you'll spend today!
AI researchers and engineers need better data to enable better AI solutions. The quality of an AI solution is determined by both the learning algorithm (such as a deep-neural network model) and the datasets used to train and evaluate that algorithm. Historically, AI research has focused much more on algorithms than datasets, despite their vital importance. As a result, many algorithms are freely available as starting points, but many important problems lack large, high-quality open datasets. Further, creating new datasets is expensive and error-prone.
Recently, the data-centric AI movement has emerged, which aims to develop new methodologies and tools for constructing better datasets to fix this problem. Conferences, workshops, challenges, and platforms are being launched to support improving data quality and to foster data excellence. Thought leaders such as Andrew Ng at Landing.AI and Chris Re at Stanford University are encouraging AI developers to focus more on iterative data engineering than they do tuning their learning algorithms. Our CHI-best-paper-award-winning paper, “Everyone wants to do the model work, not the data work” highlighted the significance of data quality in the practice of ML.
At Google, we are excited to contribute to data-centric AI. Today, Google Cloud is adding a new high value dataset to the Public Dataset Program, and Google researchers are announcing DataPerf, a new multi-organizational effort to develop benchmarks for data quality and data centric algorithms.
Google Cloud is committed to helping users improve their data quality, starting with supporting better public data. The Public Datasets program provides high quality datasets pre-configured on GCP for easy access. Google Cloud is adding a new high-value dataset developed by the MLCommons™ Association (which Google co-founded) to the Public Datasets program: The Multilingual Spoken Words Corpus: a rich audio speech dataset with more than 340,000 keywords in 50 languages with upwards of 23.4 million examples.
This new public dataset is aligned with the MLCommons Association vision for “open” datasets – accessible by all – that are “living” – continually being improved to raise quality and increase representation and diversity.
Google researchers, in collaboration with multiple organizations, are announcing the DataPerf effort at the NeurIPS Data-Centric AI workshop today, to develop benchmarks to improve data quality. Much like the the MLPerf™ benchmarking effort which is now the industry standard for machine learning hardware/software speed, DataPerf brings together the originators of prior efforts including: CATS4ML, Data-Centric AI Competition, DCBench, Dynabench, and the MLPerf benchmarks to define clear metrics that catalyze rapid innovation. DataPerf will measure the utility of training and test data for common problems, and algorithms for working with datasets such as: selecting core sets, correcting errors, identifying under-optimized data slices, and valuing datasets prior to labeling.
Together, supporting open, living datasets for core ML tasks, and the development of benchmarks to direct the rapid evolution of those datasets will empower the researchers and engineers who use Google Cloud to do even more amazing things – and we can’t wait to see what they create!
Acknowledgements: In collaboration with Lora Aroyo and Praveen Paritosh.
This Diagnostic Company is Revolutionising Healthcare Delivery with AI
5397
Of your peers have already read this article.
5:30 Minutes
The most insightful time you'll spend today!
Dr. Elliot Smith cannot be accused of lacking ambition. A high achiever with a Ph.D. in Electrical Engineering and a specialist in magnetic resonance imaging (MRI) systems, Smith aims to deliver top quality healthcare to anyone in the world — regardless of their location or wealth.
Dr. Smith has already made strides on this journey with his Brisbane, Queensland-headquartered business, Maxwell MRI. “I saw there was a big gap in the market around automating the diagnosis of health conditions,” he says. “Existing processes were typically manual and involved a lot of people.”
Artificial intelligence (AI) and machine learning can remove a key obstacle to scaling out medicine and improve the efficiency and accuracy of diagnosing conditions, the healthcare entrepreneur believes.
“Our grand vision is to build an AI doctor that anyone can receive affordable support from and connect to in order to obtain results,” explains Dr. Smith.
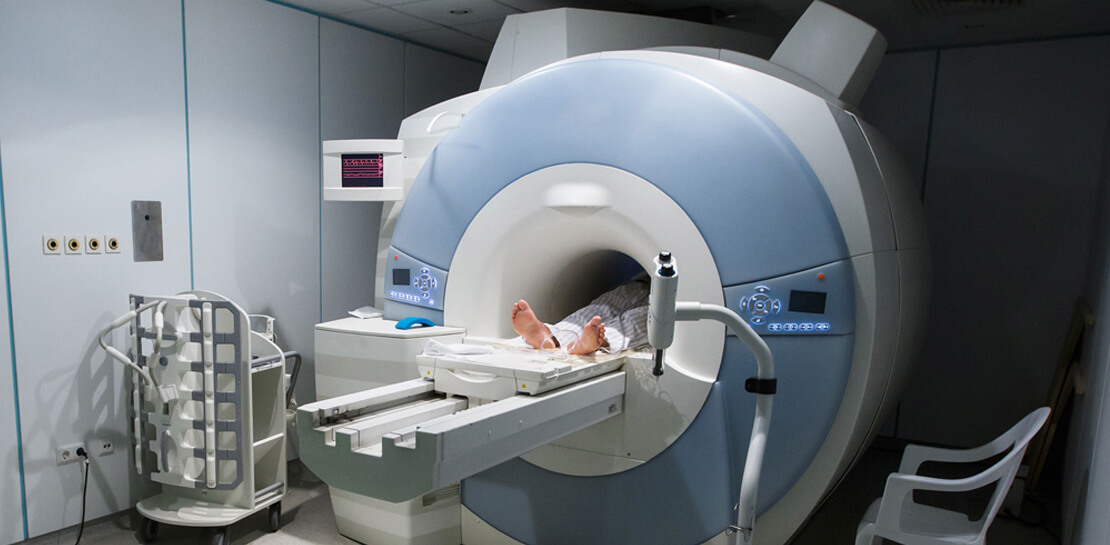
Maxwell MRI presently enables clinicians to submit anonymised MRI scans to a machine learning enabled AI platform to help diagnose prostate cancer. The service is sold to clinicians who can then charge a per-session fee to clients. As well as obtaining results for individual cases, the MRI scans and associated information is used to ‘train’ the platform to deliver accurate diagnoses faster and in a more affordable way than existing systems do.
Dr. Smith and his team started by running a number of functions and processes on a single server with graphics processing units (GPUs) and sizable hard disk capacity. However, this infrastructure could not scale to support the planned growth of the business. Each case Maxwell MRI processes involves about 200MB of data in MRI scans alone. Once supplementary data, blood test result, pathology results and genetic information is included, this load can reach more than 1GB of data per patient.
The business aimed to process 150,000 cases by the end of 2018. This required a service that could deliver massive scale in data storage and compute, and could easily be accessed from any location. “We wanted to move from three GPUs to 30 GPUs without having to buy more servers or other associated equipment, so the cloud was the natural next step,” says Dr. Smith.
Maxwell MRI evaluated Google Cloud Platform (GCP) and determined that the managed services component of GCP would remove the burden of infrastructure deployment and administration. In addition, Google Cloud Machine Learning Engine would enable the business to scale to as many GPUs as needed to meet demand.
Maxwell MRI started with some small experiments to determine that GCP met all its requirements and completed its migration to the platform in February 2017. “We really started to scale up the data we had and consequently our computing requirements at that time,” Dr. Smith says.
The Maxwell MRI platform features an upload service that enables clinicians to upload imaging and associated data. This service triggers several different upload pipelines that clean and standardise data. They then write imaging data to Google Cloud Storage, and more structured data to a combination of Google Cloud Datastore and Google Cloud Spanner.
The platform then converts the information into records that can be used to ‘train’ new machine learning configurations or run evaluations through existing machine learning pipelines.
“The tasks we perform including segmenting various anatomical regions for analysis and sending those results back into Google Cloud Storage,” says Dr. Smith. “This then commences that repeated process of running Google Cloud Dataflow pipelines and machine learning algorithms, and presenting those outcomes back to the clinicians.”
Existing Literature Validated
The data processed and analysed to date has, Dr Smith says, enabled Maxwell MRI to help validate existing literature that indicates clinicians lack confidence in existing early-stage testing procedures for prostate cancer. This prompts them to move quickly to the biopsy stage to assure themselves their diagnosis is valid. “New technologies have a lot of potential to rectify this situation and guide treatment to be more accurate, specific and cost-effective,” he says.
Results Delivered in 10-15 Minutes
More specifically, using GCP has enabled Maxwell MRI to guarantee to clinicians that results will be delivered within minutes. “Clinicians are used to getting results back in two days to a week,” says Dr. Smith. “We’re saying that with our platform running on GCP we’ll deliver you results in 10 to 15 minutes, regardless of the number of patients coming in.”
Running on GCP has enabled the business to accelerate its development cycles, test new ideas easily on a subset of data, test in parallel and deliver new services considerably faster than in another environment. In addition, the flexible GCP charging model aligned with the ability to scale compute capabilities quickly and easily has enabled the fledgling business to control its costs.
Google technologies are poised to play an integral role in the business’s future. “With Google available, it doesn’t make sense for us to use our own infrastructure,” Dr. Smith says. “Our expertise in AI, machine learning and clinical engagement complements cloud platform specialties of infrastructure, managed services and ease of use. We see a bright future ahead in helping to transform healthcare globally.”
Looking for a Cloud Data Warehouse? Find out Why Forrester Thinks Google BigQuery is a Leader
4482
Of your peers have already read this article.
4:30 Minutes
The most insightful time you'll spend today!
We are thrilled to announce that Google has been named a Leader in The Forrester Wave™: Cloud Data Warehouse, Q1 2021 report. For more than a decade, BigQuery, our petabyte-scale cloud data warehouse, has been in a class of its own. We’re excited to share this recognition and we want to thank our strong community of customers and partners for voicing their opinion. We believe this report validates the alignment of our strategy with our customers’ analytics needs.
“Customers like Google’s frequency of data warehouse releases, business value, future proof architecture, high-end scale, geospatial capabilities, strong AI/ML capabilities, good security capabilities, and broad analytical use cases,” according to the Forrester report. Today’s data leaders require a data warehousing platform that provides both depth and breadth and with BigQuery, organizations are able to unlock deeper data science and machine learning capabilities while promoting data democratization and providing the highest levels of availability.
Google BigQuery: 5 out of 5!
Forrester gave Google BigQuery a score of 5 out of 5 across 19 different criteria, including:
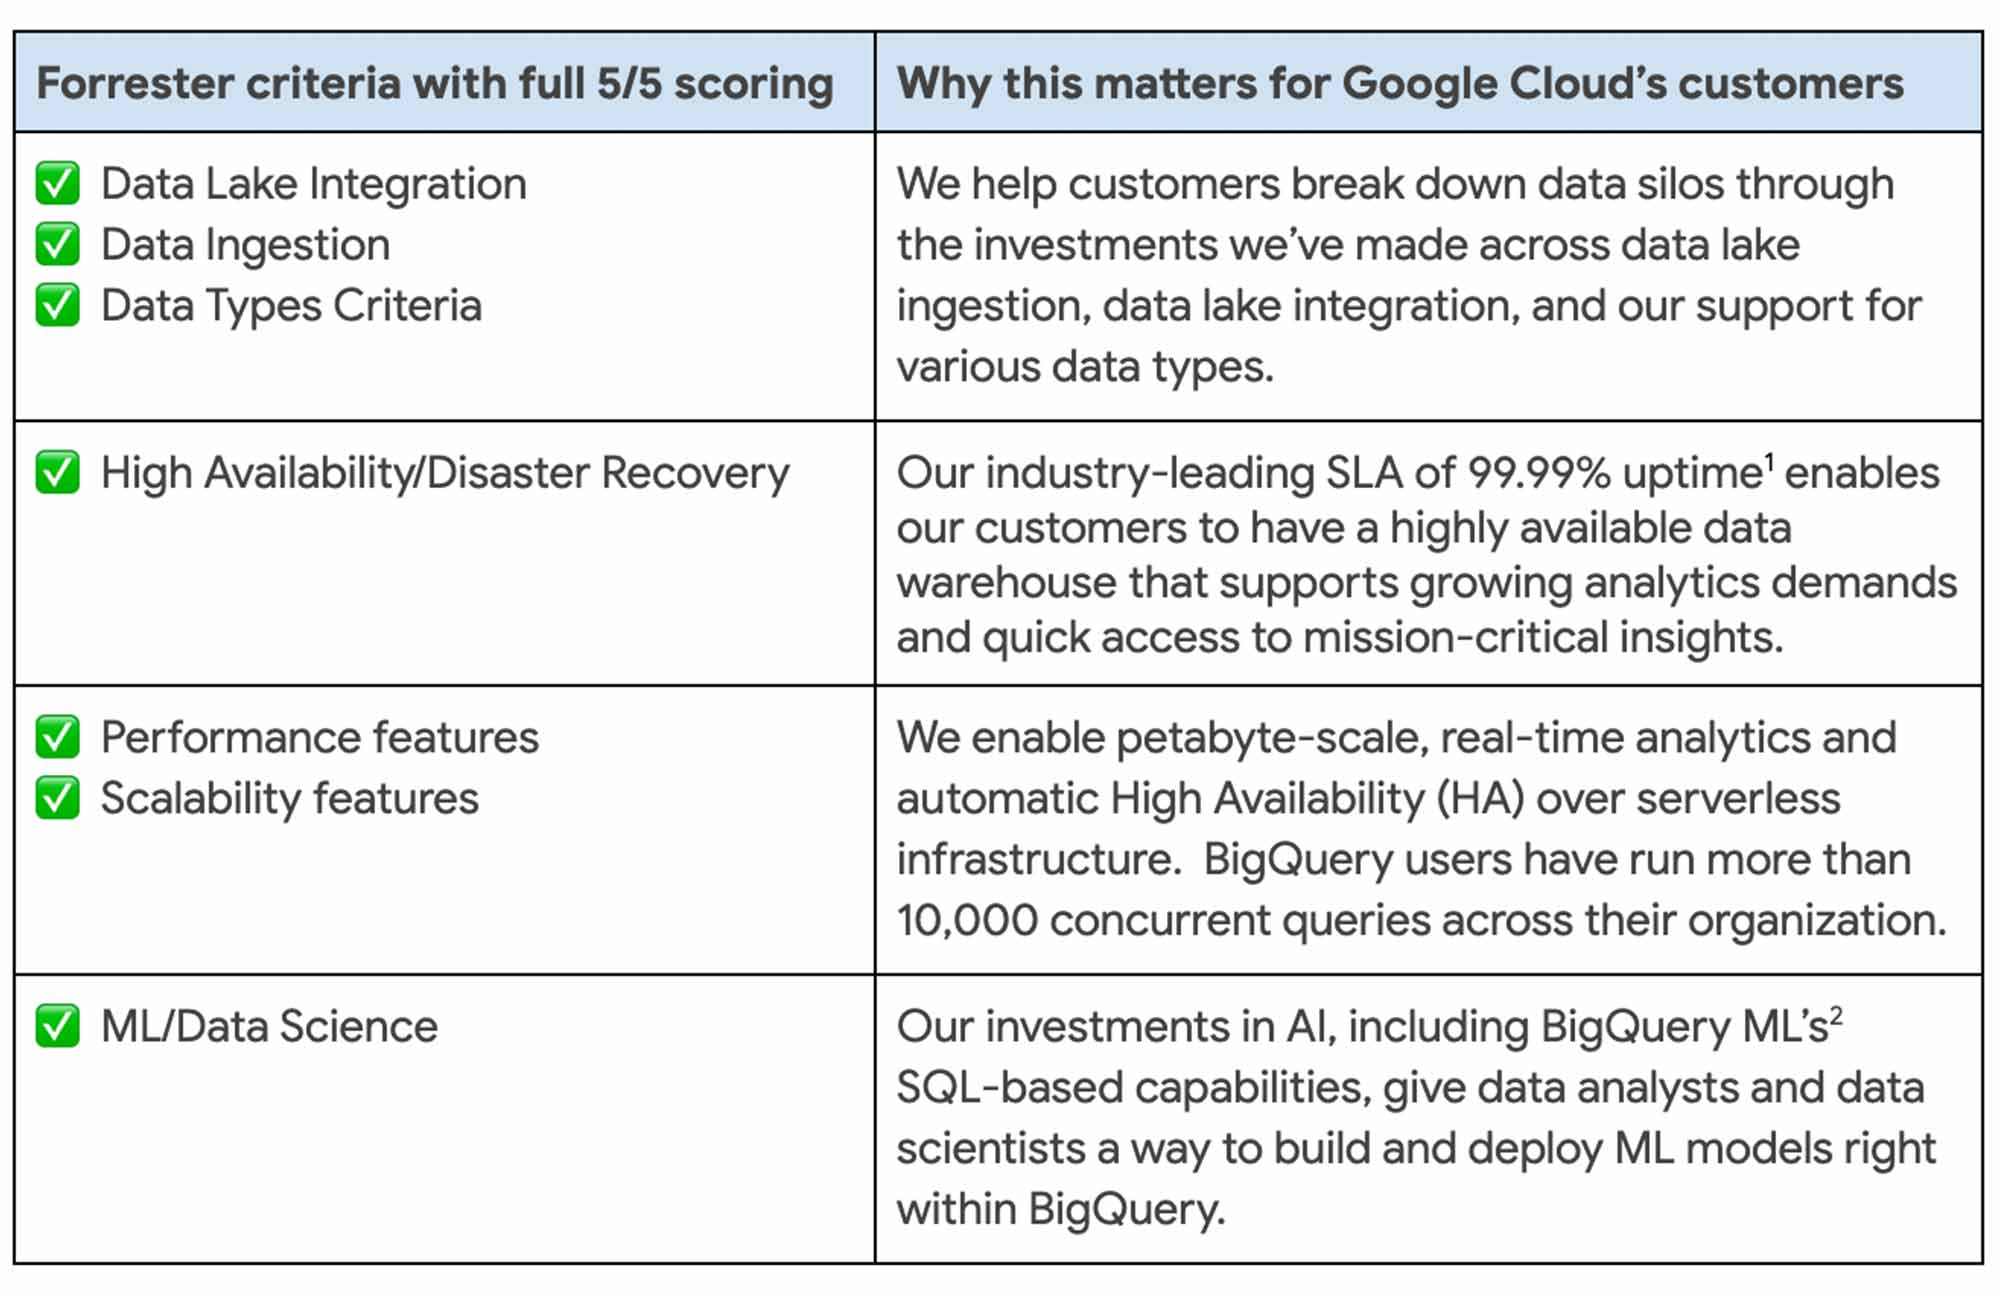
Today, customers across the globe use BigQuery to run business critical analytics workloads to enable BI acceleration, IoT analytics, customer intelligence, AI/ML-based analytics, data science, data collaboration, and data services. Customers such as Verizon, Wayfair, HSBC, Twitter, AirAsia, KeyBank, The Home Depot, and Vodafone have anchored their digital transformation efforts on BigQuery—unlocking deeper insights for their people.
Customers use BigQuery across all industries, to solve issues like credit card fraud detection, predictive forecasting, anomaly detection, log analytics and many more. Forrester recognized this work and gave BigQuery a 5/5 score for supporting vertical and horizontal use cases.
More BigQuery advantages
Google is the first hyperscale provider to offer a multi cloud data analytics solution. With BigQuery Omni, customers can perform cross-cloud analytics with ease, and drive business outcomes they couldn’t achieve with the siloed approach offered by other vendors.
We designed BigQuery to be highly scalable and more open and interoperable so that customers can join data across SQL databases, traditional unstructured data lakes in object storage, and even spreadsheets using any analysis tool.
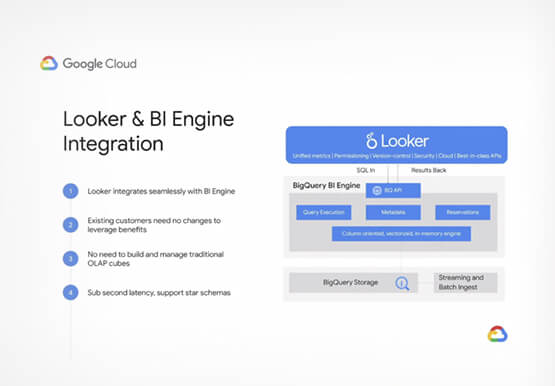
Recent innovations like BigQuery BI Engine lets us provide the best analytics experience by delivering sub-second query response times from any business intelligence tool, from Google’s Looker and Connected Sheets to Tableau, Microsoft Power BI, ThoughtSpot, and others. Our goal is to meet customers where they are rather than force them into a one-size-fits-all approach to data analysis.
With BigQuery, organizations gain both breadth and depth of capabilities to transform their analytics strategy. Forrester also gave BigQuery 5 out of 5 in:
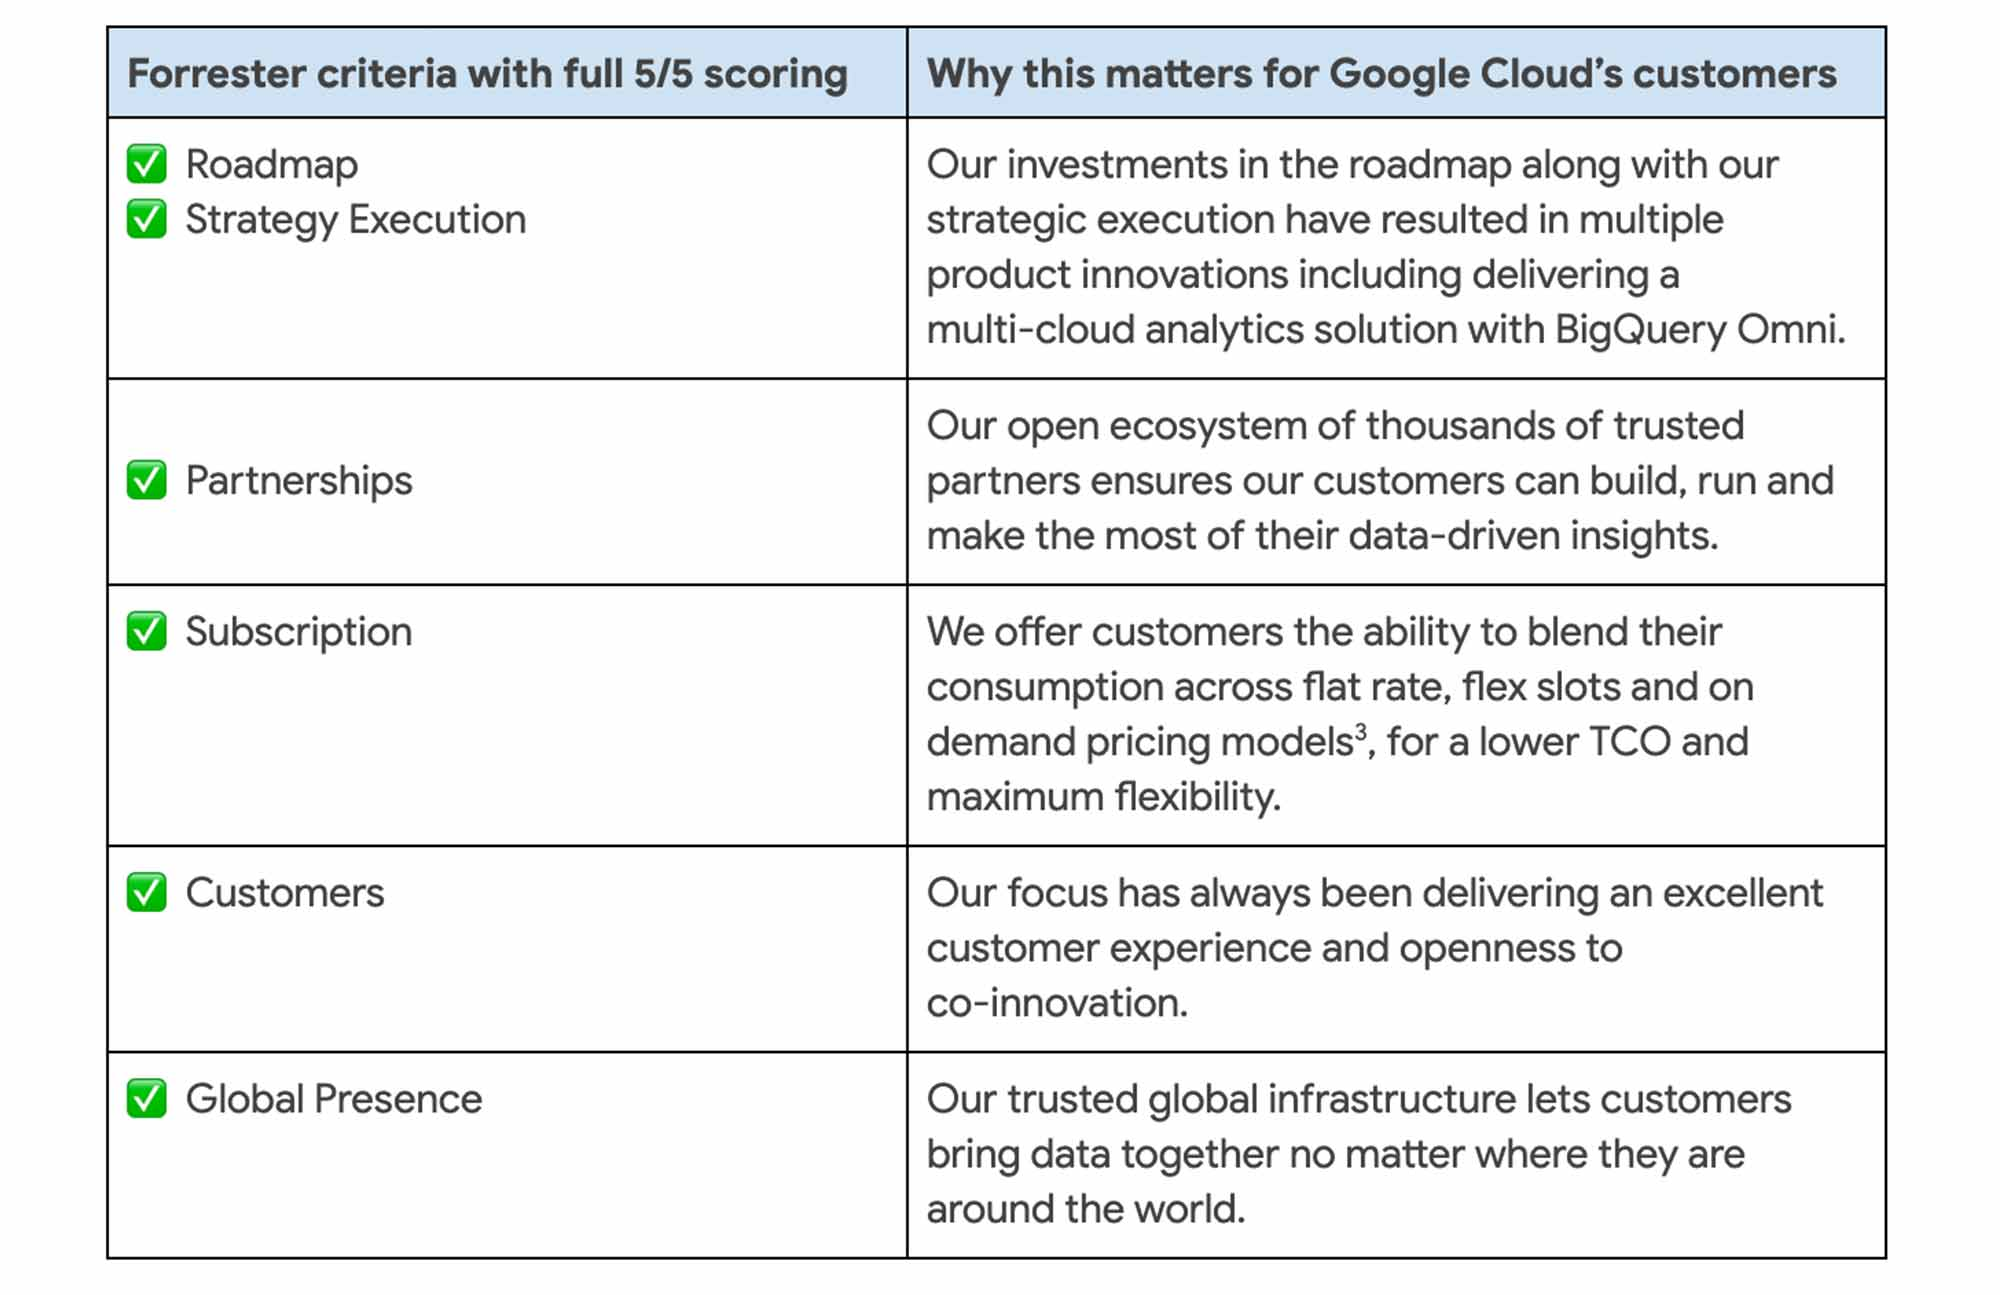
Data-powered innovation
These advantages enable our customers to accelerate their digital transformation and reimagine their business through data-powered innovation. Google’s leadership across AI, analytics, and databases comes together in a single data cloud platform that provides everyone with the ability to get value out of their data faster.
We bring decades of research and innovation in AI to our customers through industry-leading AI solutions, that in turn helps our customers solve their biggest problems. Our support of open standards and APIs enables interoperability between a variety of services for ingestion, storage, processing and analytics across the data cloud platform. And finally, we believe our multi-layered security approach throughout the data stack ensures redundancy and reliability so that customers can have the peace of mind that their data is always protected.
We are honored to be a leader in this Forrester Wave™ and look forward to continuing to innovate and partner with you on your digital transformation journey.
Download the full Forrester Wave™ :Cloud Data Warehouse, Q1 2021 report. And check out these smart analytics reference patterns. To learn more about BigQuery, visit our website, and get started immediately with the free BigQuery Sandbox.
More Relevant Stories for Your Company

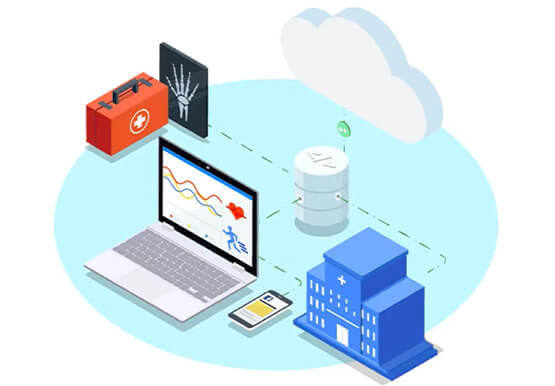
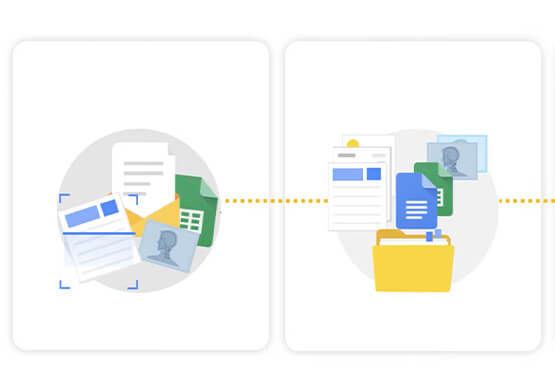

Hospitals Can Offer Interconnected Patient Experiences Using Google’s Natural Language Services
Machine Learning (ML) in healthcare helps extract data from conversations, medical records, forms, research reports, insurance claims and other documents across the care value-chain to help care providers have a holistic view of their patients to draw insights for diagnoses and treatments. With Natural Language Processing(NLP), healthcare organizations can program
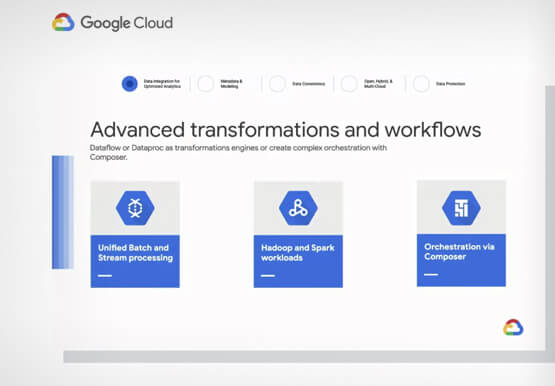
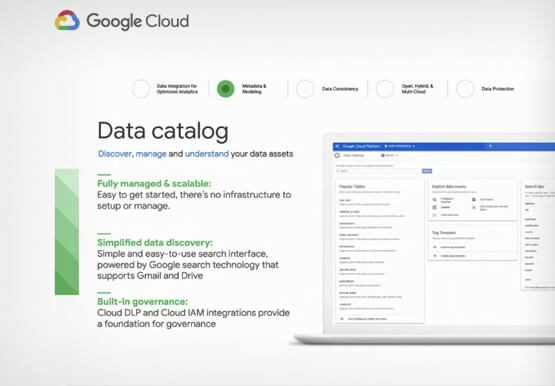
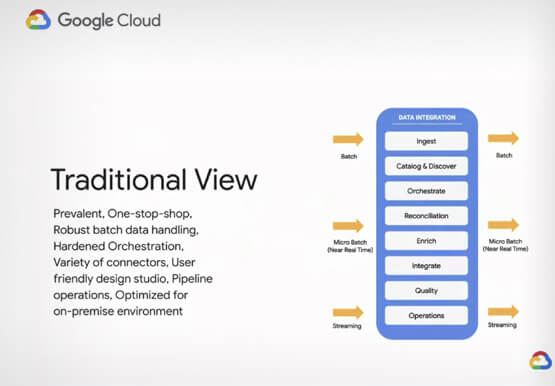
Real-world Data Integration Patterns
Learn the basics of Google Cloud Data Integration. How do you go from basic, hardcoded data pipelines to making your solution is dynamic and reusable? How do you parameterize your pipelines? What is the difference between parameters and variables, and when should you use them? Nidhi Modh, Product Manager, Google

How Real Companies Are Innovating with AI Today—and the Benefits They’re Seeing
What do you get when you mix Target, women’s swim wear, and AI? “Joy!” says Mike McNamara, CIO and CDO, Target. McNamara is just one of the many stories of real businesses conquering old challenges, and new disruptive industry challenges, with artificial intelligence. McNamara, Nick Rockwell, CTO, The New York
Smart analytics: Deep dive on roadmap
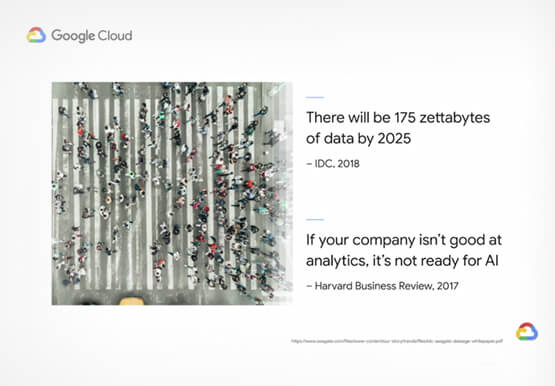
Data across organizations is growing and that organizations need a very strong analytics platform to leverage this data create insights and make real-time decisions on top of this data. That’s driving the advent of three large trends. First is the convergence of data lakes and data warehouses, that’s enable organizations
