





6590
Of your peers have already watched this video.
8:00 Minutes
The most insightful time you'll spend today!
Hospitals Can Offer Interconnected Patient Experiences Using Google’s Natural Language Services
Machine Learning (ML) in healthcare helps extract data from conversations, medical records, forms, research reports, insurance claims and other documents across the care value-chain to help care providers have a holistic view of their patients to draw insights for diagnoses and treatments. With Natural Language Processing(NLP), healthcare organizations can program computers and systems to process and analyse large volumes of human communication in form of spoken texts, written documentation and utterances. Watch the video to learn how the healthcare community can leverage Google’s NLP services to process structured and unstructured data to offer interconnected experiences for patients.
Apache and Dataflow Help with Real-time Indices Processing for Financial Institutions
4909
Of your peers have already read this article.
4:00 Minutes
The most insightful time you'll spend today!
Financial institutions across the globe rely on real-time indices to inform real-time portfolio valuations, to provide benchmarks for other investments, and as a basis for passive investment instruments including exchange-traded products (ETPs). This reliance is growing—the index industry dramatically expanded in 2020, reaching revenues of $4.08 billion.
Today, indices are calculated and distributed by index providers with proximity and access to underlying asset data, and with differentiating real-time data processing capabilities. These providers offer subscriptions to real-time feeds of index prices and publish the constituents, calculation methodology, and update frequency for each index.
But as new assets, markets, and data sources have proliferated, financial institutions have developed new requirements. Financial institutions will need to quickly create bespoke and frequently updating indices that represent a specific actual or theoretical portfolio, with its unique constituents and weightings.
In other words, existing index providers and other financial institutions alike will need mechanisms for rapid creation of real-time indices. This blog post’s focus—an index publication pipeline collaboratively developed by CME Group and Google Cloud—is an example of such a mechanism.
The pipeline closely approximates a particular CME Group index benchmark, but with far greater frequency (in near real time vs. daily) than its official counterpart. It does so by leveraging open-source models such as Apache Beam and cloud-based technologies such as Dataflow, which automatically scales pipelines based on inbound data volume.
Machine learning’s production problem
In the past decade, advances in AI toolchains have enabled faster ML model training—and yet a majority of ML models are still not making it into production. As organizations endeavor to develop their ML capabilities, they soon realize that a real-world ML system is comprised of a small amount of ML code embedded in a network of complex and large ancillary components. Each component brings its own development and operational challenges, which are met by bringing a DevOps methodology to the ML system, commonly referred to as MLOps (Machine Learning Operations). To apply ML to business problems, a firm must develop continuous delivery and automation pipelines for ML.
This index publication collaboration is instructive because it demonstrates MLOps best practices for just such a pipeline. One Apache Beam pipeline, suited for operating on both batch and streaming data, extracts insights and packages them for downstream consumers. These consumers may include ML pipelines that, thanks to Apache Beam, require only one code path for inference across batch and real-time data sources. The pipeline is run inside Google Cloud’s Dataflow execution engine, greatly simplifying management of underlying compute resources.
But the collaboration’s value is not constrained to the ML and data science realm. The project shows that consumers of the Apache Beam pipeline’s insights may also include traditional business intelligence dashboards and reporting tools. It also demonstrates the simplicity and economy of cloud-based time series data such as CME Smart Stream, which is metered by the hour, quickly and automatically provisioned, and consumable at a per-product-code (not per-feed) level.
A focus on real-time processing for financial services
To illustrate the above points, the collaboration applies data engineering and MLOps best practices to a financial services problem. We chose the financial services domain because many financial institutions do not yet have real-time market data processing or MLOps capabilities today, owing to a significant gap on either side of their ML/AI objectives.
Upstream from ML/AI models, financial institutions often experience a data engineering gap. For many financial institutions, batch processes have sufficiently addressed business requirements. As a result, the temporal nature of the time series data underlying these processes is deemphasized. For example, the original purpose of most trade booking systems was to capture a trade and ensure that it found its way to the middle and back office for settlement. It was not built with ML/AI in mind, and its underlying data therefore has not been packaged for consumption by ML/AI processes.
And downstream from ML/AI models, financial institutions often encounter the aforementioned “ML production problem.”
As ML/AI becomes ever more strategic, these two gaps have left many financial institutions in a conundrum—unable to train ML models for lack of properly packaged time series data, and unmotivated to package time series data for lack of ML models. By recreating a key energy market index using open-source libraries and cloud-based tools, this collaboration demonstrates that for the financial services domain a solution to this conundrum is more accessible today than ever.
Creating a new index
We modeled our new index after one of CME Group’s many index benchmarks. The particular index expresses the value of a basket of three New York Mercantile Exchange—listed energy futures as a single price. Today, CME Group publishes the index at the end of the day by calculating the settlement price of each underlying futures contract, and then weighing and summing these values.
While CME Group does not currently publish this index in real time, this collaboration aims to create a near real-time solution leveraging Google Cloud capabilities and CME Group market data delivered via CME Smart Stream. However, in order to publish the value so frequently—every five seconds, with 40-second publish latency—this collaboration’s pipeline has to solve a number of challenges in near-real time.
First, the pipeline must process sparse data from three separate trades feeds in memory to create open-high-low-close (OHLC) bars. More specifically, for five-second windows for each of the three front-month (and sometimes second-month) energy contracts, a bar must be produced. This is solved by using the Apache Beam library to implement functions which, when executed on Dataflow, automatically scale out as input load increases. The bars must be time-aligned across the underlying feeds, which is greatly simplified by Beam’s watermark feature. And for intervals in which no tick data is observed, the Beam library is used to pull forward the last value received, yielding perfect gap-free bars for downstream processors.
Second, the pipeline must calculate volume-weighted average price (VWAP) in near real-time for each front-month contract. The VWAP calculations are also written using the Beam API and executed on Dataflow. Each of these functions requires visibility of each element in the time window, so the functions cannot be arbitrarily scaled out. Nonetheless, this is tractable because their input—OHLC bars—is manageably small.
Third, the pipeline must replicate CME Group’s specific settlement price methodology for each contract. The rules specify whether to use VWAP or another source as price, depending on certain conditions. They also specify how to weigh combinations of monthly contracts during a roll period. The pipeline again encapsulates these requirements as an Apache Beam class, and joins the separate price streams at the correct time boundary.
The end result is a new stream publishing bespoke index data to a Google Cloud Pub/Sub topic thousands of times daily, enabling AI models as well as traditional industry index usage, dashboards, and other tools to assist real-time decision making. The stream’s pipeline uses open source libraries that solve common time series problems out-of-the box, and cloud-based services to reduce the user’s operational and scaling burden.

The importance of cloud-based data
The promise of cloud-based pipeline execution services cannot be realized using legacy data access patterns, which often require market data users to colocate and configure servers and network gear. Such patterns inject expense and scaling complexity into the pipeline’s overall operation, diverting resources from the adoption of MLOps best practices. Instead, a newer, cloud-based access pattern—in which resources subscribe to data streams inexpensively, rapidly and programatically—is necessary.
In 2018, CME Group identified the customer need for accessible futures and options market data. CME Group collaborated with Google Cloud to launch CME Smart Stream, which distributes CME Group’s real-time market data across Google Cloud’s global infrastructure with sub-second latency. Any customer with a CME Group data usage license and a Google Cloud project can consume this data for an hourly usage fee, without purchasing and configuring servers and network gear.
CME Smart Stream met this index pipeline’s requirements for cost-effective, cloud-based streaming data, but this is just one use case. Since the launch of a CME Smart Stream offering on Google Cloud, globally dispersed firms have adopted the solution. For example, Coin Metrics has been using the offering to better inform its customers in the crypto markets. According to CME Group, Smart Stream has become popular with new customers as the fastest, simplest way to access CME Group’s market data from anywhere in the world.
Adapt the design pattern to your needs
By combining cloud-based data, open-source libraries, and cloud-based pipeline execution services, we created a real-time index using the same constituents as its end-of-day counterpart. Additionally, financial institutions will find this approach addresses many other challenges—real-time valuation of a large set of portfolios; benchmark creation for new ETPs; or external publication of new indices.
Give it a try
This approach is available to help you meet your organization’s needs. Please review our user guide, whose Tutorials section provides a step-by-step guide to constructing a simple Apache Beam pipeline to generate metrics on streaming data in real-time, and connecting a new data source to the pipeline. We’ll be discussing this topic in CME Group’s webinar End-to-End Market Data Solutions in the Cloud at 10:30 am ET on June 16th.
Wayfair Writes its Success Story with BigQuery for Internal Analytics

4935
Of your peers have already read this article.
4:00 Minutes
The most insightful time you'll spend today!
Editor’s note: Home-goods and furniture giant Wayfair first partnered up with Google Cloud to transform and scale its storefront—work that proved its value many times over during the unprecedented surge in ecommerce traffic during 2020. Today, we hear how BigQuery’s performance and cost optimization have transformed the company’s internal analytics to create an environment of “yes”.
At Wayfair, we have several unique challenges relating to the scale of our product catalog, our global delivery network, and our position in a multi-sided marketplace that supports both our customers and suppliers. To give you a sense of our scale we have a team of more than 3,000 engineers with tens of millions of customers. We supply more than 20 Million items using more than 16,000 supplier partners.
Serving those constituents generates a lot of analytics work. Wayfair runs over a billion ‘analytic’ database queries a year, from both humans and systems, against multi-petabyte datasets. Scaling our previous environment to meet these challenges required us to maintain dozens of copies of data for different use cases and manage complex data synchronization routines to move trillions of records each day, resulting in long development times and high support costs for our analytics projects.
Centralizing our data using Cloud Storage and BigQuery enabled us to break down existing silos and build unified pipelines for our batch and real-time operations. BigQuery shines by letting us decouple our compute and storage resources and flexibly ingest structured data in streaming and batch modes. We also benefit from the same decoupling for more complicated machine learning (ML) workflows in Dataproc and Cloud Storage. In particular, BigQuery is extremely low maintenance. From ML and easy data integrations to the integrated query cache, many out-of-the-box features have proven valuable for multiple use cases.
Beyond storage and compute, Google Cloud offers multiple tools to maximize the value of our data. For example, we can easily connect Data Studio to BigQuery for lightning-fast dashboarding of enterprise KPI reporting. When we need to dive deeper into a metric, Looker provides an interface and semantic model that empowers more business users to answer important questions — without understanding SQL or our vast dataset and table structure.
The combination of all of Google Cloud’s tools enables every Wayfairian the opportunity to self-serve their data visualization and analysis needs. We are able to support all of the requirements of our internal and external users, from descriptive analytics to alerting and ML, in a platform that blends Google’s proprietary technology with open-source standards.we have seen a greater than 90% reduction in the number of analytic queries in production that take more than one minute to run
As a result, we have seen a greater than 90% reduction in the number of analytic queries in production that take more than one minute to run, which delights our users and increases adoption of our analytics tools across the business.
Higher performance means saying “Yes” more often
We went into the BigQuery experience expecting very strong performance on large, aggregate queries and excellent scalability — the kind of performance that could enable consistent 5-15 minute processing queries and 5-10 second response times for large analytics queries.
We weren’t disappointed — we saw slightly better than linear performance profiles as record counts went up from millions to trillions for a flat resource allocation. BigQuery had the expected high performance for aggregate queries. This made our large data processing pipelines predictable and straightforward to maintain and optimize.
Below is a plot of gigabytes processed by a query against query run time in seconds; outliers are filtered and the axes are pruned to ranges where we had a large sample size. This focuses on longer-duration queries. As an example of the linear performance, a 2 terabyte query averages 5 minutes — 2.5min/terabyte — and an 18 terabyte query (9 times as much data) averages 25s — only 1.4min/terabyte. This is despite the fact that complex queries [sorting and analytic functions are particularly problematic] are more common with large data sizes. We do see increasing variability at large sizes as slot limits and other resource constraints come into play, but these factors are controllable and ultimately a business optimization decision.
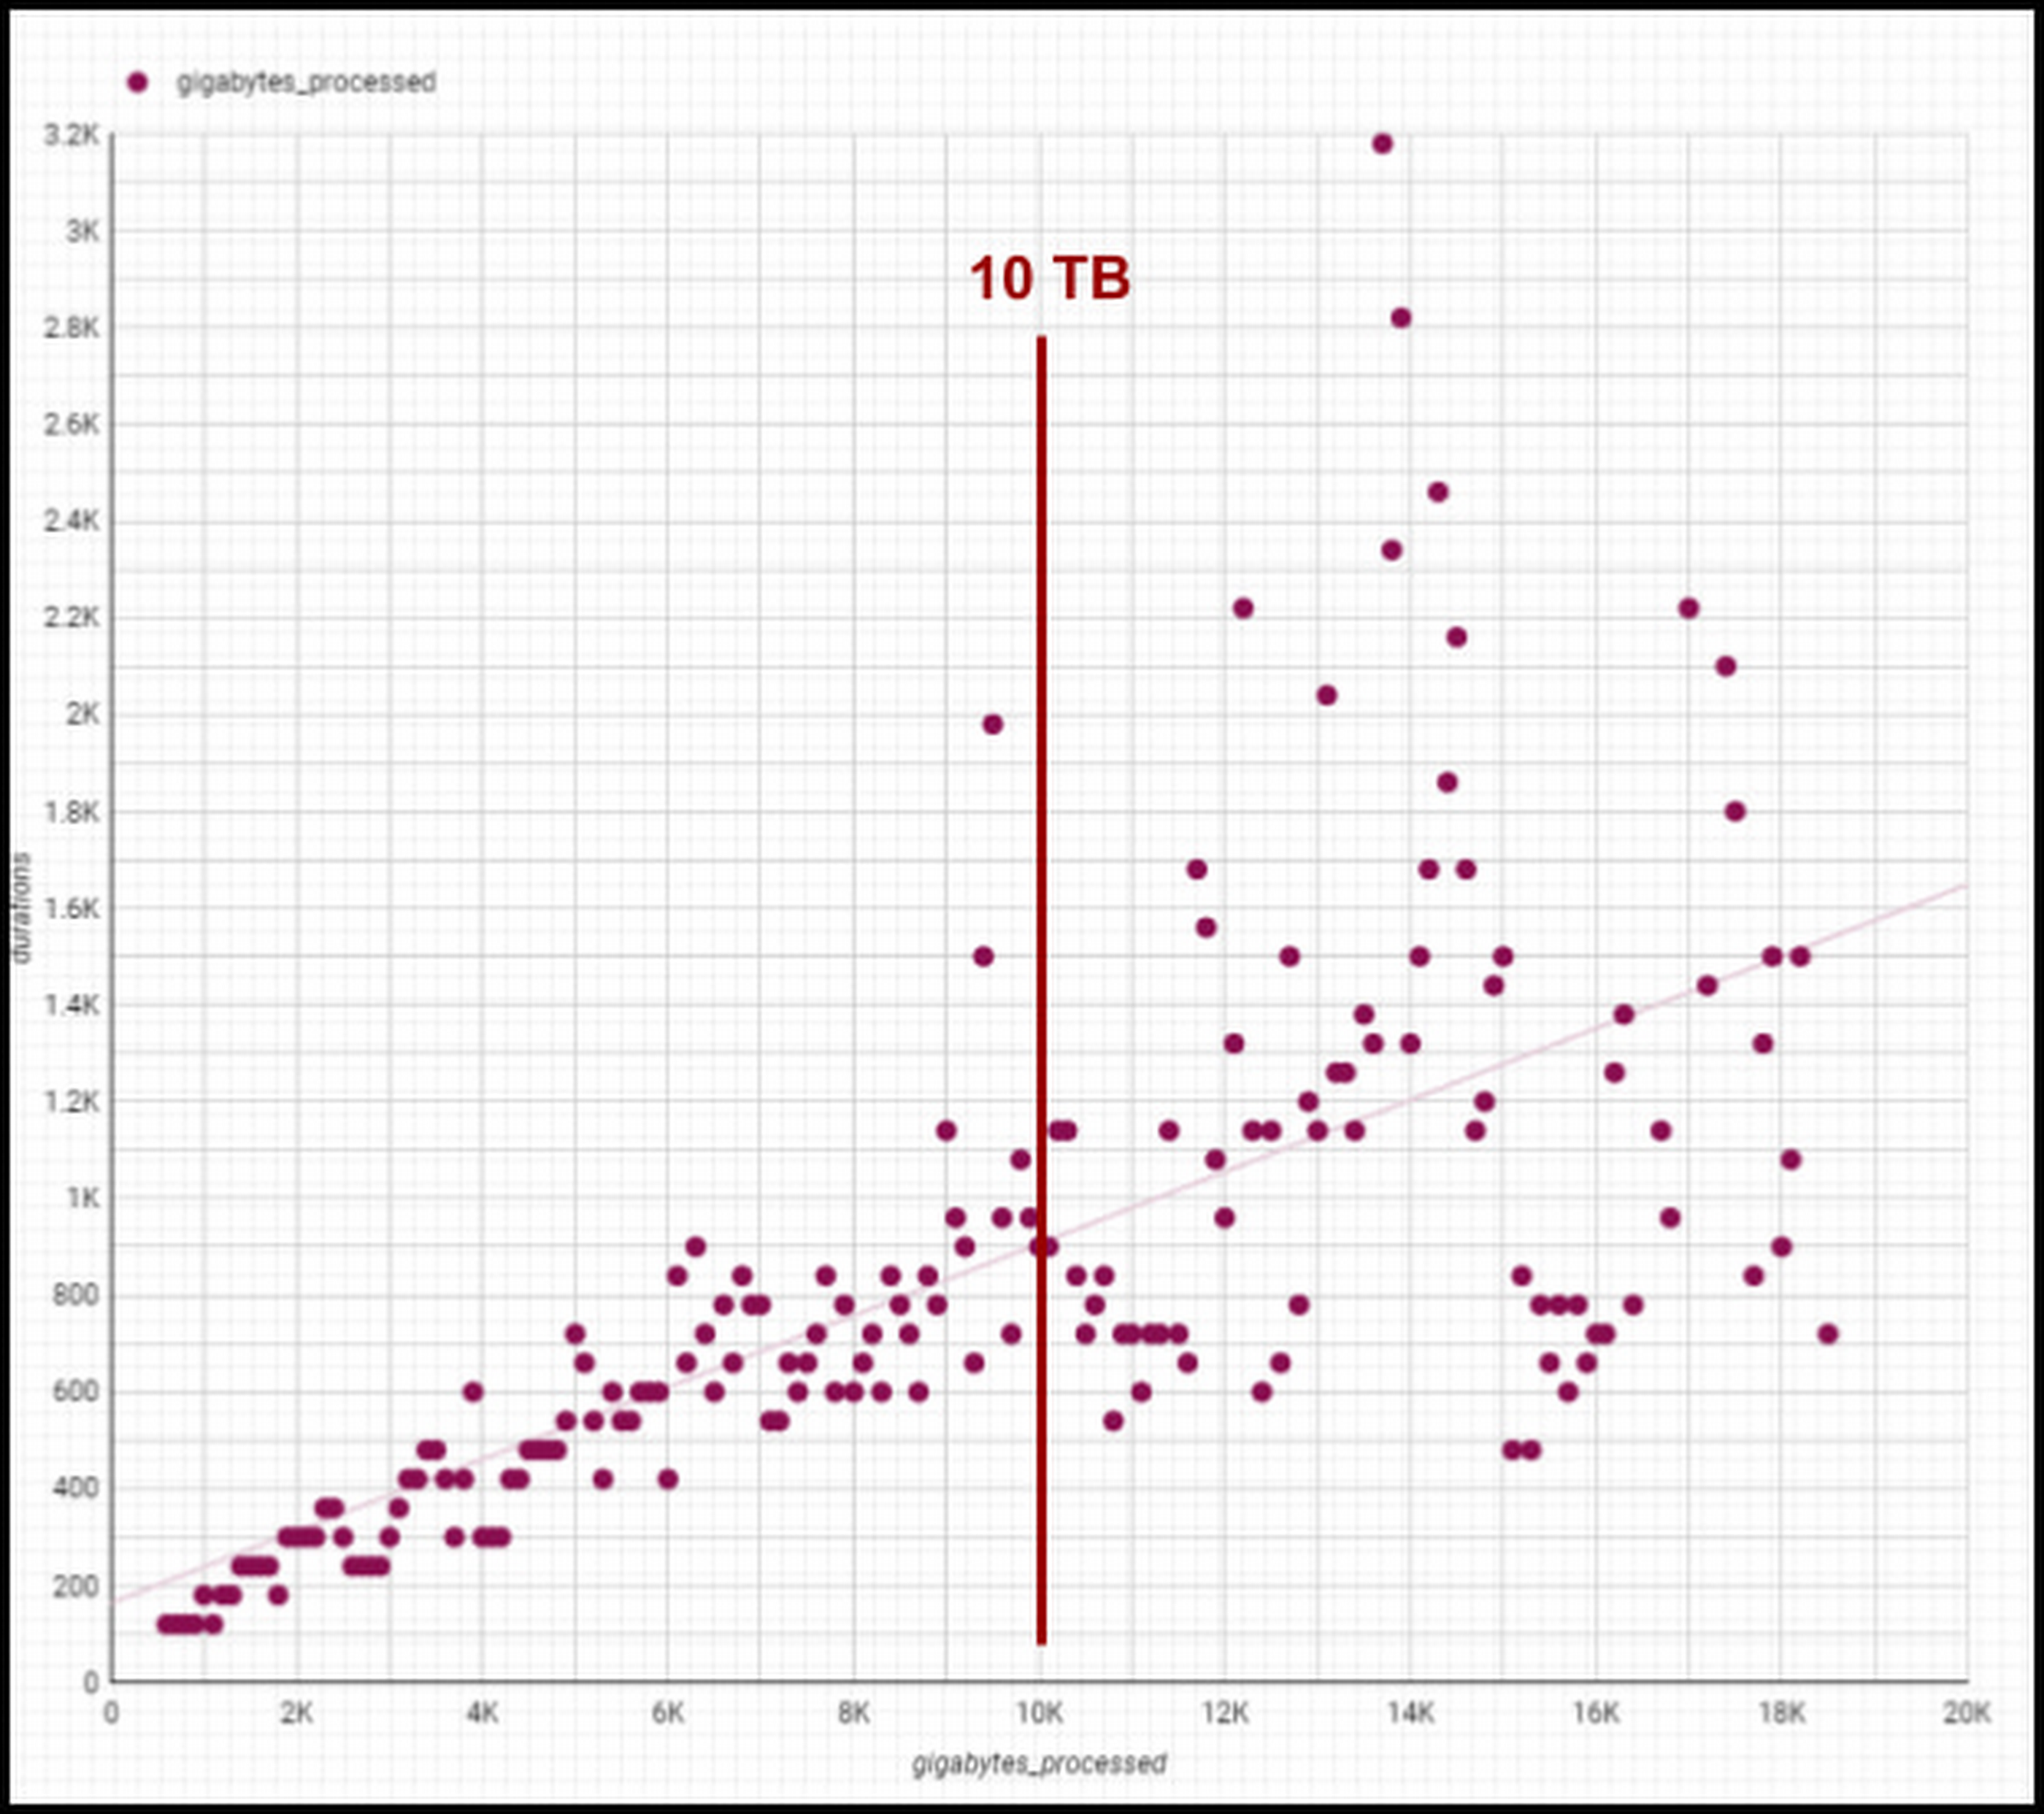
Though individual values vary greatly depending on query complexity [analytic functions/sorting can be computationally expensive], the overall trend line is below 1-1 for bytes versus duration, meaning our BigQuery query runtimes are increasing slower than our data volumes. We are still seeing sub 1:1 threshold runtimes, and we’re already at 100 PB of total data with single queries running on 50PB or more. Going strong!
One unexpected and pleasant surprise has been high performance for smaller queries, such as those required for development, interactive analytics, and internal applications we use for forecasting, segmentation, and other latency-sensitive data workflows. BigQuery’s resource management systems have provided smoother degradation and parallelism profiles than we initially expected for a multi-tenant platform.
We regularly see sub-second p50 query performance for interactive use cases, with p90 performance coming in under 10 seconds for Looker, Data Studio, and AtScale — meeting the threshold we set to avoid analysts losing focus during a business investigation. The chart below shows p50, p90, and p95 timing for core workloads, as well as the number of queries in each bucket and the number of unique users. [Looker and Atscale will use small numbers of service accounts for a large number of users].

This has enabled two important shifts in the way our customers experience analytics services:
- Delivering better user productivity. People no longer have long wait times to get results for a basic query delivering an improved overall user experience.
- Scaling our data transformation. BigQuery has proven, effective data transformation that allows us to embrace the industry shift away towards ELT (extract, load, transform) to transform raw data right within the database.
We no longer have to ask ourselves, “Can we meet the SLA for this data processing task?” The new conversation is, “Of course, we can meet it. What’s the associated cost based on how many resources we assign?” We can make cost and resource trade-offs clear to our users and say “yes” more often to requirements that have measurable business value.
Supporting cost vs. performance decisions
Democratized access to internal analytics is a powerful decision-making tool. With BigQuery’s robust tooling, the decision about how to best allocate computational resources is in the hands of the analytics groups closest to the business decision being made. If they want to spend a sprint optimizing a dashboard, they can show exactly how much money it will save. If they choose not to optimize a report, they can offset the decision with concrete cost savings and other realized value.
Wayfair teams also benefit from visibility into their committed costs by abstracting away the details of the underlying services, including BigQuery slots, the virtual CPUs used to execute SQL queries.
Take a look at this example view consumed by our teams (the metrics for these dashboards are from the BigQuery INFORMATION_SCHEMA (jobs and reservations tables):
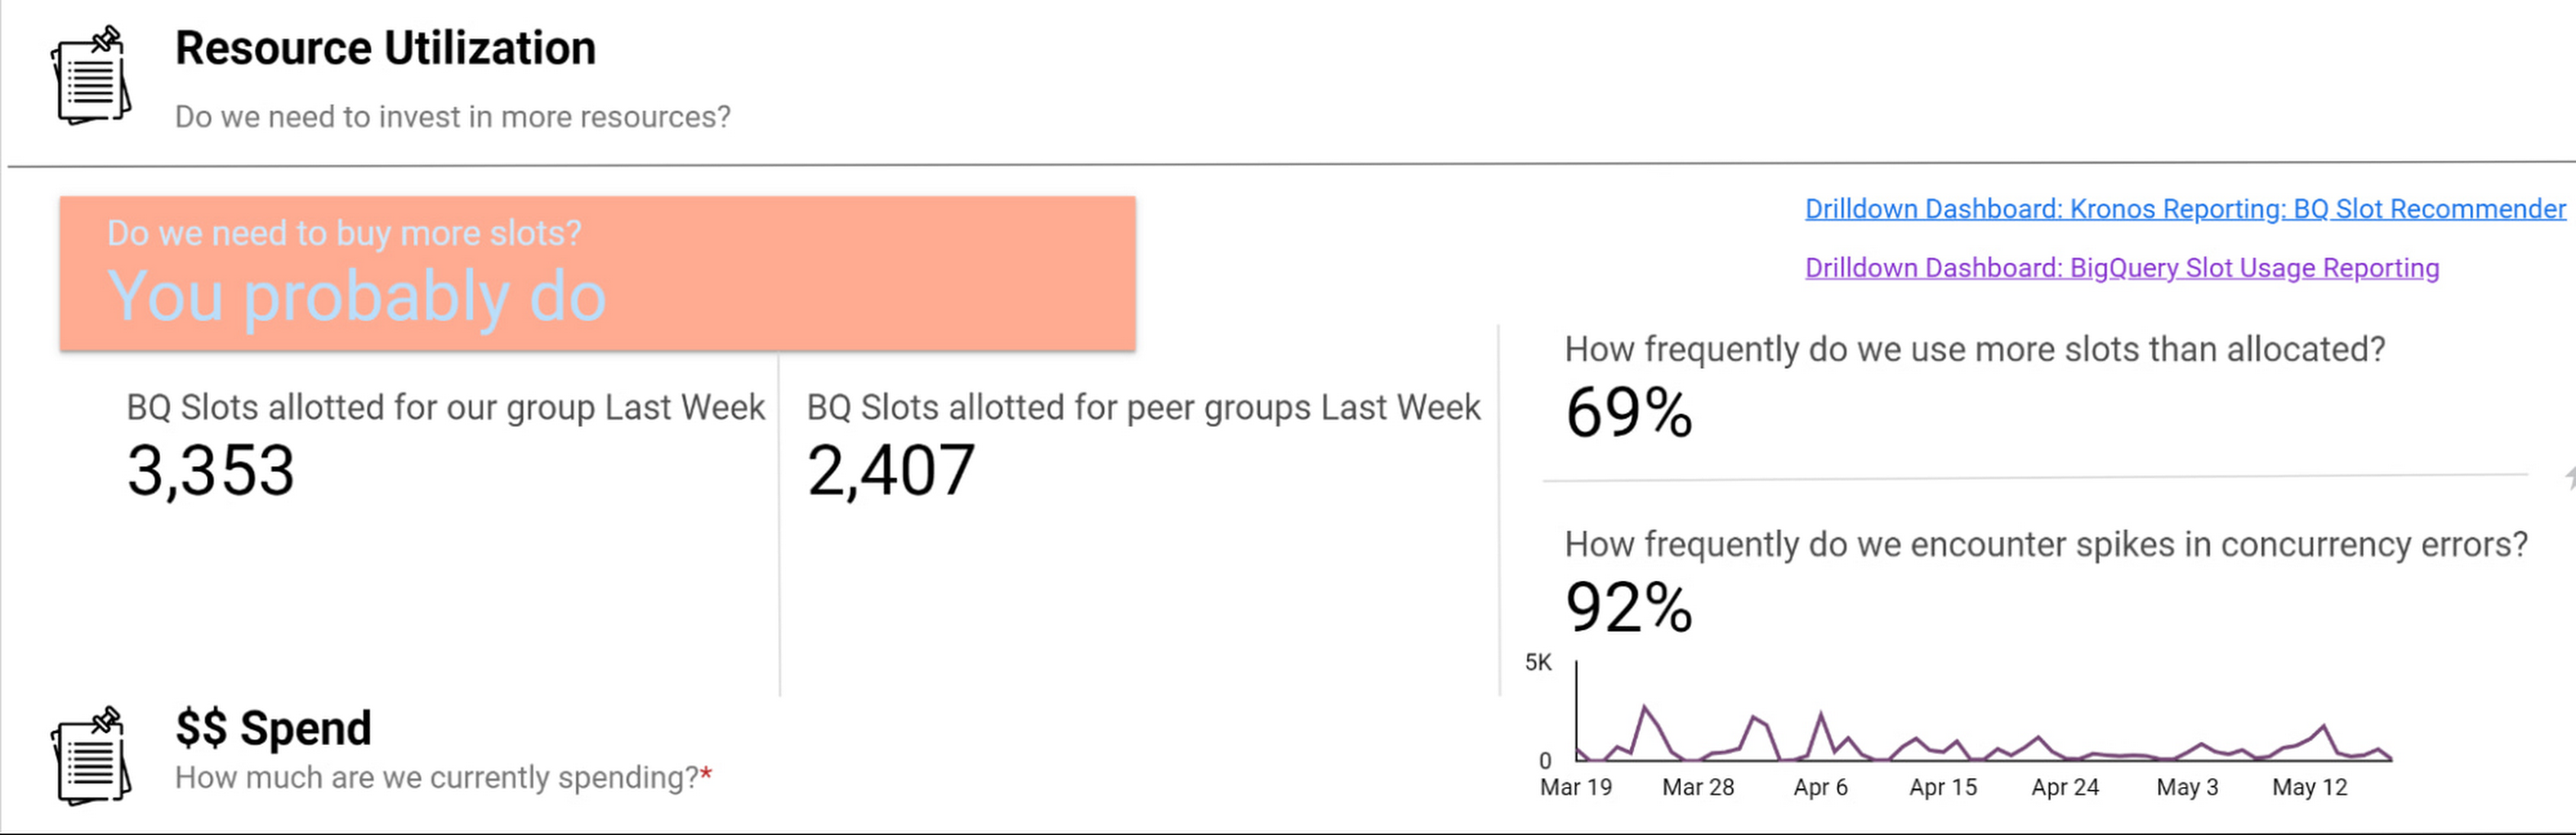
Suppose an organization wants to purchase capacity for a period of time. In that case, we provide an average cost for a slot during that time and charge them based on their slot usage for queries, multiplied by the average price.
Teams can see whether their consumption matches their reservations with a consistent, high-level number. We apply the same approach to tools like Dataproc by aggregating up the costs of component services and providing an organizational cost for those services.
How we use performance signals to improve user efficiency
Instead of overcorrecting for occasional performance fluctuations by allocating excessive resources, we try to align incentives so that people make the right choices for the business. Showback doesn’t work in a vacuum — it requires context and integrated insights. Teams need to show the cost of running a dashboard as well as the ROI is in terms of end user engagement and what peer dashboards with equivalent source datasets might cost.
We want to give users the freedom to do things the way they want and need to while also educating them on achieving their goals and using best practices to reduce their costs and improve their performance. The goal is never for all dashboards to load “less than x seconds” — we believe that any dashboard can load in x seconds when it is properly designed and resourced.
For instance, BigQuery allocates slots for a new workload quickly and efficiently, and queries that are optimized and have dedicated resources consistently complete quickly. When users experience a slowdown, it’s typically because they are sharing resources or inefficiently using their resources. Variable performance is a useful signal to help users discover opportunities to optimize queries and work more productively. We value these signals as we like to focus on the aggregate experience of all users interacting with the tool, not individual interaction.
A natural way to improve user efficiency is to reward ideal behaviors and discourage those that do not align with our analytics strategy. Some examples include splitting out high-demand reporting from ad-hoc exploration to reduce concurrency errors or encouraging people to use materialized tables instead of writing complex custom SQL. For instance, a dedicated reporting project might only include an organization’s Data Studio dashboard if it directly references a table or meets other optimization requirements. Using this approach, we give our users a high degree of freedom and experimentation at the entry-level while providing a well-documented path to scale.
Visibility into query performance improves business performance
The detailed tracking information we get from Google Cloud products is critical — Google’s robust analytics performance has enabled us to scale Data Studio to over 15,000 Wayfarians. Of course, a larger user base always comes with concerns that less sophisticated users may not appropriately optimize their queries or make the best use of the infrastructure.
Evaluating the different Data Studio dashboards helps us identify opportunities to use better query optimization practices, such as reducing custom queries, connecting directly to permanent tables, or using the BI Engine to improve dashboard performance. Recently, our team built new billing projects specific for Data Studio reporting. We can scale up a reservation dedicated to reporting about a major sales event in minutes.
Beyond everyday reporting, holidays and sales events may require higher, guaranteed performance. BigQuery’s flexible capacity commitments allow us to decide at a business level whether an urgent need requires us to reprioritize resources immediately or whether we have the time to optimize queries and rebuild dashboards to be performant. These new billing projects let us evaluate if teams need to scale up resourcing, what areas they can optimize in BigQuery, or if a new reservation is needed to resource that team separately.
Recommendations for achieving high performance at low cost
Are you wondering how to allocate BigQuery slots? Teams must see direct, immediate return on their investment in performance and optimization.
Our first rule of thumb is to align resource utilization with ownership as closely as possible. This makes it easier for teams to secure dedicated resources, even if they start out small. We’re comfortable doing this because BigQuery dynamically reassigns capacity between the targeted reservation and other consumers in milliseconds. We always get the total usage of our slots — there is no wasted capacity even when we break assignments down granularly.
Once a team has a reservation, we provide reporting that consumes various BigQuery information schema views, such as query logs and reservation information, and processes it into aggregated reporting. We look for metrics like the average slots available to a query at a point in time, overall query performance, and how long queries took to execute to pinpoint the overall health of a reservation against our business objectives. Flex slots also let us experiment easily with additional capacity, and BigQuery’s performance is so consistent that we can use straightforward models to estimate return on additional slot investment.
Other key cost optimization tips we have found helpful at Wayfair include:
- Optimize for worst-case performance. Given BigQuery’s ability to share slots, we expect teams will often see much better performance, but we find that thinking it’s more effective when teams think about the most pessimistic case when resourcing their jobs.
- Take advantage of BI Engine reservations. We like to think critically about the data and workload. BI Engine reservations are excellent for workloads that query lots of small dimension tables or a few larger tables loaded into memory. In cases like that, such as with OLAP tools using pre-computed aggregates, we’ve seen BI engine investments drive a 25% reduction in average query time—excellent ROI.
- Leverage Looker for large, longitudinal datasets. Since Looker supports a wide range of use cases, we see a broader range of performance — p50 is still under a second, but p95 can get as high as a minute. For these cases, we recommend modeling user patterns [first of month, first day of week] and dynamically allocating more slots for these periods while deprioritizing batch workloads in the key windows.
- Lean in heavily on the BQ cache for broad-based reporting. To avoid a Monday morning reporting lag, We use the BigQuery cache to avoid Monday morning report loading lags. Up to 30% of our Data Studio queries hit the BQ cache, ensuring our Data Studio p95 consistently stays under 10 seconds.
- Use slots-per-job to improve experience. In our reporting, we find that the most valuable view is slots-per-job. We look for dips in slots available for jobs as this situation often correlates strongly with poor user experiences. For example, our reporting showed us that Looker has the highest volumes of queries and users on Mondays and during each month’s first two business days. We used this information to scale up slots to support these periods of highest demand, delivering on performance SLAs to support business users.

- Get a global picture of usage. We manage slots in a central tool. Teams input their requirements into a calendar to indicate when they want higher or lower capacity to inform our flex slot purchases and annual commitments. It might seem like dozens of relatively inconsistent workloads at the team level, but the picture changes when you look at demand across a week (or our entire business). Understanding global usage makes it easy for us to model baseline capacity recommendations for serving year slots versus flexible demands.
Reaping the rewards of BigQuery
From our first initial undertaking with Google Cloud to transform our storefront, we had a lot of confidence in the underlying technology offerings and the teams that ran them and their ability to meet our unique requirements. But our experience using BigQuery for internal analytics at Wayfair has exceeded our already high expectations.
BigQuery’s fast, dynamic allocation of resources and ability to transform data in place are important to our mission of maintaining consistently high performance for our users while closely managing costs. Moreover, our visibility into query and dashboard performance through BigQuery’s DSP views and other performance metrics have helped us make clearer connections between performance goals and the costs required to meet them — and guide our analysts across the company towards attaining high performance on every project.
7470
Of your peers have already watched this video.
1:15 Minutes
The most insightful time you'll spend today!
An Indian Example of How to Really Up Your Customer Experience Game and Increase Conversion Rates With AI
How about selfie analysis of users to recommend them the right lipstick color?
That’s just one of the many ideas folks at Purplle.com came up with to improve the buying experience of Indian consumers.
And without the power of Google Cloud, it would probably have remained just that…an idea.
But today, thanks to Google Cloud, “Nothing seems impossible,” says Suyash Katyayani, CTO, Purplle.
Purplle.com is an online e-commerce company in India and one of the pioneers in creating a digitally-native beauty brands in India.
“The beauty industry is so data intensive that we needed to have a strong data strategy and we were looking out for solutions which would enable us to have a strong data pipeline and a strong data warehousing solution,” says Katyayani.
That’s when it turned to Google Cloud.
Additionally, Purplle.com, says Katyayani, does not have to worry about at what scale the company operates at because they have access to state-of-the-art infrastructure from Google Cloud available to them so that their developers can run experiments.
“The biggest plus point for us has been the agility that Google Cloud has added,” says Katyayani.
How BigQuery’s Unique Features Support Your Data at Petabyte-scale

4795
Of your peers have already read this article.
3:00 Minutes
The most insightful time you'll spend today!
Organizations rely on data warehouses to aggregate data from disparate sources, process it, and make it available for data analysis in support of strategic decision-making. BigQuery is the Google Cloud enterprise data warehouse designed to help organizations to run large scale analytics with ease and quickly unlock actionable insights. You can ingest data into BigQuery either through batch uploading or by streaming data directly to unlock real-time insights. As a fully-managed data warehouse, BigQuery takes care of the infrastructure so you can focus on analyzing your data up to petabyte-scale. BigQuery supports SQL (Structured Query Language), which you’re likely already familiar with if you’ve worked with ANSI-compliant relational databases.
BigQuery unique features
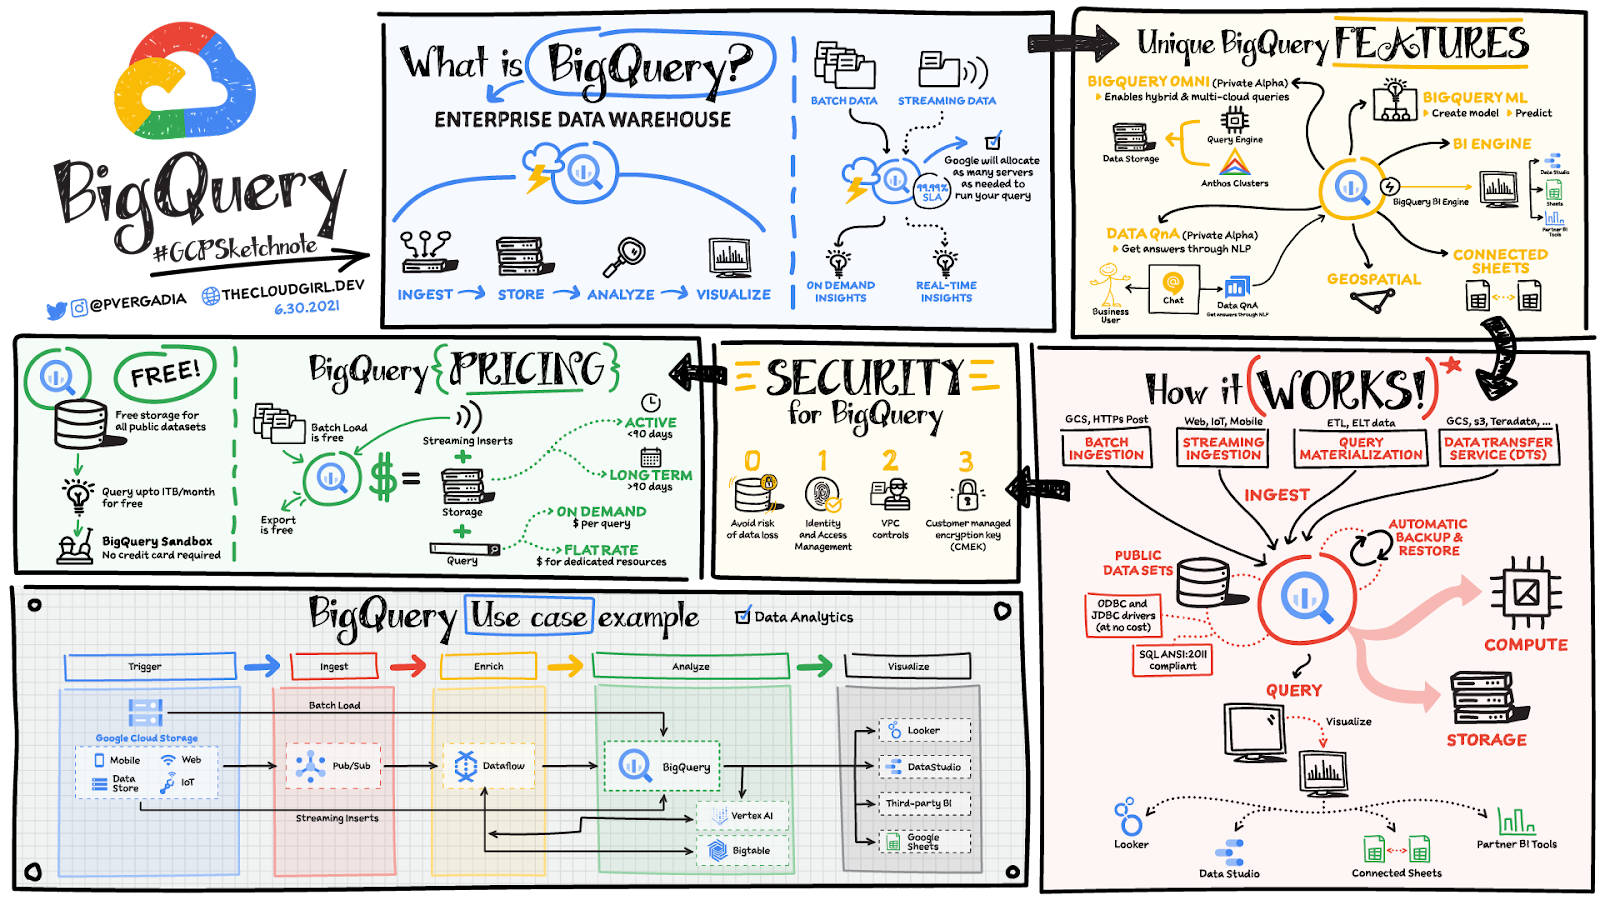
BI Engine – BigQuery BI Engine is a fast, in-memory analysis service that provides subsecond query response times with high concurrency. BI Engine integrates with Google Data Studio and Looker for visualizing query results and enables integration with other popular business intelligence (BI) tools.
BigQuery ML: BigQuery ML is unlocking machine learning for millions of data analysts. It enables data analysts and data scientists to build and operationalize machine learning models directly within BigQuery, using simple SQL.
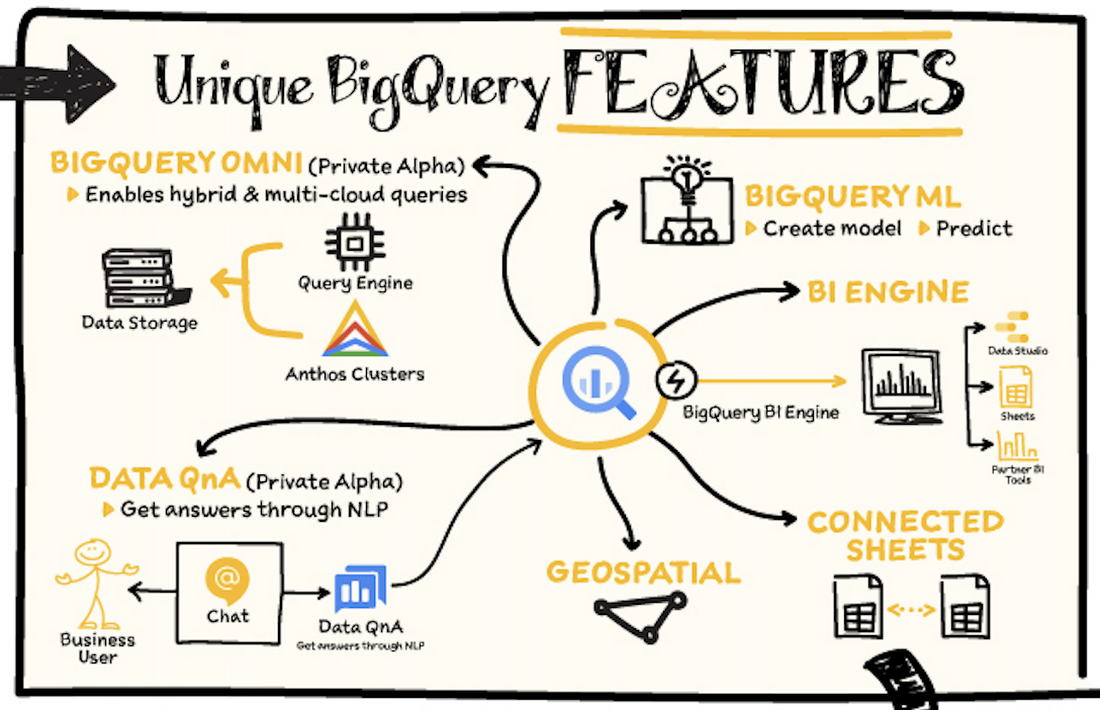
BigQuery Omni – BigQuery Omni is a flexible, multi-cloud analytics solution powered by Anthos that lets you cost-effectively access and securely analyze data across Google Cloud, Amazon Web Services (AWS), and Azure, without leaving the BigQuery user interface (UI). Using standard SQL and familiar BigQuery APIs, you can break down data silos and gain critical business insights from a single pane of glass.
Data QnA: Data QnA enables self-service analytics for business users on BigQuery data as well as federated data from Cloud Storage, Bigtable, Cloud SQL, or Google Drive. It uses Dialogflow and enables users to formulate free-form text analytical questions, with auto-suggested entities while users type a question.
Connected Sheets -The native integration between Sheets and BigQuery makes it possible for all business stakeholders, who are already quite familiar with spreadsheet tools, to get their own up-to-date insights at any time.
Geospatial data – BigQuery offers accurate and scalable geospatial analysis with geography data types. It supports core GIS functions – measurements, transforms, constructors, and more – using standard SQL.
How does it work?
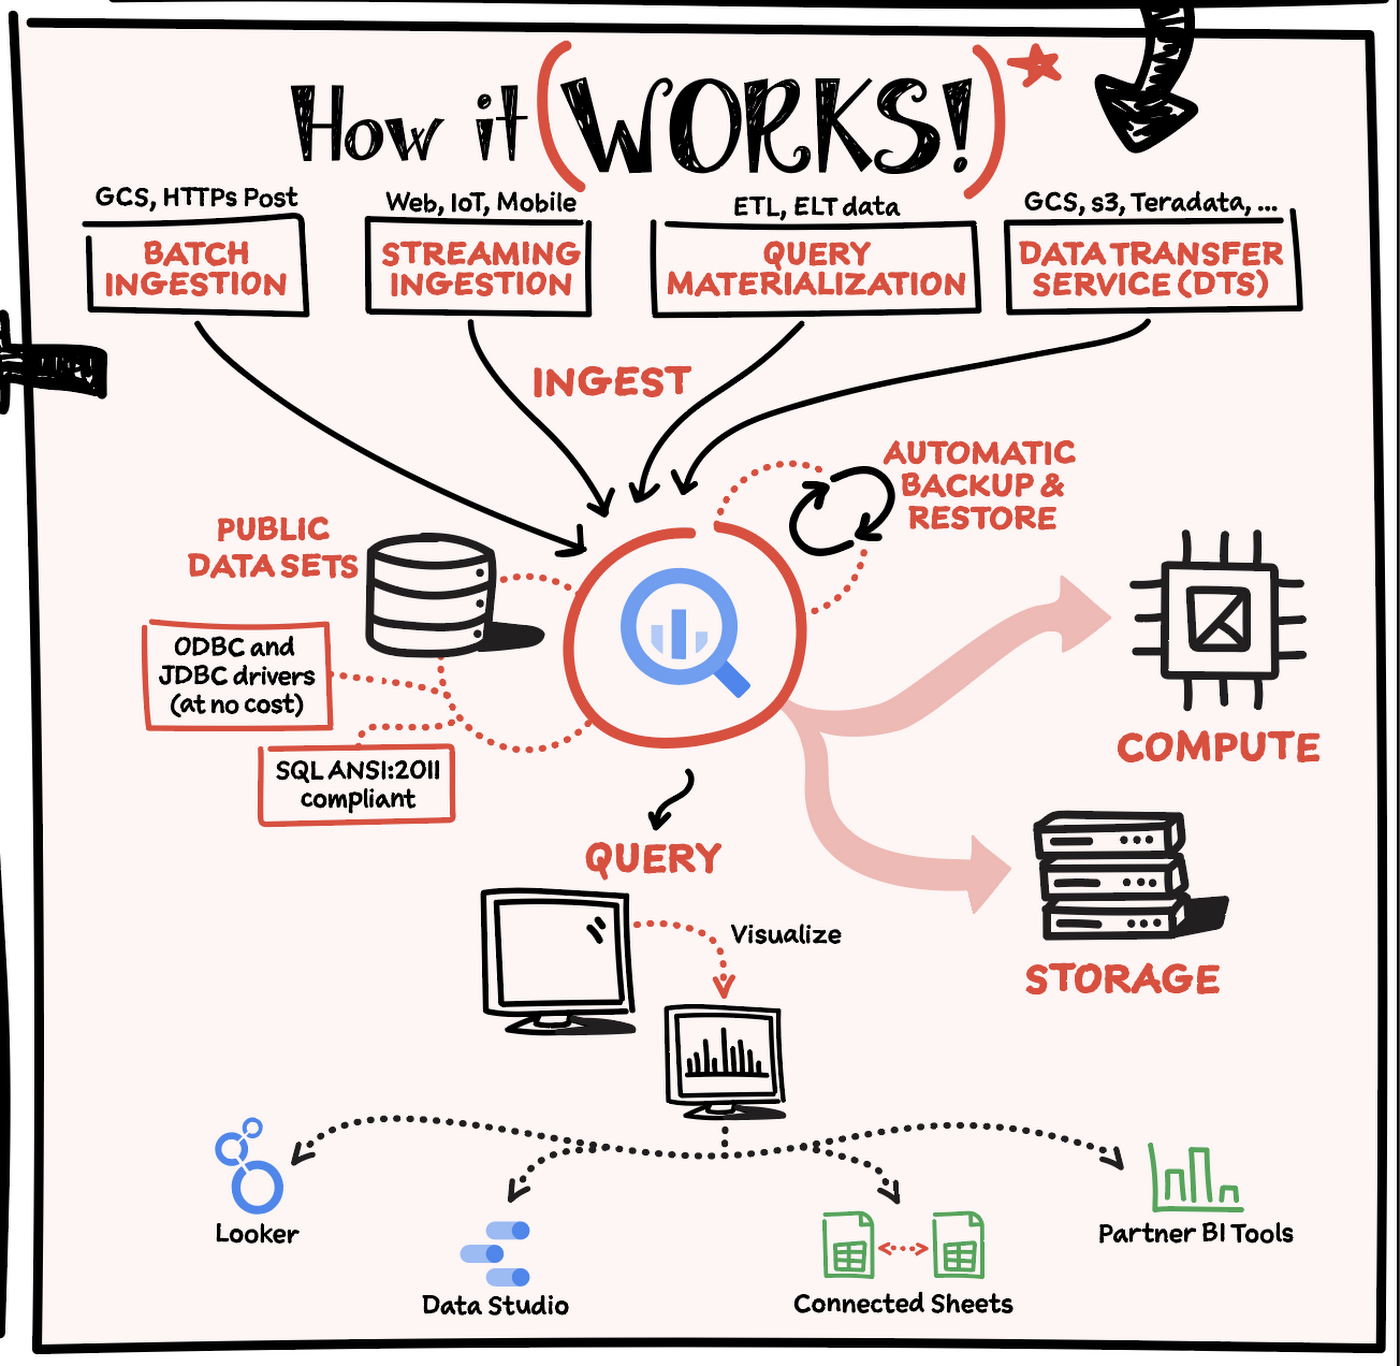
Here’s how it works: You ingest your own data into BigQuery or use data from the public datasets. Storage and compute are decoupled and can scale independently on demand. This offers immense flexibility and cost control for your business as you don’t need to keep expensive compute resources up and running all the time. As a result, BigQuery is much more cost-effective than traditional node-based cloud data warehouse solutions or on-premises systems. BigQuery also provides automatic backup and restore of your data.
You can ingest data into BigQuery in batches or stream real-time data from web, IoT, or mobile devices via Pub/Sub. You can also use Data Transfer Service to ingest data from other clouds, on-premises systems or third-party services. BigQuery also supports ODBC and JDBC drivers to connect with existing tools and infrastructure.
Interacting with BigQuery to load data, run queries, or create ML models can be done in three different ways. You can use the UI in the Cloud Console, the BigQuery command-line tool, or the API via client libraries available in several languages.
When it comes time to visualize your data, BigQuery integrates with Looker as well as several other business intelligence tools across the Google partner ecosystem.
What about security?
BigQuery offers built-in data protection at scale. It provides security and governance tools to efficiently govern data and democratize insights within your organization.
- Within BigQuery, users can assign dataset-level and project-level permissions to help govern data access. Secure data sharing ensures you can collaborate and operate your business with trust.
- Data is automatically encrypted both while in transit and at rest, ensuring that your data is protected from intrusions, theft, and attacks.
- Cloud DLP helps you discover and classify sensitive data assets.
- Cloud IAM provides access control and visibility into security policies.
- Data Catalog helps you discover and manage data.
How much does it cost?
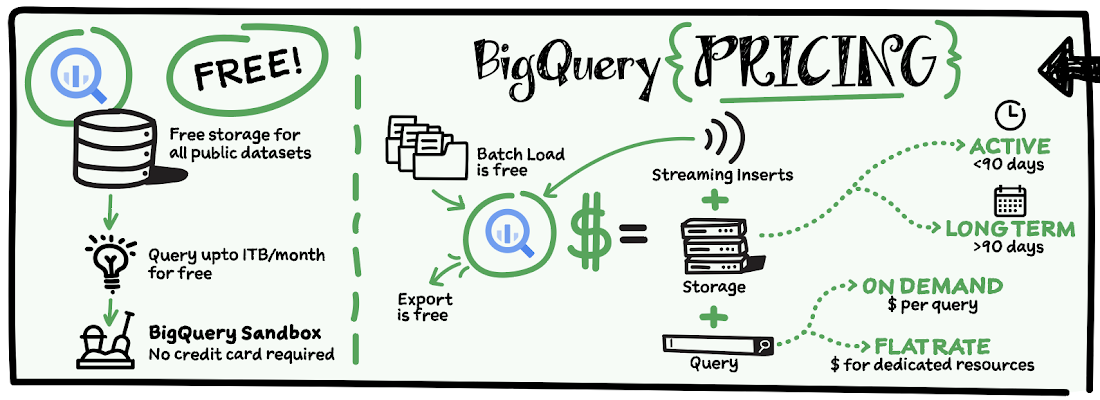
The BigQuery sandbox lets you explore BigQuery capabilities at no cost and confirm that BigQuery fits your needs. With BigQuery you get predictable price-performance: you pay for storing and querying data, and for streaming inserts. Loading and exporting data are free of charge. Storage costs are based on the amount of data stored, and have two rates based on how often the data is changing. Query costs can be either:
- On-demand – you are charged per query by the amount of data processed
- Flat-rate – if you prefer to purchase dedicated resources
You can start with the pay-as-you-go, on-demand option and later move to flat-rate if that better suits your usage. Or, start with flat-rate, get a better understanding of your usage and move to the pay-as-you-go models for additional workloads.
To explore BigQuery and its capabilities a bit more, check out the sandbox; and when you’re ready to modernize your data warehouse with BigQuery then check out the documentation to streamline your migration process here. https://www.youtube.com/embed/So-tVyBQt8E?enablejsapi=1&
For more #GCPSketchnote, follow the GitHub repo. For similar cloud content follow me on Twitter @pvergadia and keep an eye out on thecloudgirl.dev.

3468
Of your peers have already downloaded this article
10:30 Minutes
The most insightful time you'll spend today!
As organizations look to revolutionize how they analyze and utilize data, modernizing the data-centric technology stack is critical to success.
Today, the traditional stack poses several challenges—too many steps, too many tools, and too many integrations—all leading to operational complexity, time delays, and high cost. Simplifying the data pipeline, data lifecycle, and data stack offers organizations improved efficiency as well as cost savings, and provides them more value by freeing up resources to focus on deriving insight through the analysis of data.
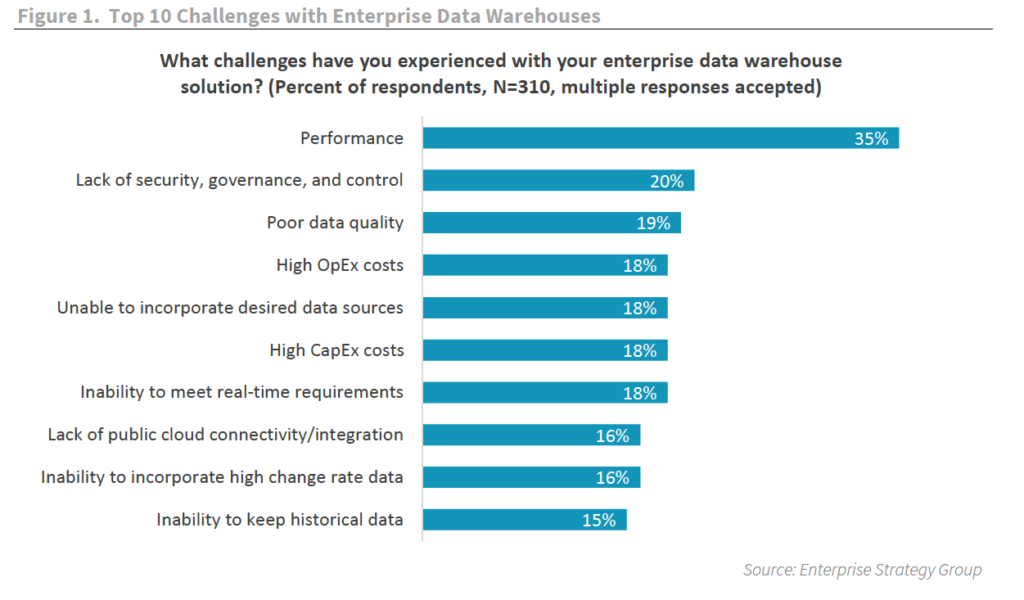
As organizations begin to transform their approach to analytics, modernizing the analytics stack is a top priority.
To address both the data supply and data demand, data teams must look for ways to simplify and optimize the data pipeline. That means transitioning traditional solutions, like data warehouses and business intelligence tools, to modern architectures built with scalability, agility, and availability in mind.
And what follows with a modernized stack is an ideal data experience rich in actionable insight, API-driven application integration, and the ability to address the real-time needs of a dynamic business.
To find out the advantages to modernizing data warehouses and how this can be accomplished, download, ESG’s report: Modernize the Data Stack to Transform the Data Experience.
More Relevant Stories for Your Company

2022 Healthcare Trends: Healthcare Data, M&As, Better Patient Care, AI in Drug Development & Strategic Partnerships
The COVID-19 pandemic continues to push the healthcare and life sciences industry in entirely new ways. In record time, we’ve witnessed public health officials, vaccine developers, equipment manufacturers, and essential workers take life saving actions—regularly putting their own lives at risk—to respond to the exceptional challenges of our time. Yet

“It’s an Astonishing Difference”: What Data Operation Execs say About Google Cloud’s Data Warehouse
The popularity of meal kit delivery services has surged in recent years as consumer attitudes toward home cooking and grocery shopping have shifted. As a pioneer in the category, Blue Apron helps its customers create incredible home cooking experiences by sending culinary-driven recipes with high-quality ingredients and step-by-step instructions straight to customers’

Quantum Metric Increases Business 10-fold
At Quantum Metric, we’re in the business of bringing our customers business insights that are based on customer experience data and analytics for mid-market and Fortune 500 companies. Our software, powered by big data, machine intelligence, and Google Cloud, helps our customers identify, quantify, prioritize and measure opportunities to improve

Principles to Make Organizations Data Engineering Driven
In the “What type of data processing organisation” paper, we examined that you can build a data culture whether your organization consists mostly of data analysts, or data engineers, or data scientists. However, the path and technologies to become a data-driven innovator are different and success comes from implementing the right
