





Meet the 8 Sponsors of 2021 State of DevOps Reports

3267
Of your peers have already read this article.
4:00 Minutes
The most insightful time you'll spend today!
Google Cloud and the DORA research team are excited to announce our eight sponsors for the 2021 State of DevOps report. We recently launched the 2021 State of DevOps survey, a 25-min survey for the DevOps community to share how they are using DevOps to improve software delivery performance. So if you haven’t taken the survey yet, this is your chance!
For those unfamiliar with the State Of DevOps report, it is the largest and longest running research of its kind. It provides an independent view into how teams and companies can drive powerful business outcomes, no matter what stage of the DevOps journey
With the State of DevOps reports we aim to capture how teams and companies are driving excellence in technology delivery through the implementation of DevOps practices, no matter what stage of the DevOps journey your team is in. If you’re wondering how your team measures up in your industry take our DevOps Quick Check and discover which capabilities you should focus on to improve your performance.
To capture a diverse array of information on how those in the DevOps community are performing, our eight sponsors of the 2021 State of DevOps survey are focussed on helping organizations of all sizes and industries to develop and deliver software faster across the whole DevOps lifecycle. Captured below, you’ll find more information on our sponsors for this year and why they chose to sponsor the State Of the DevOps 2021 Report.

Armory enables enterprise companies to ship better software, faster through trusted, reliable, safe, and secure deployments — at its core, Armory is powered by Spinnaker OSS.
“Armory exists to unlock innovation through software. To achieve this, we help enterprises reliably deploy software at scale, naturally aligning with DevOps practices to improve software delivery performance. Given this, we applaud efforts like the State of DevOps Report that provides an independent view into the practices and capabilities that organizations can employ to drive better performance.”
Carl Timm, Senior Director of Product Marketing at Armory

The world’s best software teams deliver quality code, confidently, with CircleCI. The world’s best software teams use CircleCI to go from next-up to feature shipped, at the speed ambitious businesses require.
“Though the DevOps space is only over a decade old, it moves incredibly quickly. Google’s State of DevOps report is both a reflection and projection of the industry, capturing how DevOps culture drives business results and where DevOps practitioners can look to improve. At CircleCI, we rely heavily on this survey data to glean valuable insights into our market and our customers overall. We also build upon these insights to guide our own research into how engineering teams move code through pipelines in our annual State of Software Delivery report. Taken together, this research highlights teams’ reported and actual behavior and paints a vibrant picture of how technology-driven organizations drive for success.”
Emma Webb, VP, Corporate Communications, CircleCI
Continuous Delivery Foundation
CD Foundation is an open-source community improving the world’s ability to deliver software with security and speed.
“Good decision-making is based on good data. Open source is a critical piece of the technology roadmap for DevOps, and the 2021 State of DevOps Report will provide actionable information for high performing teams in organizations of all types and sizes. The report will show where open source and DevOps intersect, and in a space that is changing so quickly, new relevant data is critical,” said Tracy Miranda, Continuous Delivery Foundation Executive Director. “CD Foundation members are deeply involved with producing this annual report, with over 10 years of historic research. Thank you to Google and our other members who have worked so hard on it. This report is a tangible result of working together.”
Tracy Miranda, Continuous Delivery Foundation Executive Director

Deloitte provides audit and assurance, tax, consulting, and risk and financial advisory services to a broad cross-section of the largest corporations and governmental agencies. At Deloitte, they are continuously evolving how they work and how they look at marketplace challenges so they can continually deliver measurable, sustainable results for their clients and communities.
“Software delivery is evolving rapidly and we know our customers need unique and compelling insights to make the right decisions. State of DevOps is a widely used report and considered as an Industry standard to understand the drivers for excellence in Software Development and Delivery. Deloitte is excited to help the team at DORA and Google Cloud in publishing this report through our sponsoring since we believe the insights from this report will help make software delivery better.”
Manoj Mishra, Consulting Managing Director, Deloitte Consulting LLP
GitLab is the open DevOps platform built from the ground up as a single application for all stages of the DevOps lifecycle enabling Product, Development, QA, Security, and Operations teams to work concurrently on the same project.
“We’re happy to sponsor the DORA Report and the vital work behind it. The more we understand the DevOps journey, the better we and our GitLab community can contribute to its future. We’re particularly interested to see this year’s results and the impact COVID-19 and remote work have had on DevOps. We appreciate the chance to be part of this exciting, informative process.”
Brendon O’Leary, Senior Developer Evangelist
Liquibase helps millions of developers easily manage database schema changes by enabling teams to track, version, and deploy database changes by delivering on the promise of CI/CD for the database.
“With their rigorous methodology, the DORA research team delivers actionable information with the simple goal of helping organizations of any size accelerate the development and delivery of software. Liquibase is honored to sponsor the 2021 State of DevOps Report and its role in helping so many organizations build value for their customers and shareholders”
Matt Geise, VP of Marketing at Liquibase

PagerDuty is a digital operations management platform that empowers the right action, when seconds matter.
“As a leader in digital operations management, PagerDuty is proud to sponsor this year’s report as it aligns with our dedication to helping DevOps professionals make better decisions. This report will inform tech and business leaders about the trends/challenges developers are facing and the opportunities there are to accelerate their own DevOps transformation.”
Carolyn Guss, VP of Corporate Marketing
Sysdig is driving the secure DevOps movement, empowering organizations to confidently secure containers, Kubernetes and cloud.
“There is a learning curve with all new technology, cloud is no exception. Learning from mistakes and sharing best practices is how we will ultimately ship secure applications, faster. For seven years, DORA and Google have partnered to understand the State of DevOps to help vendors and cloud practitioners to learn from each other and implement standards for best practices,”
Loris Degioanni, CTO and founder of Sysdig
Google Cloud, the DORA team, and our sponsors are very excited about this year’s report. We look forward to hearing from you, your colleagues, and networks about how DevOps is integrated into your workflow and ways we can help to further improve your performance. Please share your experience with software delivery by completing our survey that will be used to foster the next generation of DevOps best practices. To provide ample time for the DevOps community to contribute to this industry wide report we have extended the deadline for the survey until July 2nd.
Thank you to everyone who has participated so far, and the Google Cloud DORA team looks forward to hearing from even more of you soon!
Google Unveils Topaz, the New Subsea Cable Connecting Asia and Canada

3333
Of your peers have already read this article.
3:00 Minutes
The most insightful time you'll spend today!
There’s a new subsea cable in town: Topaz, the first-ever fiber cable to connect Canada and Asia.
Once complete, Topaz will run from Vancouver to the small town of Port Alberni on the west coast of Vancouver Island in British Columbia, and across the Pacific Ocean to the prefectures of Mie and Ibaraki in Japan. We expect the cable to be ready for service in 2023, not only delivering low-latency access to Search, Gmail and YouTube, Google Cloud, and other Google services, but also increasing capacity to the region for a variety of network operators in both Japan and Canada.
Google is spearheading construction of the project, joined by a number of local partners in Japan and Canada to deliver the full Topaz subsea cable system. Other networks and internet service providers will be able to benefit from the cable’s additional capacity, whether for their own use or to provide to third parties. And, similar to other cables we’ve built, with Topaz we will exchange fiber pairs with partners who have systems along similar routes. This is a longstanding practice in the industry that strengthens the intercontinental network lattice for network operators, for Google, and for users around the world.
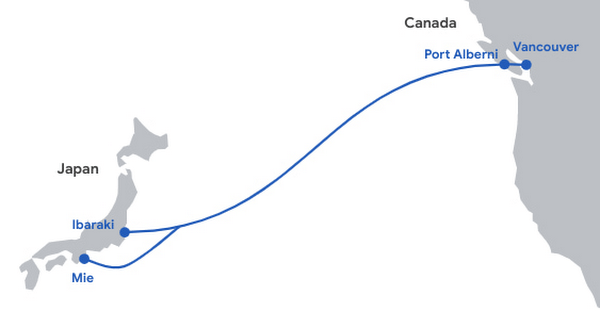
Network infrastructure investments like Topaz bring significant economic activity to the regions where they land. For example, according to a recent Analysys Mason study, Google’s historical and future network infrastructure investments in Japan are forecasted to enable an additional $303 billion (USD) in GDP cumulatively between 2022 and 2026.
The width of a garden hose, the Topaz cable will house 16 fiber pairs, for a total capacity of 240 Terabits per second (not to be confused with TSPs). It includes support for Wavelength Selective Switch (WSS), an efficient and software-defined way to carve up the spectrum on an optical fiber pair for flexibility in routing and advanced resilience. We’re proud to bring WSS to Topaz and to see the technology is being implemented widely across the submarine cable industry.
While Topaz is the first trans-Pacific fiber cable to land on the West Coast of Canada, it’s not the first communication cable to connect to Vancouver Island. In the 1960s, the Commonwealth Pacific Cable System (COMPAC) was a copper undersea cable linking Vancouver with Honolulu (United States), Sydney (Australia), and Auckland (New Zealand), expanding high-quality international phone connectivity. Today, COMPAC is no longer in service but its legacy lives on. The original cable landing station in Vancouver — the facility where COMPAC made landfall on Canadian soil — has been upgraded to fit the needs of modern fiber optics and will house the eastern end of the Topaz cable.
Traditional and treaty rights, and local communities, are deeply important to our infrastructure projects. The Topaz cable is built alongside the traditional territories of the Hupacasath, Maa-nulth, and Tseshaht, and we have consulted with and partnered with these First Nations every step of the way.
“Tseshaht is very proud of this collaboration and our partnership with Google, who has been very respectful and thoughtful in its engagement with our Nation. That’s how we carry ourselves and that’s how we want business to carry themselves in our territory.“ — Tseshaht First Nation – Elected Chief Councillor-Ken Watts
“The five First Nations of the Maa-nulth Treaty Society are pleased that we have concluded an agreement with Google Canada and have consented to the installation of a new, high-speed fiber optic cable through our traditional territories. This agreement, in which both Google Canada and our Nations benefit, is based on respect for our constitutionally protected treaty and aboriginal rights and enhances the process of reconciliation. We would also like to acknowledge the sensitivity that Google Canada expressed during our talks in regard to the pain and trauma experienced by our people as a result of residential school experience. We look forward to a long and mutually beneficial relationship with Google Canada.” —Chief Charlie Cootes, President of the Maa-nulth Treaty Society
“Google’s respect towards our Nation is appreciated and has good energy behind it.” —Hupacasath First Nation – Elected Chief Councilor – Brandy Lauder
With the addition of Topaz today, we have announced investments in 20 subsea cable projects. This includes Curie, Dunant, Equiano, Firmina and Grace Hopper, and consortium cables like Blue, Echo, Havfrue and Raman — all connecting 29 cloud regions, 88 zones, 146 network edge locations across more than 200 countries and territories. Learn about Google Cloud’s network and infrastructure on our website and in the below video.
Conversations on Government Security with Dmitri Alperovitch, CrowdStrike’s Founder and Former CTO

4847
Of your peers have already read this article.
2:00 Minutes
The most insightful time you'll spend today!
As I was preparing for my fireside chat with Dmitri Alperovitch, Founder and Former CTO of CrowdStrike and Executive Chairman of the Silverado Policy Accelerator, for the Google Cloud Government Security Summit taking place on Tuesday, July 20th, I was reflecting about recent developments in cybersecurity, Zero Trust best practices – including aspects of Google’s journey – and the benefits that this approach to cybersecurity brings to the public sector.
As Dmitri and I discussed what we wanted to share during our session at the Government Security Summit, I quickly realized how pertinent the information was to our public sector audience. For that reason, ahead of Tuesday’s event, I wanted to give you a glimpse of what is to come in our fireside chat. Read below for an exclusive preview of what we plan to discuss. If you are planning to attend on Tuesday, we encourage you to ask questions through our interactive chat function and sign up for 1:1 time with our Ask the Expert program.
Check out my chat with Dmitri below…
Heather: What do you see as the most significant changes in both the attack surface and cybercriminal tactics in recent years? And why do these changes present unprecedented challenges for public sector?
Dmitri: In terms of the threat landscape, the more things change, the more they stay the same. The adversaries haven’t changed that much. It’s actually striking. Not all threats are emanating from governments or state actors – either directly or by providing safe harbor to criminals – but a large portion are. That has not changed. The volume and scale of attacks have grown, however, and become massive. And now, the greatest challenge is that everyone is a target. Before, only top-end institutions and government organizations were facing nation state threats. That has changed either through targeted attacks or accidental ones, such as WannaCry. The question now is “How do we protect the most vulnerable and extend much-needed protection to smaller organizations that do not have deep security expertise or resources?”
Heather: Earlier this year, the Biden Administration released its Cybersecurity Executive Order (EO). What do you see as the most important takeaways and potential impact of the EO?
Dmitri: The Cybersecurity EO is set to have a significant impact. The biggest change is a shift in strategy. For many decades, we all had the mentality that we have to keep attackers out of the network. That is great in theory, but we all know that it is a virtual impossibility with a network of any significant size. Adversaries will find a way in. And, we used to think it was game over once they were in the network.
Then about 10 years ago, we began to see a change. Google led the way with its BeyondCorp strategy as did Lockheed Martin with its sentinel Kill Chain framework. Now, when an adversary penetrates a network, it’s not the end of the game, but the beginning. That is the case if the organization is prepared with a network architecture built around Zero Trust principles. The adversary now has to move laterally, steal credentials, and elevate privileges to get to the resources they want. A Zero Trust architecture can slow them down and give organizations time to detect and eject adversaries from the network. The EO recognizes the power of this approach and has made Zero Trust its fundamental tenet.
Heather: Federal agencies have spent the last 60 days looking at Zero Trust and developing their plans. What do you hope to see? What is critical to accelerating implementation?
Dmitri: The EO establishes a very ambitious timeline, and the US government is not known to move rapidly due to a number of restrictions and considerations. That said, the EO recognizes the idea that logging has to be at the center of modern architecture. Agencies need full visibility into what is going on at endpoints and across the network, have to hunt continuously across networks for adversaries, and must work to rapidly eject them. That is at the core of the EO, and it is a great shift. The private sector should be watching and learning as well.
Heather: What pitfalls should the Federal government look out for in moving forward to implement the EO?
Dmitri: One of the main challenges is the limited authority of the President. Congress is the only branch with the power to change the laws. While the establishment of the Cybersecurity and Infrastructure Security Agency (CISA) a few years ago allows for hunting across agency networks, CISA still has limited authority. It cannot manage the cybersecurity of more than 120 civilian agencies.
Some agencies are performing well when it comes to security, but we have to recognize that this is not the norm. Not all agencies have the capacity to recruit the best cybersecurity talent, but their needs may be just as great. We need to centralize capabilities and leverage the cloud, like Google, to provide all agencies with the best cyber talent and resources.
Join us at the Google Cloud Government Security Summit to hear the rest of our conversation. The event is complimentary. Register today to reserve your spot on July 20th. If you have any questions about the event, please reach out to us at cloudsummitsupport@google.com.
Google Migration and BigQuery Brings PedidosYa Closer towards its Goal of Becoming Data-driven

7252
Of your peers have already read this article.
2:00 Minutes
The most insightful time you'll spend today!
Editor’s note: PedidosYa is the market leader for online food ordering in Latin America, serving 15 markets and over 400 cities. It’s also one of the largest brands within the German multinational company Delivery Hero SE. With over 20 million app downloads, PedidosYa provides the best online delivery experience through 71,000+ online partners, including restaurants, shops, drugstores, and specialized markets.
Having constant access to fresh customer data is a key requirement for PedidosYa to improve and innovate our customer’s experience. Our internal stakeholders also require faster insights to drive agile business decisions. Back in early 2020, PedidosYa’s leadership tasked the data team to make the impossible possible. Our team’s mission was to democratize data by providing universal and secure access while creating a comprehensive information ecosystem across PedidosYa. We also had to achieve this goal while keeping costs under control— even during the migration stage and removing operational bottlenecks.
Challenges with legacy cloud infrastructure
PedidosYa first built its data platform on top of AWS. Our data warehouse ran on Redshift, and our data lake was in S3. We used Presto and Hue as the user interfaces for our data analysts. However, maintaining this infrastructure was a daunting task. Our legacy platform couldn’t keep up with the increasing analytics demands. For example, the data stored on S3 complemented by Presto/Hue required high operational overhead. This was because Presto and our IAM (identity access management) didn’t integrate well in our legacy ecosystem. Managing individual users and mapping IAM roles with groups and Kerberos was operationally time-consuming and costly. Further, sharding access on the S3 files was far too complicated to enable seamless ACLs (access control lists).
There were also challenges with workload management. Our data warehouse had batch data loaded overnight. If one analyst scheduled a query to run during the overnight ETL (extract, transform, load) workload, it would disrupt the current ETL task. This could stop the entire data pipeline. We’d have to wait until data engineers intervened with a manual fix.
It was also difficult to understand whether a query error was due to performance issues or platform resource exhaustion. This lack of clarity affected our data analysts’ ability to autonomously improve querying efficiency. Data team members needed to manually inspect personal queries looking for performance issues. Also, the current architecture was prone to a ‘tragedy of the commons’ situation; it was seen as an unlimited and free resource. As a result, it was impossible to disentangle the infrastructure from different stakeholder teams, as all had very different needs.
The decision to modernize our data warehouse
Given the growing challenges from our legacy platform, our tech team decided to transform our analytics environment with a modern data warehouse. They required the following key criteria from their next data platform:
- Scalability – The ability to grow with elastic infrastructure.
- Cost control – Cost management and transparency. These factors promote efficiency and ownership—both key aspects of data democratization.
- Metadata management – Intuitive data platform focusing on users’ previous SQL knowledge. Plus, being able to enrich the informational ecosystem with metadata, to diminish data gatekeepers.
- Ease of management – The team needed to reduce operational costs with a serverless solution. Data engineers wanted to focus on their key roles rather than acting as database administrators and infrastructure engineers. The team also wanted much higher availability, and to reduce the impact of maintenance windows and vacuum/analysis.
- Data governance and access rights – With a growing employee base with varying data access requirements, the team needed a simple yet comprehensive solution to understand and track user access to data.
Migrating to Google Cloud
After exploring other alternatives, we concluded Google Cloud had an answer to each of our decision drivers. Google Cloud’s serverless, managed, and integrated data platform, coupled with its seamless integration across open-source solutions, was the perfect answer for our organization. In particular, the natural integration with Airflow as a job orchestrator and Kubernetes for flexible on-demand infrastructure was key.
We used Dataflow together with Pub/Sub and Cloud Functions for our data ingestion requirements, which has made our deployment process with Terraform seamless. Because we set up everything in our environment programmatically, operation time has diminished. Google Cloud reduced the deployment process from about 16 hours in our legacy platform to 4 hours. This is partly due to the friendliness of automating the deployment (such as schema check, load test, table creation, build.) process with Terraform, Cloud Functions, Pub/Sub, Dataflow, and BigQuery on GCP. Input messages processed with Dataflow allow us to abstract and plan the schema changes according to the needs of the functional team. For example, schema changes raise an alarm, and then we can modify the raw layer table schema. By doing this, we ensure that backend modifications that we don’t control do not affect upper layers.
A key reason why we picked Google Cloud was because of its advanced cost and workload management coupled with its transparent log analytics. This information gives us a complete view into any query performance issues to make improvements on the fly. Further, we achieved a significant amount of cost savings by consolidating multiple tools to BigQuery.With BigQuery, we’ve been able to reduce our total cost per query by 5x.
This was due to a number of reasons:
- Automating pipeline deployment made it much simpler to maintain the data processing processes.
- Analysts are conscious about what queries they’re running, resulting in running better, more optimized queries.
- Analysts use a Data Studio dashboard to see their queries and all the associated costs. As a result, there’s a lot more transparency for each persona.
With these changes, we can easily manage and assign costs associated with each workload with their own cost centers using specific Google Cloud projects.
Change management is always challenging. However, BigQuery is intuitive and doesn’t have a steep learning curve from Hue/Hive on SQL basics. BigQuery also allowed the team to expand its capabilities and enabled them to properly work with nested structures, avoiding unnecessary joins and improving query efficiency. Additionally, we now use Data Catalog as our unique point of truth for metadata management. This allows our team to break the data access barriers and enable federation of data across the organization. By using Airflow to orchestrate everything, we keep track of every data stream. With this information, each end user can see their regularly used data entities’ status via the dashboard. This also adds transparency to our everyday data processes.
Finally, with Google Cloud’s IAM rules applied across the different products, data sharing and access is close to a noOps experience. We have programmatically implemented access according to roles and level access within the company. This allows certain pre-validated roles to view more sensitive information. These solutions help drive a more automated data governance experience.
Up next: Google Cloud AI/ML
The new stack based on BigQuery has created significant productivity gains. Freed from the burden of operational management, PedidosYa’s data team can now focus on adding value through data tools and products.
- Our data engineers are better equipped to integrate constantly changing transactional and operational data.
- The dataOps team can automate the infrastructure and provide autonomy to the end user.
- Our data quality team can focus on bringing added value to data stakeholders.
- Data scientists and data analytics can spend more time analyzing data and less time asking data gatekeepers for data access.
PedidosYa can now democratize data access with a well-governed architecture. We are still at the beginning of our journey, but we are closer to achieving our vision of building a data-driven organization. Up next: expanding our artificial intelligence and machine learning capabilities.
Tune in to Google Cloud’s Applied ML Summit on June 10th, 2021, or listen on-demand later, to learn how to apply groundbreaking machine learning technology in your projects.
10184
Of your peers have already watched this video.
1:00 Minutes
The most insightful time you'll spend today!
Predict User Churn on Gaming Apps with Google Analytics Data using BigQuery ML
User retention can be a major challenge for mobile game developers. According to the Mobile Gaming Industry Analysis in 2019, most mobile games only see a 25% retention rate for users after the first day. To retain a larger percentage of users after their first use of an app, developers can take steps to motivate and incentivize certain users to return. But to do so, developers need to identify the propensity of any specific user returning after the first 24 hours.
In this blog post, we will discuss how you can use BigQuery ML to run propensity models on Google Analytics 4 data from your gaming app to determine the likelihood of specific users returning to your app.
You can also use the same end-to-end solution approach in other types of apps using Google Analytics for Firebase as well as apps and websites using Google Analytics 4. To try out the steps in this blogpost or to implement the solution for your own data, you can use this Jupyter Notebook.
Using this blog post and the accompanying Jupyter Notebook, you’ll learn how to:
- Explore the BigQuery export dataset for Google Analytics 4
- Prepare the training data using demographic and behavioural attributes
- Train propensity models using BigQuery ML
- Evaluate BigQuery ML models
- Make predictions using the BigQuery ML models
- Implement model insights in practical implementations
Google Analytics 4 (GA4) properties unify app and website measurement on a single platform and are now default in Google Analytics. Any business that wants to measure their website, app, or both, can use GA4 for a more complete view of how customers engage with their business. With the launch of Google Analytics 4, BigQuery export of Google Analytics data is now available to all users. If you are already using a Google Analytics 4 property, you can follow this guide to set up exporting your GA data to BigQuery.
Once you have set up the BigQuery export, you can explore the data in BigQuery. Google Analytics 4 uses an event-based measurement model. Each row in the data is an event with additional parameters and properties. The Schema for BigQuery Export can help you to understand the structure of the data.
In this blogpost, we use the public sample export data from an actual mobile game app called “Flood It!” (Android, iOS) to build a churn prediction model. But you can use data from your own app or website.
Here’s what the data looks like. Each row in the dataset is a unique event, which can contain nested fields for event parameters.
SELECT *FROM `firebase-public-project.analytics_153293282.events_*`TABLESAMPLE SYSTEM (1 PERCENT)

This dataset contains 5.7M events from over 15k users.
SELECTCOUNT(DISTINCT user_pseudo_id) as count_distinct_users,COUNT(event_timestamp) as count_eventsFROM`firebase-public-project.analytics_153293282.events_*

Our goal is to use BigQuery ML on the sample app dataset to predict propensity to user churn or not churn based on users’ demographics and activities within the first 24 hours of app installation.

In the following sections, we’ll cover how to:
- Pre-process the raw event data from GA4
- Identify users & the label feature
- Process demographic features
- Process behavioral features
- Train classification model using BigQuery ML
- Evaluate the model using BigQueryML
- Make predictions using BigQuery ML
- Utilize predictions for activation
Pre-process the raw event data
You cannot simply use raw event data to train a machine learning model as it would not be in the right shape and format to use as training data. So in this section, we’ll go through how to pre-process the raw data into an appropriate format to use as training data for classification models.
This is what the training data should look like for our use case at the end of this section:

Notice that in this training data, each row represents a unique user with a distinct user ID (user_pseudo_id).
Identify users & the label feature
We first filtered the dataset to remove users who were unlikely to return the app anyway. We defined these ‘bounced’ users as ones who spent less than 10 mins with the app. Then we labeled all remaining users:
- churned: No event data for the user after 24 hours of first engaging with the app.
- returned: The user has at least one event record after 24 hours of first engaging with the app.
For your use case, you can have a different definition of bounce and churning. Also you can even try to predict something else other than churning, e.g.:
- whether a user is likely to spend money on in-game currency
- likelihood of completing n-number of game levels
- likelihood of spending n amount of time in-game etc.
In such cases, label each record accordingly so that whatever you are trying to predict can be identified from the label column.
From our dataset, we found that ~41% users (5,557) bounced. However, from the remaining users (8,031), ~23% (1,883) churned after 24 hours:
SELECTbounced,churned,COUNT(churned) as count_usersFROMbqmlga4.returningusersGROUP BY 1,2ORDER BY bounced

To create these bounced and churned columns, we used the following snippet of SQL code.
...#churned = 1 if last_touch within 24 hr of app installation, else 0IF (user_last_engagement < TIMESTAMP_ADD(user_first_engagement,INTERVAL 24 HOUR),1,0 ) AS churned,#bounced = 1 if last_touch within 10 min, else 0IF (user_last_engagement <= TIMESTAMP_ADD(user_first_engagement,INTERVAL 10 MINUTE),1,0 ) AS bounced,...
You can view the Jupyter Notebook for the full query used for materializing the bounced and churned labels.
Process demographic features
Next, we added features both for demographic data and for behavioral data spanning across multiple columns. Having a combination of both demographic data and behavioral data helps to create a more predictive model.
We used the following fields for each user as demographic features:
geo.countrydevice.operating_systemdevice.language
A user might have multiple unique values in these fields — for example if a user uses the app from two different devices. To simplify, we used the values from the very first user engagement event.
CREATE OR REPLACE VIEW bqmlga4.user_demographics AS (WITH first_values AS (SELECTuser_pseudo_id,geo.country as country,device.operating_system as operating_system,device.language as language,ROW_NUMBER() OVER (PARTITION BY user_pseudo_id ORDER BY event_timestamp DESC) AS row_numFROM `firebase-public-project.analytics_153293282.events_*`WHERE event_name="user_engagement")SELECT * EXCEPT (row_num)FROM first_valuesWHERE row_num = 1 #first engagement);
Process behavioral features
There is additional demographic information present in the GA4 export dataset, e.g. app_info, device, event_params, geo etc. You may also send demographic information to Google Analytics through each hit via user_properties. Furthermore, if you have first-party data on your own system, you can join that with the GA4 export data based on user_ids.
To extract user behavior from the data, we looked into the user’s activities within the first 24 hours of first user engagement. In addition to the events automatically collected by Google Analytics, there are also the recommended events for games that can be explored to analyze user behavior. For our use case, to predict user churn, we counted the number of times the follow events were collected for a user within 24 hours of first user engagement:
user_engagementlevel_start_quickplaylevel_end_quickplaylevel_complete_quickplaylevel_reset_quickplaypost_scorespend_virtual_currencyad_rewardchallenge_a_friendcompleted_5_levelsuse_extra_steps
The following query shows how these features were calculated:
WITHevents_first24hr AS (SELECTe.*FROM`firebase-public-project.analytics_153293282.events_*` eJOINbqmlga4.returningusers rONe.user_pseudo_id = r.user_pseudo_idWHERETIMESTAMP_MICROS(e.event_timestamp) <= r.ts_24hr_after_first_engagement)SELECTuser_pseudo_id,SUM(IF(event_name = 'user_engagement', 1, 0)) AS cnt_user_engagement,# ... repeated for all behavior data ...SUM(IF(event_name = 'use_extra_steps', 1, 0)) AS cnt_use_extra_steps,FROMevents_first24hrGROUP BY1
View the notebook for the query used to aggregate and extract the behavioral data. You can use different sets of events for your use case. To view the complete list of events, use the following query:
SELECTevent_name,COUNT(event_name) as event_countFROM`firebase-public-project.analytics_153293282.events_*`GROUP BY 1ORDER BYevent_count DESC
After this we combined the features to ensure our training dataset reflects the intended structure. We had the following columns in our table:
- User ID:
user_pseudo_id
- Label:
churned
- Demographic features
countrydevice_osdevice_language
- Behavioral features
cnt_user_engagementcnt_level_start_quickplaycnt_level_end_quickplaycnt_level_complete_quickplaycnt_level_reset_quickplaycnt_post_scorecnt_spend_virtual_currencycnt_ad_rewardcnt_challenge_a_friendcnt_completed_5_levelscnt_use_extra_stepsuser_first_engagement
At this point, the dataset was ready to train the classification machine learning model in BigQuery ML. Once trained, the model will output a propensity score between churn (churned=1) or return (churned=0) indicating the probability of a user churning based on the training data.
Train classification model
When using the CREATE MODEL statement, BigQuery ML automatically splits the data between training and test. Thus the model can be evaluated immediately after training (see the documentation for more information).
For the ML model, we can choose among the following classification algorithms where each type has its own pros and cons:

Often logistic regression is used as a starting point because it is the fastest to train. The query below shows how we trained the logistic regression classification models in BigQuery ML.
CREATE OR REPLACE MODEL bqmlga4.churn_logregTRANSFORM(EXTRACT(MONTH from user_first_engagement) as month,EXTRACT(DAYOFYEAR from user_first_engagement) as julianday,EXTRACT(DAYOFWEEK from user_first_engagement) as dayofweek,EXTRACT(HOUR from user_first_engagement) as hour,* EXCEPT(user_first_engagement, user_pseudo_id))OPTIONS(MODEL_TYPE="LOGISTIC_REG",INPUT_LABEL_COLS=["churned"]) ASSELECT*FROMbqmlga4.train
We extracted month, julianday, and dayofweek from datetimes/timestamps as one simple example of additional feature preprocessing before training. Using TRANSFORM() in your CREATE MODEL query allows the model to remember the extracted values. Thus, when making predictions using the model later on, these values won’t have to be extracted again. View the notebook for the example queries to train other types of models (XGBoost, deep neural network, AutoML Tables).
Evaluate model
Once the model finished training, we ran ML.EVALUATE to generate precision, recall, accuracy and f1_score for the model:
SELECT*FROMML.EVALUATE(MODEL bqmlga4.churn_logreg)

The optional THRESHOLD parameter can be used to modify the default classification threshold of 0.5. For more information on these metrics, you can read through the definitions on precision and recall, accuracy, f1-score, log_loss and roc_auc. Comparing the resulting evaluation metrics can help to decide among multiple models.Furthermore, we used a confusion matrix to inspect how well the model predicted the labels, compared to the actual labels. The confusion matrix is created using the default threshold of 0.5, which you may want to adjust to optimize for recall, precision, or a balance (more information here).
SELECTexpected_label,_0 AS predicted_0,_1 AS predicted_1FROMML.CONFUSION_MATRIX(MODEL bqmlga4.churn_logreg)

This table can be interpreted in the following way:

Make predictions using BigQuery ML
Once the ideal model was available, we ran ML.PREDICT to make predictions. For propensity modeling, the most important output is the probability of a behavior occurring. The following query returns the probability that the user will return after 24 hrs. The higher the probability and closer it is to 1, the more likely the user is predicted to return, and the closer it is to 0, the more likely the user is predicted to churn.
SELECTuser_pseudo_id,returned,predicted_returned,predicted_returned_probs[OFFSET(0)].prob as probability_returnedFROMML.PREDICT(MODEL bqmlga4.churn_logreg,(SELECT * FROM bqmlga4.train)) #can be replaced with a proper test dataset
Utilize predictions for activation
Once the model predictions are available for your users, you can activate this insight in different ways. In our analysis, we used user_pseudo_id as the user identifier. However, ideally, your app should send back the user_id from your app to Google Analytics. In addition to using first-party data for model predictions, this will also let you join back the predictions from the model into your own data.
- You can import the model predictions back into Google Analytics as a user attribute. This can be done using the Data Import feature for Google Analytics 4. Based on the prediction values you can Create and edit audiences and also do Audience targeting. For example, an audience can be users with prediction probability between 0.4 and 0.7, to represent users who are predicted to be “on the fence” between churning and returning.
- For Firebase Apps, you can use the Import segments feature. You can tailor user experience by targeting your identified users through Firebase services such as Remote Config, Cloud Messaging, and In-App Messaging. This will involve importing the segment data from BigQuery into Firebase. After that you can send notifications to the users, configure the app for them, or follow the user journeys across devices.
- Run targeted marketing campaigns via CRMs like Salesforce, e.g. send out reminder emails.
You can find all of the code used in this blogpost in the Github repository:
What’s next?
Continuous model evaluation and re-training
As you collect more data from your users, you may want to regularly evaluate your model on fresh data and re-train the model if you notice that the model quality is decaying.
Continuous evaluation—the process of ensuring a production machine learning model is still performing well on new data—is an essential part in any ML workflow. Performing continuous evaluation can help you catch model drift, a phenomenon that occurs when the data used to train your model no longer reflects the current environment.
To learn more about how to do continuous model evaluation and re-train models, you can read the blogpost: Continuous model evaluation with BigQuery ML, Stored Procedures, and Cloud Scheduler
More resources
If you’d like to learn more about any of the topics covered in this post, check out these resources:
- BigQuery export of Google Analytics data
- BigQuery ML quickstart
- Events automatically collected by Google Analytics 4
- Qwiklabs: Create ML models with BigQuery ML
Or learn more about how you can use BigQuery ML to easily build other machine learning solutions:
- How to build demand forecasting models with BigQuery ML
- How to build a recommendation system on e-commerce data using BigQuery ML
Let us know what you thought of this post, and if you have topics you’d like to see covered in the future! You can find us on Twitter at @polonglin and @_mkazi_.Thanks to reviewers: Abhishek Kashyap, Breen Baker, David Sabater Dinter.
Moving Flock Freight to Google Cloud for a more efficient, resilient and environmentally sustainable shipping supply chain
3149
Of your peers have already read this article.
3:30 Minutes
The most insightful time you'll spend today!
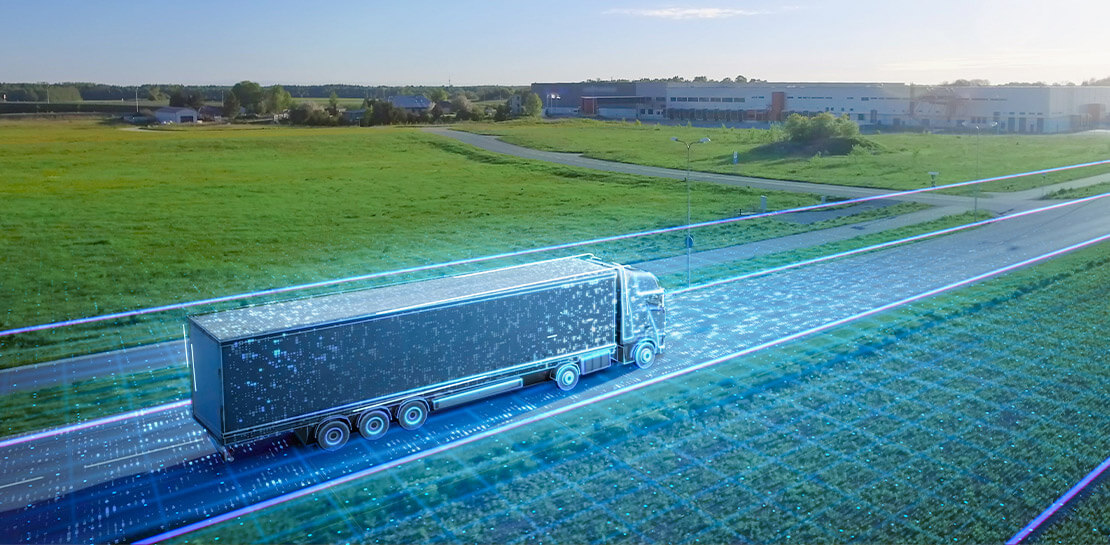
Commercial trucks often travel partially empty because many shippers don’t have enough cargo to fill an entire container or trailer. Although offering available space to other shippers helps minimize carbon emissions and reduce operating costs, most trucking companies can’t efficiently schedule, track, or deliver multiple freight loads.
Companies have always struggled to ship over-the-road freight efficiently. However,recent economic events have created an unprecedented logistics and transportation crisis that continues to disrupt supply chains, delay deliveries, and significantly raise the price of basic goods. Since some stores can’t keep their shelves fully stocked, many people across the country are finding it more difficult than ever to buy the things they need at an affordable price.
Although exacerbated by the pandemic, many of these supply chain issues have existed for decades. That’s why, in 2015, Flock Freight was started with the mission of reducing waste and inefficiency from the supply chain by reimagining the way freight moves. First to market with advanced algorithms that enable pooling shipments at scale, we create a new standard of service for shippers, increase revenue for carriers and reduce the impact of carbon emissions through shared truckload (STL) service.
Our technology helps lower prices compared to full truckload (FTL) by enabling shippers to only pay for the space they need—and maintain full control over pickup and delivery dates. Flock Freight also optimizes travel routes to speed up deliveries compared to traditional less than truckload (LTL), while eliminating unnecessary shipping hub transfers to minimize damage to cargo.
Today, thousands of shippers and trucking companies across the U.S. use Flock Freight to schedule shared truckloads, lower shipping costs, quickly deliver and track goods, and reduce their carbon footprint by up to 40%. Flock Freight further offsets carbon emissions by buying carbon credits for every FlockDirect™ guaranteed shared truckload shipment—at no extra cost to shippers.
Moving Flock Freight to Google Cloud
We founded Flock Freight with a small team based in southern California. We soon realized we needed a more scalable and affordable technology stack to support our rapidly growing platform and team. After joining the Google for Startups Cloud Program and consulting with dedicated Google startup experts, we decided to move all our data and applications to Google Cloud.
The highly secure-by-design infrastructure of Google Cloud now enables thousands of Flock Freight customers to move their freight faster, cheaper, and with less damage than traditional shipping methods. Specifically, we rely on Google Kubernetes Engine (GKE) to support the combinatorial optimization and machine learning (ML) algorithms and services that identify, pool, and schedule shared truckloads. We also leverage GKE to rapidly develop, deploy, and manage new applications and services.
In addition, we leverage Cloud SQL to automate database provisioning, storage capacity management, and other time-consuming tasks. Cloud SQL easily integrates with existing apps and Google Cloud services such as GKE and Pub/Sub. Lastly, we use Compute Engine to create and run virtual machines, optimize resource utilization, and lower computing costs by up to 91%. These cost savings allow us to shift more resources to R&D and rapidly develop new solutions and services for our customers.
Building a greener, more resilient, and responsive supply chain
The Google for Startups Cloud Program and dedicated Google startup experts were instrumental in helping us manage cloud infrastructure cost and maintaining very high SLAs, helping Flock Freight to focus on developing a comprehensive shipping platform that powers shared truckloads and drives positive industry change.
We especially want to highlight the Google Cloud research credits we relied on to launch Flock Freight and make rapid progress toward transforming the shipping industry. To this day, we continue to work with Google Cloud Managed Services partner DoiT International International to further scale and optimize operations on Google Cloud.
We’re proud of the results we’re delivering for our customers. For example, a home improvement importer now enjoys faster, safer, and easier shipping with 99.9% damage-free service and a 97.5% on-time delivery rate. A packaging supplier continues to maintain a 99% on-time delivery streak and decrease carbon emissions by 37%, while a mineral water company consistently reduces delivery expenses upwards of 50%.
Nationwide demand for shared truckloads continues to increase as the shipping industry works to lower costs and alleviate supply chain disruptions. With the Flock Freight platform, companies are building a more sustainable and resilient supply chain by efficiently combining multiple shipments into shared truckloads.
If you want to learn more about how Google Cloud can help your startup, visit our page here to get more information about our program, and sign up for our communications to get a look at our community activities, digital events, special offers, and more.
More Relevant Stories for Your Company

The Future of Cloud Computing: Choose Your Own Services and Payment Options
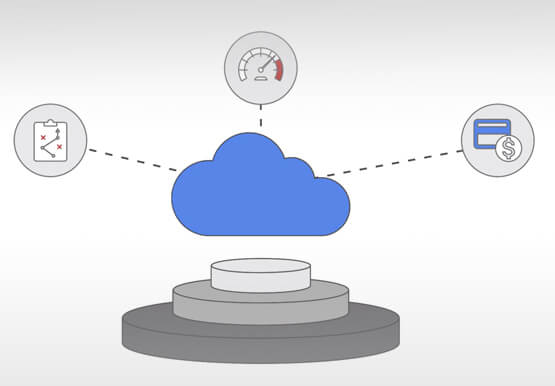
As the saying goes, “it’s hard to make predictions, especially about the future.” Some organizations find it challenging to predict what cloud resources they’ll need in months or years ahead. Every organization is on its own unique cloud journey. To help, we’re developing new ways for customers to consume and


A Path to Predictable Cloud Costs
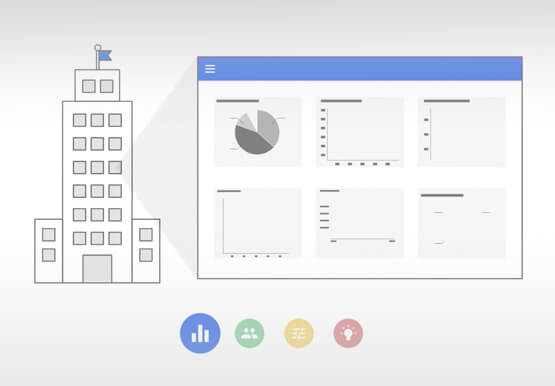
Google Cloud's cost management tools provide the visibility, accountability, control, and intelligence you need so that you can scale your business in the cloud with confidence. Tailored to meet the needs of organizations of all sizes, these tools help reduce complexity and increase the predictability of your cloud costs. These

Canada’s Climate Scientists Use Google Earth Engine to Observe Foliage Density in Near-real Time
Climate scientists face a deluge of environmental data to analyze and interpret from real-time sensors and satellites across the globe. The stakes are as high as our planet’s long-term future, but rapidly changing conditions are already impacting communities through extreme events like floods and wildfires as well as management of

What Our Google Cloud Experts Say About Multi-cloud Journey
Do you want to fire up a bunch of techies? Talk about multicloud! There is no shortage of opinions. I figured we should tackle this hot topic head-on, so I recently talked to four smart folks—Corey Quinn of Duckbill Group, Armon Dadgar of Hashicorp, Tammy Bryant Butow of Gremlin, and James Watters of VMware—about what multicloud is
