





Kaluza & Google Cloud: Committed to Powering Up 73 Million EVs by 2040

1223
Of your peers have already read this article.
4:00 Minutes
The most insightful time you'll spend today!
Electric vehicles already account for one in seven car sales globally, and with new gas and diesel cars being phased out across the world, global sales are forecast to reach 73 million units in 2040. But with power grids becoming increasingly dependent on variable energy sources such as wind and solar, rising demand from electric vehicles risks overstraining grids at peak times, potentially leading to power outages.
At Kaluza, we believe that our platform has a vital role to play in helping power grids and utility companies to stabilize their networks, while at the same time delivering more affordable, cleaner energy to the consumer. Powered by Google Cloud, the advanced algorithms behind our Kaluza Flex solution automatically charge electric vehicles when the power supply is at its cheapest and greenest, helping to accelerate the global transition towards a zero-carbon future.
Decarbonizing the grid with low-cost smart charging programs
Launched by OVO Energy in 2019, Kaluza has taken its deep understanding of the energy market to partner with some of the world’s major energy suppliers and vehicle manufacturers, including AGL in Australia, Fiat and Nissan in the UK, and Mitsubishi Corporation and Chubu in Japan, to launch smart charging programs that help customers save money while reducing their carbon footprint.
A good example of this is Charge Anytime, which we recently launched with OVO Energy in the UK. With this tariff, customers use Kaluza to smart-charge their electric vehicle, and pay just 10p per kWh — a third of their household electricity rate — to do so. This means that if the customer plugs in their vehicle to charge when they get home from work at, say, 6:00 p.m. — a time when both demand and the carbon intensity on the grid are at their highest — their vehicle will then be smartly charged at the lowest cost and greenest periods throughout the night, ready for when they need it in the morning.
This smart charging reduces the energy company’s costs by enabling them to take advantage of lower wholesale electricity prices. These savings are then passed on to the end customer through tariffs such as Charge Anytime, saving customers hundreds of pounds a year and reducing their carbon footprint. Meanwhile, the National Grid is able to reduce the strain on the network during peak hours, while simultaneously using up the excess renewable energy that might otherwise have gone to waste.
Optimized charging schedules, fueled by Google Cloud
Behind Kaluza’s smart charging solution lies some sophisticated technology, all of which is built on Google Cloud. Our core optimization engine gathers real-time data from a wide range of sources, including battery and charging data from the electric vehicles, and data from the energy suppliers and grid operators, such as the carbon intensity, and price forecasts.
After passing through our real-time data backbone, that data is stored in BigQuery where it’s used to train and validate our smart charging optimization models. These models are then deployed with Google Kubernetes Engine so that whenever a customer plugs in an electric vehicle, data from that vehicle passes in real-time through our optimization engine to calculate the ideal charging schedule for that vehicle, ensuring it uses the cheapest, least carbon-intensive energy available.
Customer interface: easy to use, simple to build
Of course, the customer isn’t aware of any of this complexity. All they need to do is open their charging app and use Kaluza’s intuitive interface to set what time they want their car to be ready and how much charge they want in their battery. Then they simply plug in their car, and our algorithms take care of the rest.
Customers can also use Kaluza to view breakdowns of how much carbon and money they’ve saved, along with insights around things like billing and battery life, all of which is backed by Cloud SQL.
With Google Cloud, we were able to roll out this end-user app very quickly. Instead of having to build a different version of the app for each operating system, we were able to build an OS-agnostic version using Flutter, which then builds the app for each platform, enabling us to get to market faster.
This has been a benefit of our architecture in general. With Google Cloud taking the complexity out of otherwise time-consuming development processes, we’ve been able to experiment with and validate propositions rapidly, and roll out new products and features at speed, to ensure that we remain at the vanguard of a rapidly evolving sector.
Giving energy companies full visibility with BigQuery and Looker
As for the grid operators and energy companies, the Kaluza platform allows them to visualize how many participating electric vehicles are plugged into the network at any one time. BigQuery and Looker Studio dashboards provide granular insights, such as how many vehicles are idle, how many are charging, and how well our optimization engine is working.
The platform also allows companies to view those vehicles on an aggregate level, and identify any issues. Google Cloud machine learning capabilities can even allow grid operators to use this aggregate view to forecast how much energy will be required at any one time, and dial the power generation up or down accordingly.
Ultimately, these insights help network operators and utility companies to optimize energy usage, and balance out the peaks and troughs of supply and demand, ensuring that excess renewable energy is captured, while carbon-intensive fuel use is reduced.
Feeding energy back into the grid with bidirectional charging
Vehicle-to-Grid (V2G), or bidirectional, charging is something that we are very excited about, and have begun rolling out in the UK, as we prepare to launch in other global markets. Built on the same Google Cloud architecture as the rest of Kaluza Flex, V2G not only enables smart charging, but allows electric vehicles to feed stored energy back into the grid.
Imagine an electric vehicle battery that can store 40 kWh of energy, but only uses 5 kWh a day. That leaves 35 kWh a day that can be charged to the battery during times of low demand, when energy is cheapest and greenest, then fed back into the network during peak periods, removing the need for more fossil fuels to be burned to meet demand.
Not only does V2G go further than conventional smart charging to make use of renewable energy when it’s abundant and support the balancing of the energy system, it also results in even lower energy prices for the customer, as they are effectively selling energy back to the grid. For example, as part of a large domestic V2G trial made in partnership with OVO and Nissan, Kaluza saved customers an average of £450 a year, with some customers saving up to £800/year by selling surplus energy back to the grid — transforming their homes into mini power stations.
With Kaluza Flex, we have a platform that offers benefits for all parties, from the grid operators, through to energy retailers and vehicle manufacturers, and all the way to the customer. Now, our aim is to bring this exciting offering to as many markets as possible, a goal which is made easier thanks to the scalable infrastructure and time-saving solutions of Google Cloud.
As more people make the switch to electric vehicles, our goal is to ensure that smart charging becomes standard practice, as we help to deliver on the potential of electric vehicles to contribute to a greener, decarbonized future.
GKE Feature Guide: 5 Ways to Optimize Your Kubernetes Clusters

1567
Of your peers have already read this article.
7:00 Minutes
The most insightful time you'll spend today!
In this post, we’ll be discussing 5 features in GKE you can use to optimize your clusters today. To get started with testing these in GKE, check out our interactive tutorials for getting started with standard and autopilot clusters.
If you find value from running workloads on Kubernetes clusters in your organization, chances are your footprint will grow – be it through larger clusters or more clusters.
Whichever your approach, one thing is certain: you’ll have more resources that you pay for. And you know what they say – more resources, more problems. The more resources you have across clusters, the more critical it becomes to make sure you’re using them efficiently.
Google Kubernetes Engine has numerous features built-in that you as a cluster admin can use to navigate this continuous journey of optimizing your use of resources in GKE.
Let’s review five of them you can get started with today.
#1 – Cluster view cost optimization in the console
If you don’t know where to start with optimizing your clusters, the best place to start is looking for a big problem that stands out. That’s probably most visible by looking at a view that spans all of your clusters.
In GKE, we have a cluster-level cost optimization tab built into the console, rich with information that may be cumbersome to gather on your own otherwise.
You can find this as seen in the following image:
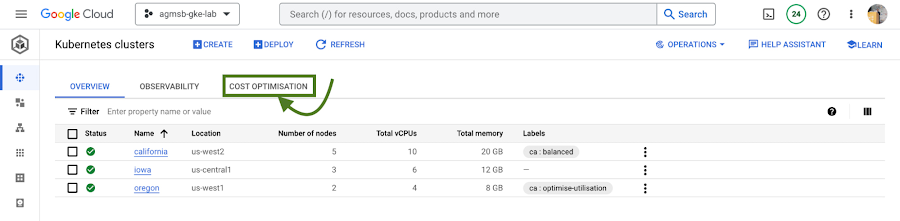
Fig. 1 – Navigating to the cost optimization tab in the cloud console
Once you navigate to this tab, you’re greeted with a time series visualization.
For GKE standard clusters, this visualization is a time series representation that shows three key dimensions for CPU and Memory across all of your clusters in a project:
Total CPU/Memory allocatable– # of CPU or GB of memory that can be allocated to user workloadsTotal CPU/Memory request– # of CPU or GB of memory that has been requested by user workloadsTotal CPU/Memory usage– actual usage by # of CPU or GB of memory by user workloads
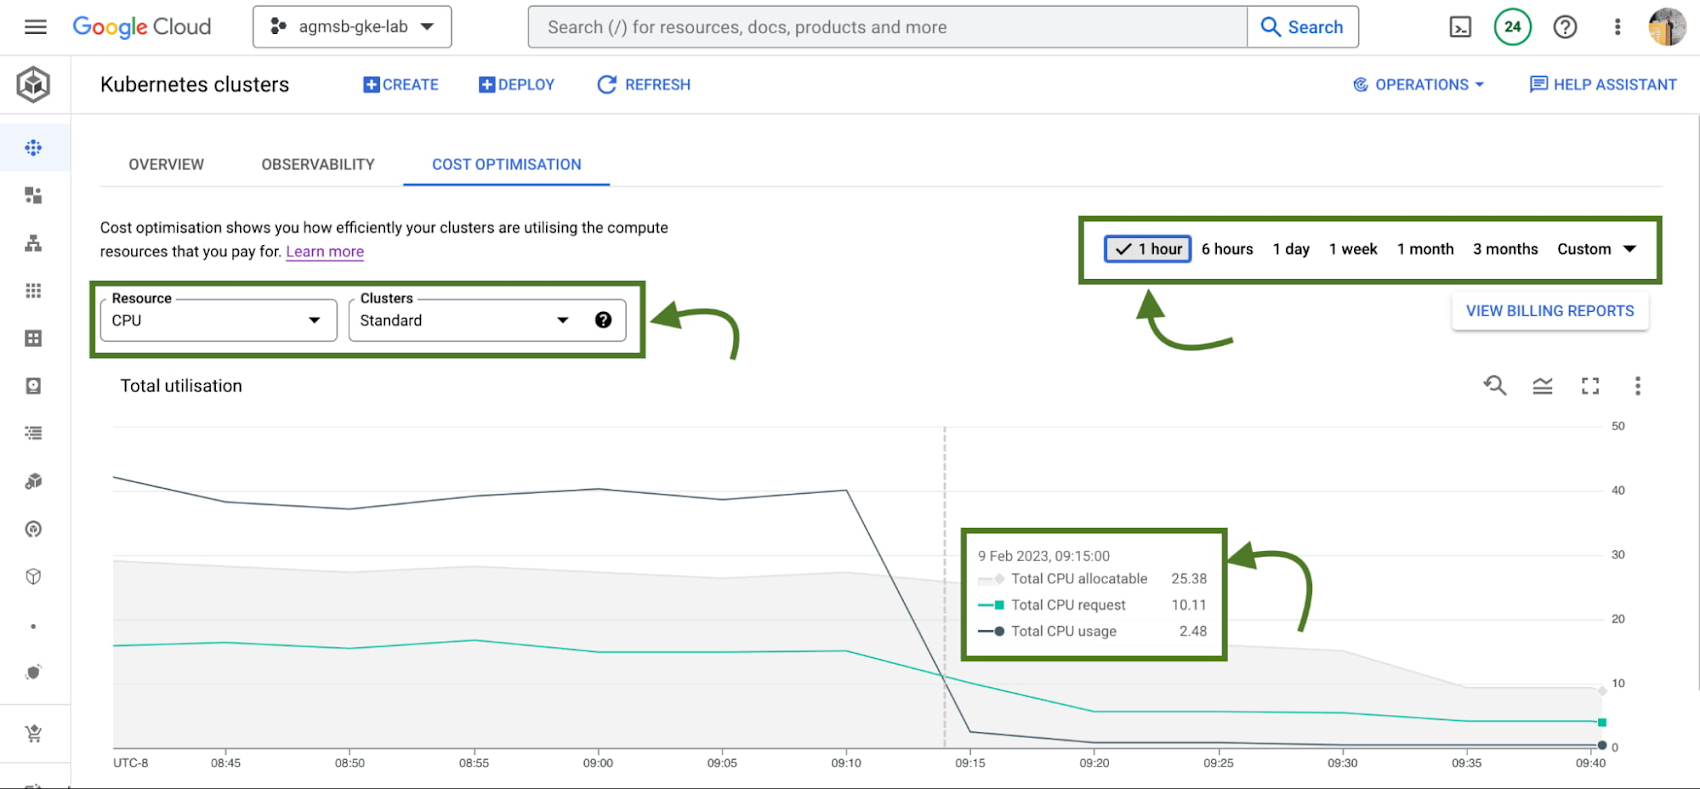
Fig. 2 – Allocatable, requested, and usage time series data across CPU or memory in all standard GKE clusters over a specified window
Analyzing these in relationship to one another can help identify answers to important optimization questions such as:
- Do we have too much allocatable CPU and memory idle across our GKE standard clusters? If so, can we do things like re-evaluate the machine types we use in node pools? This can help us bin pack the cluster, by having a higher percentage of allocatable resources allocated to Pod requests.
- Are workloads running in our GKE standard clusters requesting too much CPU and memory that goes unused? If so, can we do things like work with workload owners to adjust requests? This can help us workload right-size, by setting requests to more closely reflect expected usage.
If we’re using GKE Autopilot, this time series visualization will look slightly different, as seen in the following image:
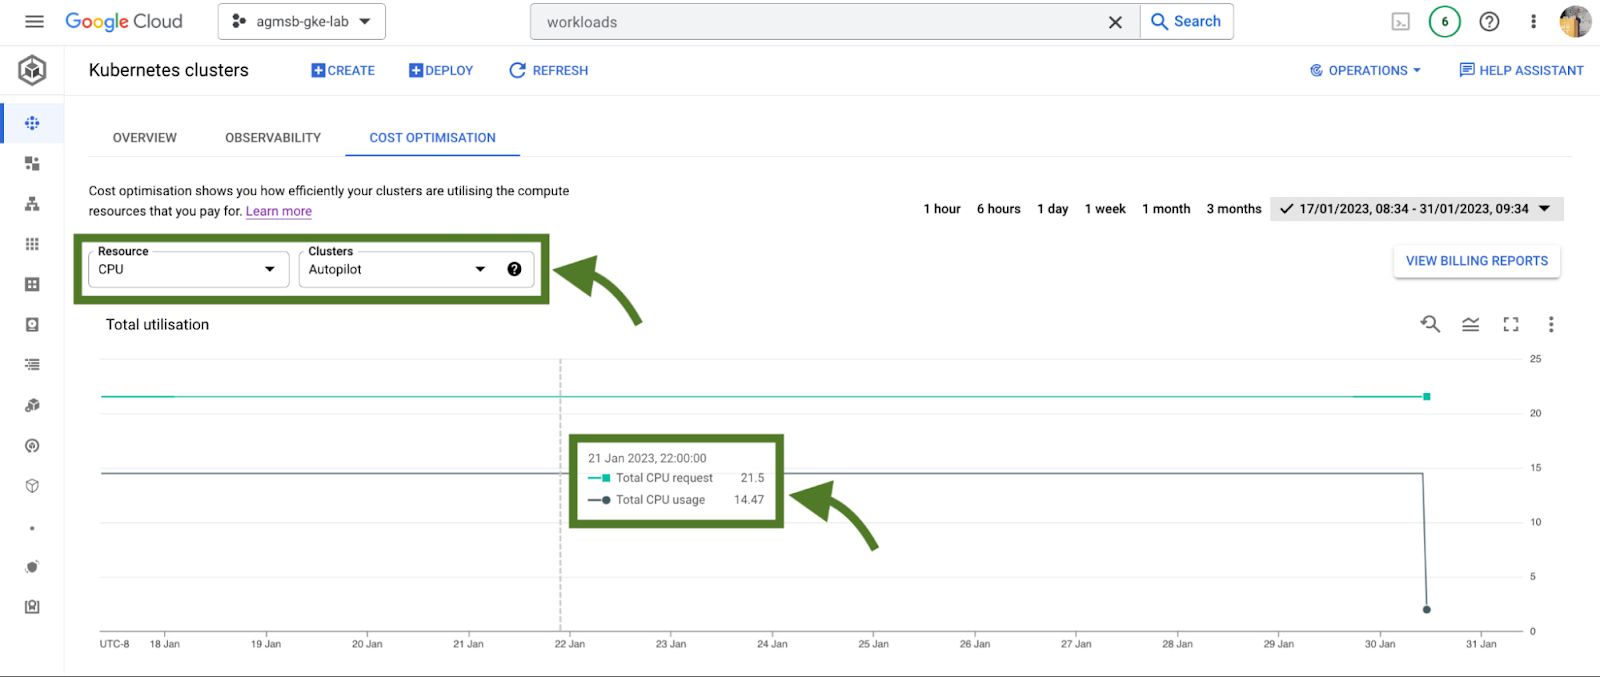
Fig. 3 – Requested and usage time series data across CPU or memory in all GKE Autopilot clusters
In the case of GKE Autopilot clusters, we’re only able to view the Total CPU/Memory request and the Total CPU/Memory usage data. But nothing here is actually missing!
In Autopilot clusters, you only pay per Pod based on its requests; Autopilot automatically handles provisioning the infrastructure that gives us our allocatable resources based on whatever you set Pod requests to. When we trade in that ownership of node provisioning, we also trade in the control to optimize at that layer.
For a cluster administrator, this information can be a spark to spur actions such as diving into individual clusters or meeting with workload teams to work through their requests and limits that they set for workloads. In our research, this is perhaps the most impactful area many teams optimize. We’ll dive into how GKE can enable this exercise a bit further in this blog.
When going down those paths, it helps to have financial data to quantify the impact of the optimization to the business. Gathering this info on your own can require a bit of work (for some, a lot of spreadsheets as well!), but luckily GKE has another native feature to help make this easily accessible to you.
#2 – GKE cost allocation
GKE cost allocation is a native GKE feature that integrates workload usage with Cloud Billing and its reports, allowing you to see and alert on billing not only on a per-cluster level, but on a per-Kubernetes namespace or per-Kubernetes label level.
It must be enabled on your cluster in order for it to function, so if you’re working with an existing GKE cluster and want to enable it, use the following gcloud command once you have set your appropriate zone or region:
$ gcloud beta container clusters create $CLUSTER_NAME \
    --enable-cost-allocation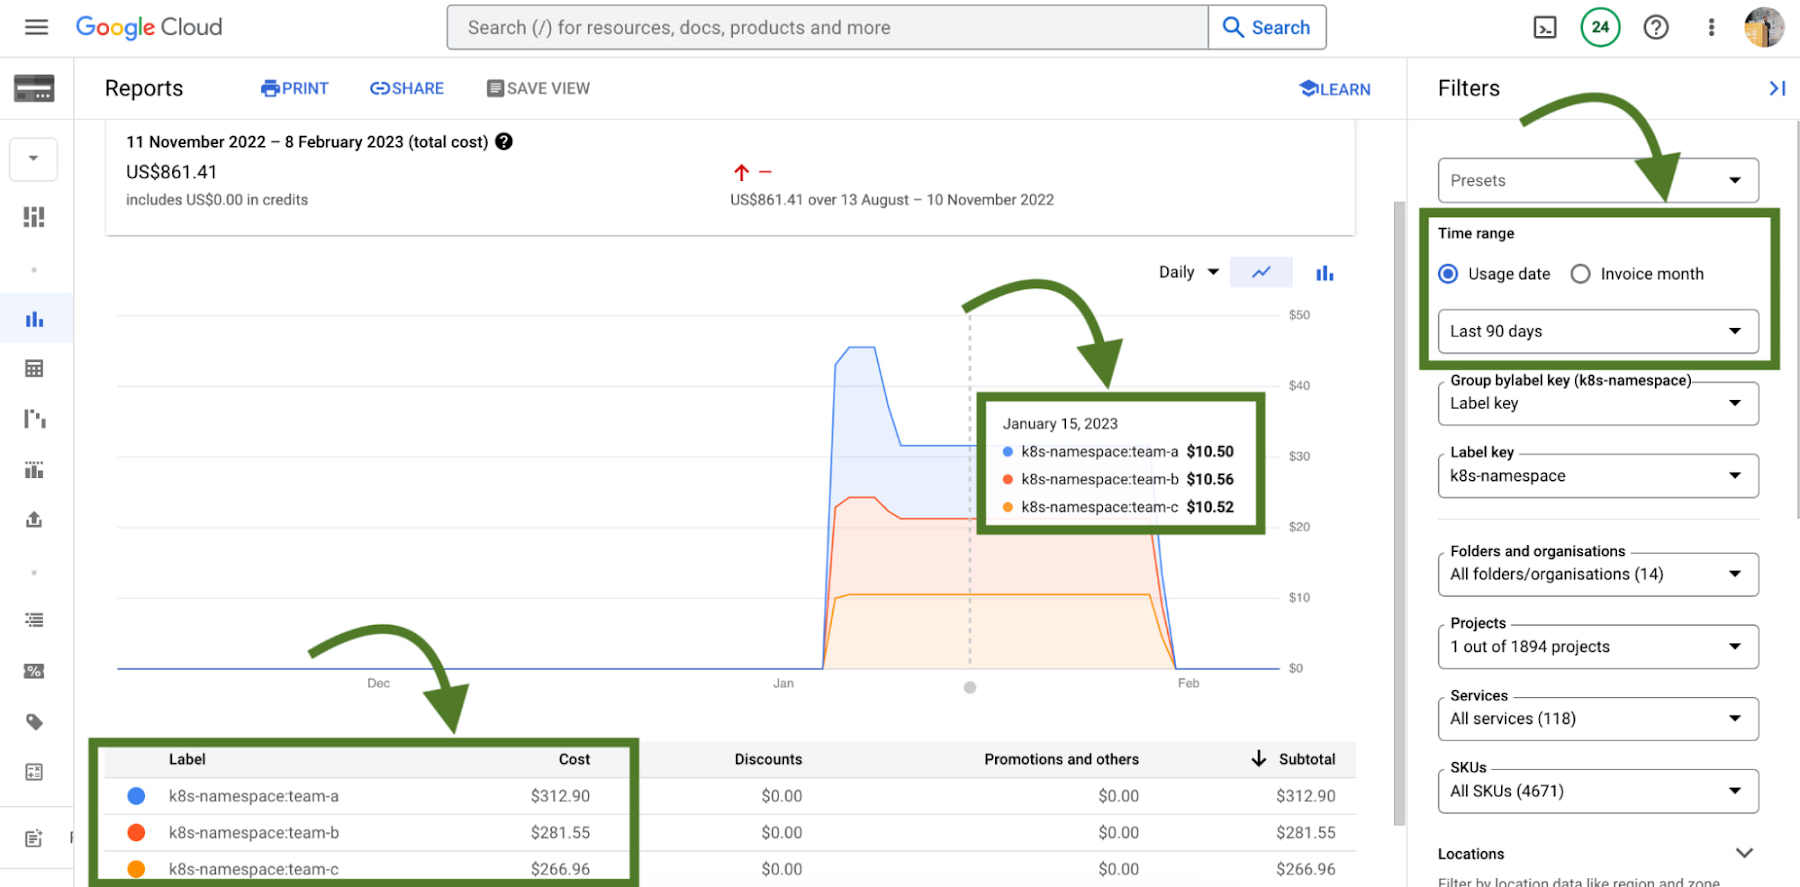
Without GKE cost allocation, the financial impact of a cluster and all of the different workloads it might run were a bit obfuscated. With the cluster as the deepest level of detail in billing, finding areas to optimize or even performing showback and chargeback was a challenge.
With Namespaces and Labels bubbling up into billing reports, you can now understand the cost of the CPU/Memory requests that workloads define in Kubernetes. A caveat – this works best when you are using Namespaces and Labels to logically define and organize teams and their workloads.
This integration also gives the bigger picture of optimization – in that GKE does not typically live on an island! In theory, workloads in a team’s namespace could be using external backing services like Cloud Memorystore that are also a key part of its usage.
Because Cloud Billing data has all GCP services, we can now filter and query across namespaces and their corresponding backing services.
# 3 – Workload view cost optimization in the console
Once you have teams identified that you may want to work with, GKE provides a cost optimization tab at the workload level, where you can then begin to drill down and identify specific workloads that could be optimized through an exercise called “workload right-sizing”. This is the act of making sure that Pod requests more closely reflect their expected usage.
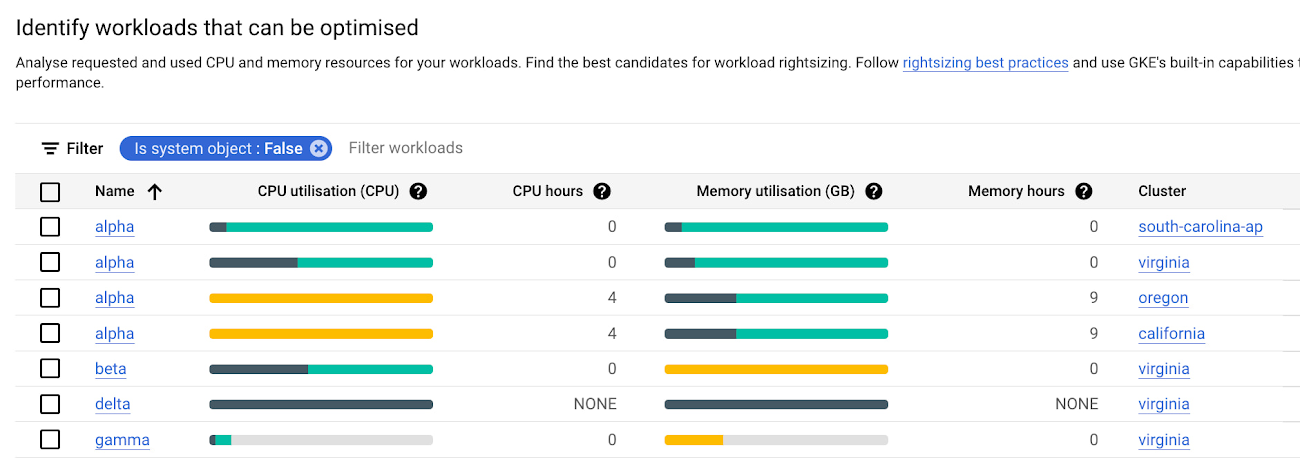
As you can see here, we’re given bar charts to represent the relationship of usage, requests, and limits to one another.
- Dark green: CPU/Memory usage
- Light green: CPU/Memory requests
- Grey: CPU/Memory Limits
- Yellow: Scenarios in which CPU/Memory usage exceeds requests
You can also hover over each individual workload bar chart to reveal a small on-screen report of this data. Similar to the cluster view cost optimization tab, you can filter down to a custom time window; we recommend viewing this data in a window greater than an hour (IE a day, week, month) to potentially uncover diurnal or weekly patterns that would otherwise be obfuscated.
In the preceding screenshot of these charts, we can call out a few patterns that might stand out to you:
- If we have too much light green stacked above dark green in a bar, we may have workloads that are over provisioned.
- If we have a yellow bar, we have a workload where requests are not set high enough, which can be a stability/reliability risk – consuming additional resources on its node and potentially being throttled or OOMKilled if it hits its limits.
- If we have a bar that is all dark green, this means that we don’t have requests set for a workload – which is not best practice! Set those requests.
With this information, it becomes easier to quickly identify workloads that need requests and limits tuned for either cost optimization or stability and reliability.
# 4 – Recommendations for adjusting workload requests
In scenarios where we need to increase or reduce CPU/Memory requests, it is easier to know that it needs to be done than to know how it needs to be done. What should we set the requests to?
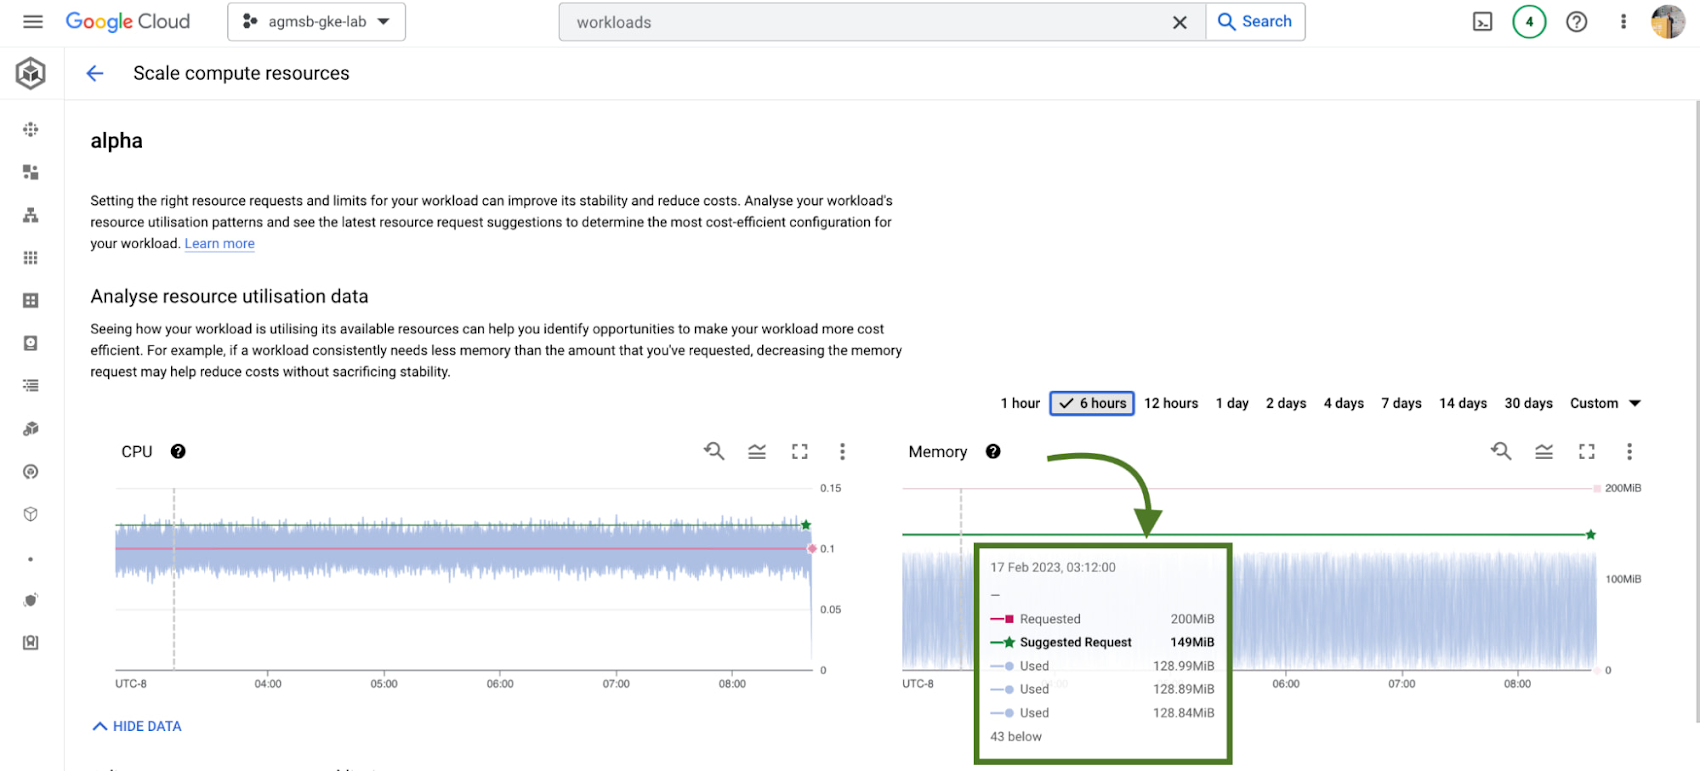
GKE integrates recommendations from the Kubernetes Vertical Pod Autoscaler (VPA) directly into its workload console, currently for all deployments in your clusters. You can find this by navigating to the Actions > Scale > Scale compute resources menu when viewing the page for a specific workload.
It’s important to remember that these recommendations are just that – recommendations. They’re based on historical usage data, so when viewing these values, it’s important to work with workload owners to see if these suggestions make sense to incorporate into their respective Kubernetes manifests.
# 5 – Cost estimation and cluster creation setup guides
Finally, if you’re just getting started with GKE and you want to get started on the right, optimized foot, we have tooling incorporated into the GKE cluster creation page.
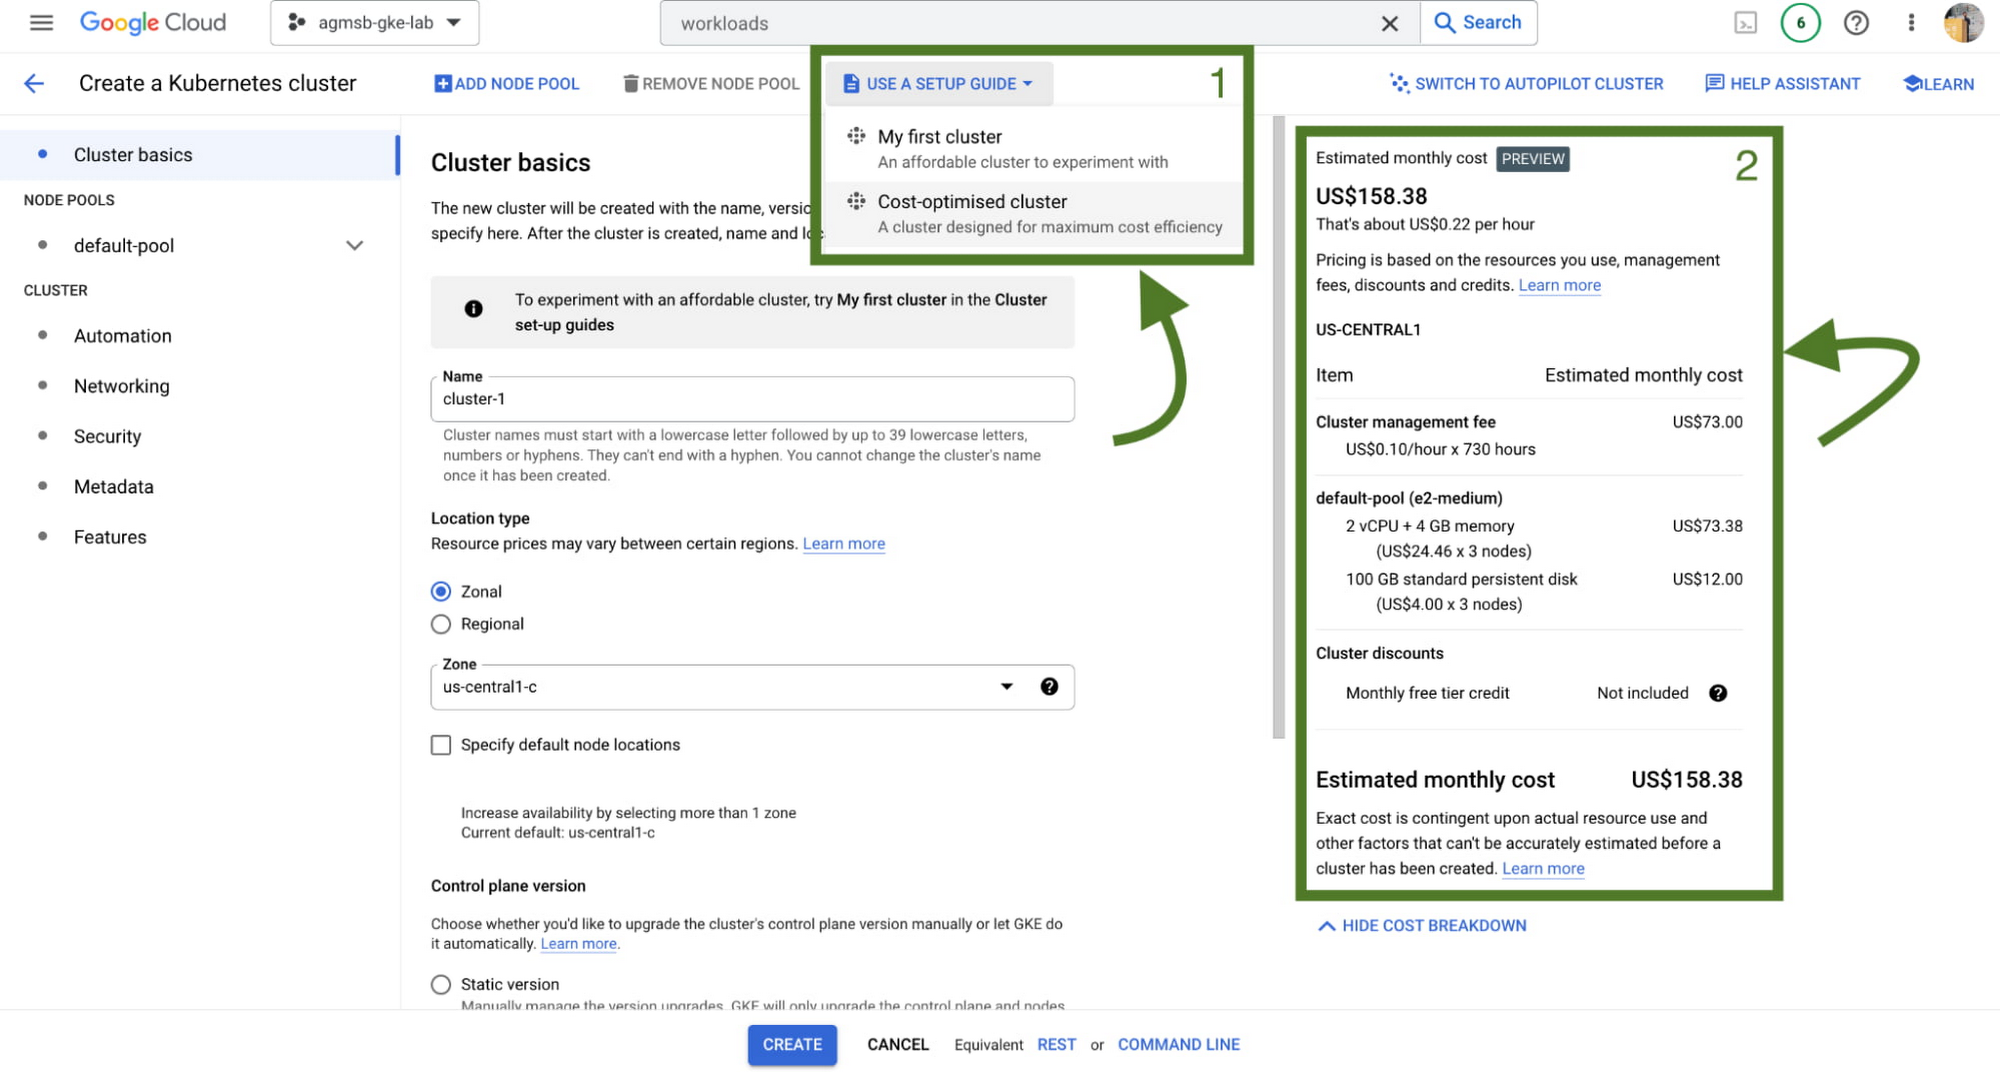
First, we have a setup guide that will help you create an opinionated GKE standard cluster with some things we discussed here already enabled, such as GKE cost allocation and Vertical Pod Autoscaler.
Second, we also have a cost estimation panel that, depending on the configuration of your GKE standard cluster, will show you an estimated monthly cost. This even helps you get a range of potential costs if you expect your cluster to scale up and down!
Now what?
Optimization across a set of GKE clusters can include a handful of areas to think about – and isn’t a one time task! Instead, it’s a continuous journey that cluster administrators, workload owners, and even billing managers all take part in. GKE provides the tooling to make this journey and process easier, with the right data and insights at your fingertips.
To familiarize yourself with these features in GKE, check out our interactive tutorials for getting started with standard and autopilot clusters.
You can also watch a demo showing most of these features in the following video:
A special thanks to Laurie White, Fernando Rubbo, and Bobby Allen for their review on this blog post.
Rubin Observatory Leverages Google Cloud to Power Astronomical Research

6058
Of your peers have already read this article.
2:00 Minutes
The most insightful time you'll spend today!
This week, the Vera C. Rubin Observatory is launching the first preview of its new Rubin Science Platform (RSP) for an initial cohort of astronomers. The observatory, which is located in Chile but managed by the U.S. National Science Foundation’s NOIRLab in Tucson, AZ and SLAC in California, is jointly funded by the NSF and the U.S. Department of Energy. The platform provides an easy-to-use interface to store and analyze the massive datasets of the Legacy Survey of Space and Time (LSST), which will survey a third of the sky each night for ten years, detecting billions of stars and galaxies, and millions of supernovae, variable stars, and small bodies in our Solar System.
The LSST datasets are unprecedented in size and complexity, and will be far too large for scientists to download to their personal computers for analysis. Instead, scientists will use the RSP to process, query, visualize, and analyze the LSST data archives through a mixture of web portal, notebook, and other virtual data analysis services. An initial launch with simulated data, called Data Preview 0, builds on the Rubin Observatory’s three-year partnership with Google to develop an Interim Data Facility (IDF) on Google Cloud to prototype hosting of the massive LSST dataset. This agreement marks the first time a cloud-based data facility has been used for an astronomy application of this magnitude.
Bringing the stars to the cloud
For Data Preview 0, the IDF leverages Cloud Storage, Google Kubernetes Engine (GKE), and Compute Engine to provide the Rubin Observatory user community access to simulated LSST data in an early version of the RSP. The simulated data were developed over several years by the LSST Dark Energy Science Collaboration to imitate five years of an LSST-like survey over 300 square degrees of the sky (about 1,500 times the area of the moon). The resulting images are very realistic: they have the same instrumental characteristics, such as pixel size and sensitivity to photons, that are expected from the Rubin Observatory’s LSST Camera, and they were processed with an early version of the LSST Science Pipelines that will eventually be used to process LSST data. “This will be the first time that these workloads have ever been hosted in a cloud environment. Researchers will have an opportunity to explore an early version of this platform,” says Ranpal Gill, senior manager and head of communications at the Rubin Observatory.
Broadening access for more researchers
Over 200 scientists and students with Rubin Observatory data rights were selected to participate in Data Preview 0 from a pool of applicants that represents a wide range of demographic criteria, regions, and experience level. Participants will be supported with resources such as tutorials, seminars, communication channels, and networking opportunities—and they will be free to pursue their own science at their own pace using the data in the RSP.
“The revolutionary nature of the future LSST dataset requires a commensurately innovative system for data access and analysis paired with robust support for scientists,” says Melissa Graham, lead community scientist for the Rubin Observatory and research scientist in the astronomy department at the University of Washington. “I’m personally excited to enhance my own skills by using the RSP’s tools for big data analysis, while also helping others to learn and to pursue their LSST-related science goals during Data Preview 0.”
At the same time, the fact that the RSP is hosted in the cloud provides researchers at smaller institutions access to state-of-the-art astronomy infrastructure that is comparable to that of the largest national research centers.
The launch benefits the observatory too: the development team can learn what researchers are interested in while also testing and debugging the platform. Graham says that “the platform is still in active development so researchers using it will be able to follow along in the progress, and provide feedback on ways that we can optimize the development of the tools.”
Next steps
The LSST aims to begin the ten-year survey in 2023-24 and expects it to include 500 petabytes of data. Through the cloud, Google aims to help make this extraordinary project scalable and accessible to researchers everywhere. To learn more about Data Preview 0, watch this video.
Want to ramp up your own research in the cloud? We offer research credits to academics using Google Cloud for qualifying projects in eligible countries. You can find our application form on Google Cloud’s website or contact our sales team.
Google Cloud Offering a Natural Migration Path for Developers Accustomed to Heroku

2782
Of your peers have already read this article.
1:30 Minutes
The most insightful time you'll spend today!
Modern developers worldwide have grown accustomed to the comfort of writing code, pushing to a remote Git repository and having that code be deployed at an accessible URL without having to worry about how it is deployed. This was a workflow popularized by Heroku years ago which brought joy and productivity to developers even if it did impose some loss of flexibility for operation teams.
To address that loss of flexibility when meeting security and integration requirements, Heroku introduced Private Spaces. Private Spaces provide network isolation from the internet since any application or datastore provisioned by Heroku is accessible to the internet by default.
Cloud Run is quickly becoming the “swiss army knife” of serverless here at Google Cloud and it’s a natural migration path for developers accustomed to Heroku. The fundamentals are all there:
- Continuously Deploy via Git push using open source Buildpacks or Dockerfiles
- Set CPU and Memory requirements for each instance
- Horizontally scalable apps that scale from zero to thousands of instances to meet traffic demands automatically
So while devs are kept happy, can Cloud Run do something for the Ops folks? Yes. Here are some things available right in the Cloud Run UI:
- Proper Secret Management with IAM based access control. No more setting secrets as environment variables.
- Traffic management between different revisions for blue-green or canary deployments.
- Define SLIs and SLOs with ease. Eg: 90% of requests have to be served under 200ms in a calendar month.
- Secure your service with tools such as Software Delivery Shield, Binary Authorization, and Cloud Armor. Definitely deserves its own blog post.
Recreating Private Spaces on Cloud Run
Let’s focus on network isolation now, let’s say you have an internet-facing app and a private backend API that talks to a private database. Simplest architecture ever, it conceptually looks a bit like this:
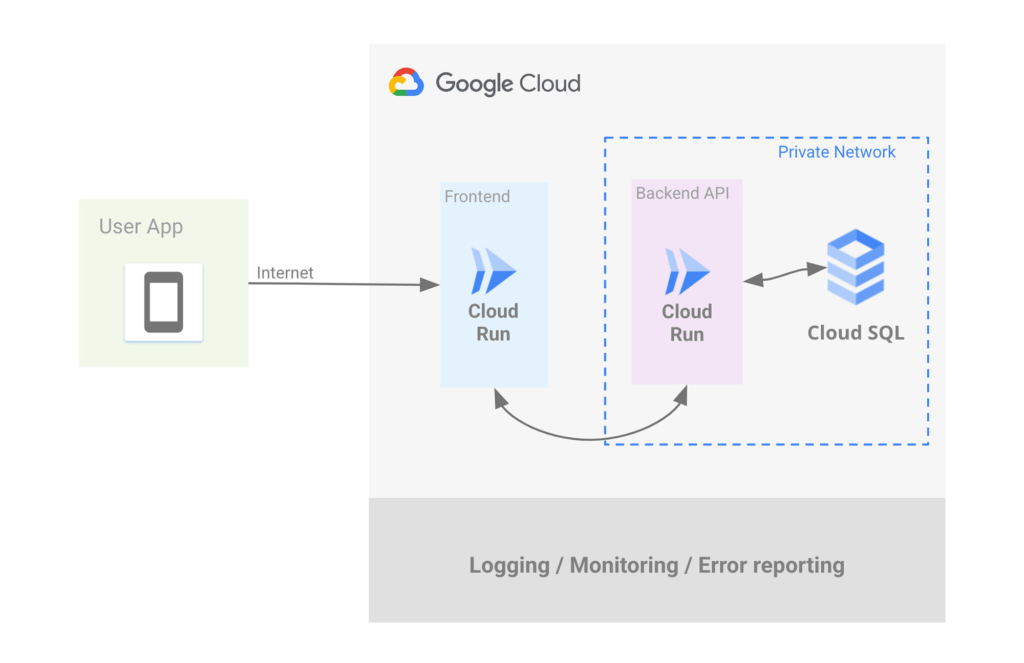
Let’s address the database first. If you want to use Postgres then Cloud SQL is most likely what you want, but do keep in mind that we have other datastores that speak Postgres such as AlloyDB and Spanner.
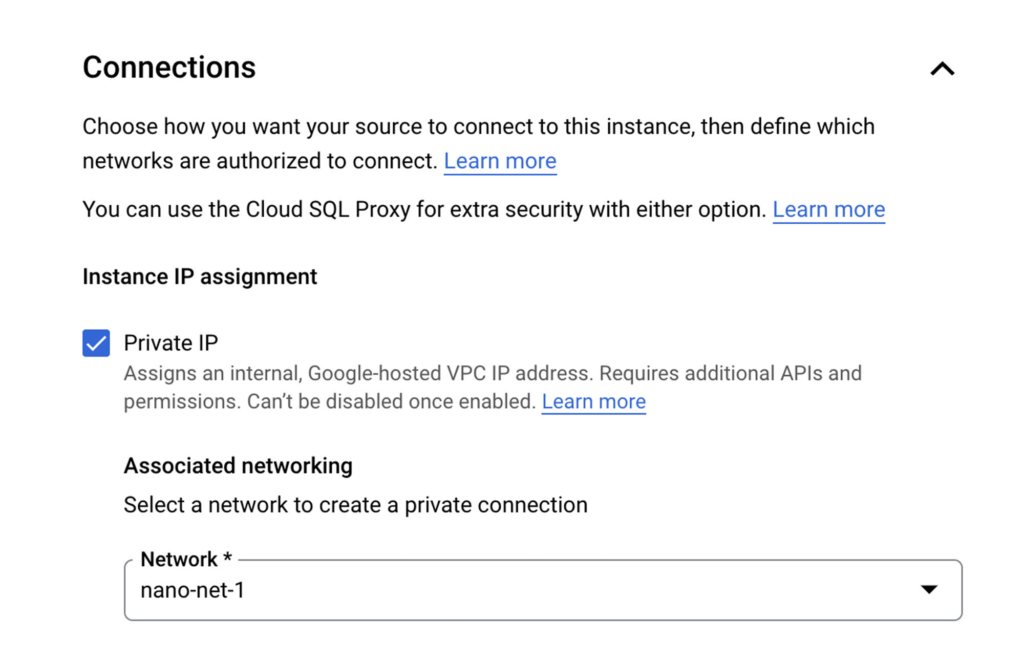
Cloud SQL allows you to create a Postgres instance that’s isolated from the internet by simply unchecking the Public IP checkbox and checking the Private IP checkbox. This will assign an IP address to your Postgres instance on your project’s network.
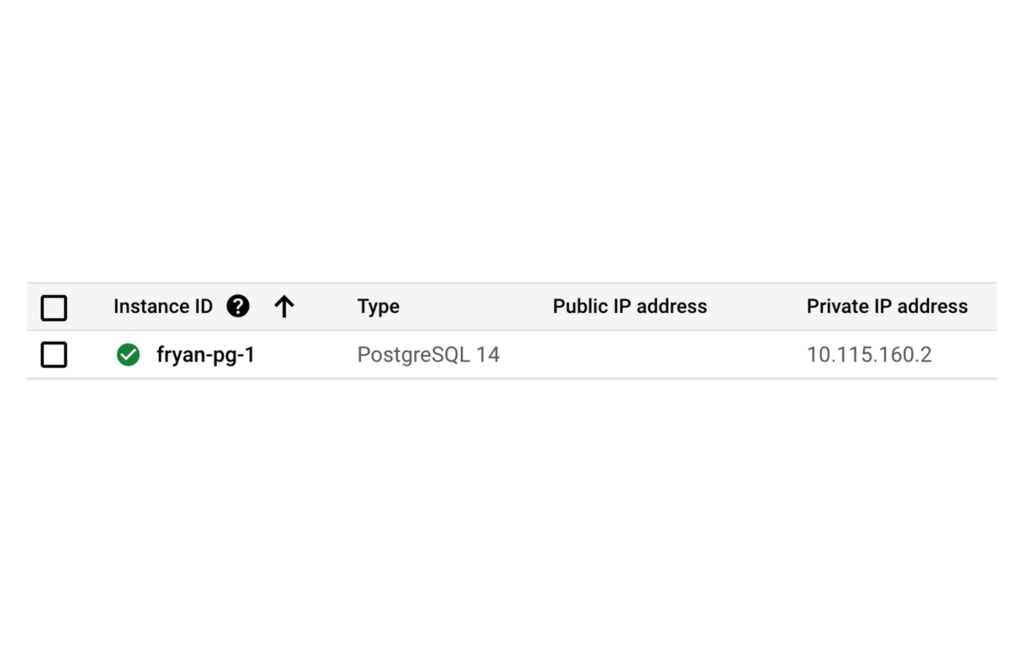
Once the DB is provisioned you’ll see the IP clearly listed, such as:
Of course there’s so much more to say about CloudSQL, to learn more please take a look at our documentation.
Ok now that you’ve dealt with Postgres, let’s address the private backend API on Cloud Run.
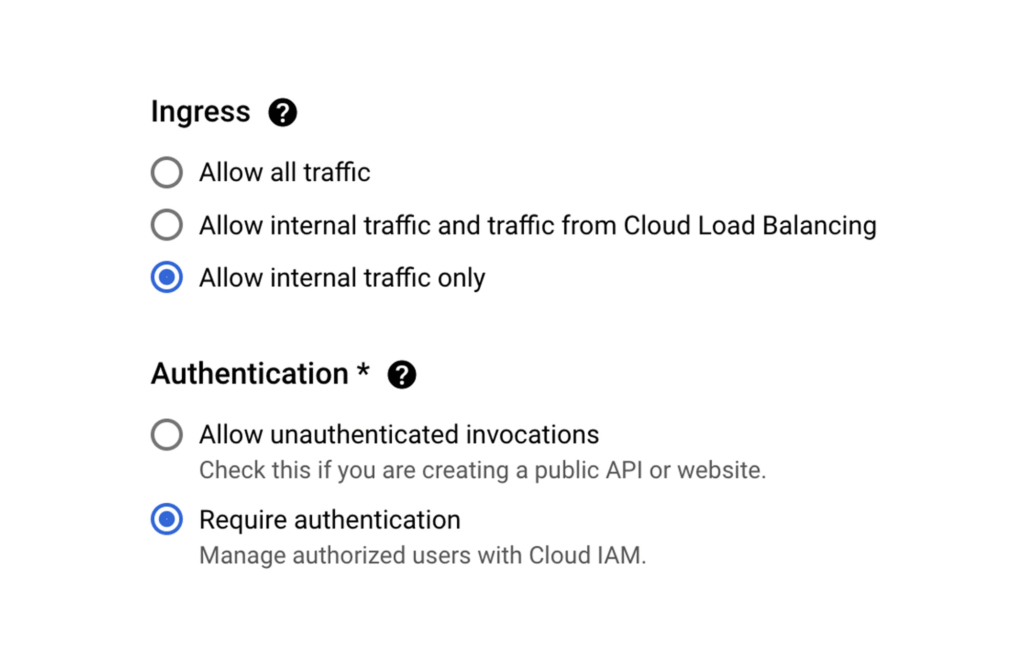
When creating a new Cloud Run service via the Google Cloud Console, Ingress can be limited to “Internal traffic only” so only traffic from internal sources, including your VPC, can access the service. In other words, the internet can not touch it.
As an additional level of security, it’s also possible to enforce that only requests from authorized users be served, In this case a “user” is most likely another service using its associated service account which will need the “roles/run.invoker” in order to call this service.
Now let’s make sure that our Backend API Service can reach the Postgres instance by configuring a VPC Connector. This will allow Cloud Run services to reach into the VPC and therefore, the internal IP for the Postgres instance.
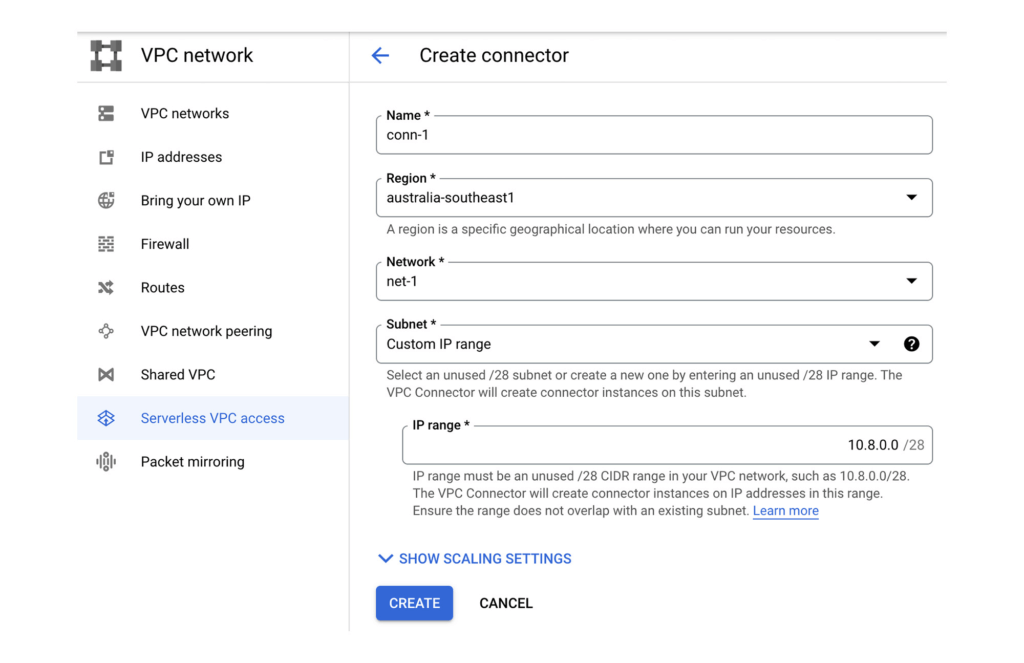
Once the VPC Connector is created, you can associate it with a Cloud Run service.
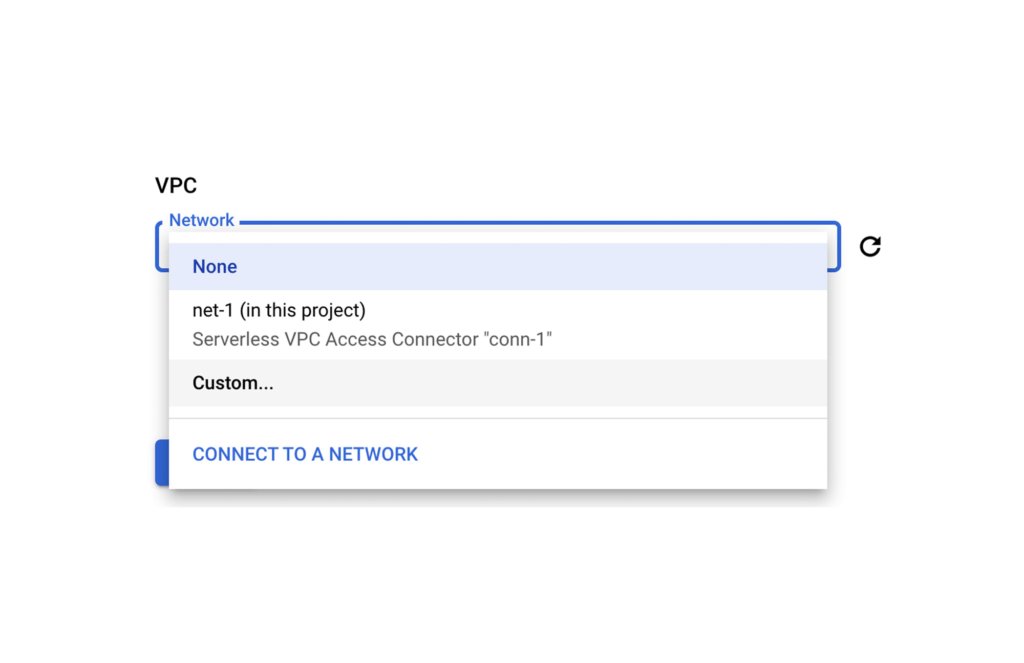
Then it’s just a matter of configuring your code to use the Postgres instance’s private IP address. A good 12-Factor app friendly spot to do that is with a connection string in an environment variable as part of the Cloud Run service configuration. Better yet, as this may contain a DB password, you can use Secret Manager to mount this environment variable from an encrypted and protected secret.
Finally, let’s now set up that Front End Cloud Run service which will respond to requests from the internet, and securely communicate with the backend API service.
For the frontend service choose to “Allow all traffic” and also “Allow unauthenticated invocations” so anyone on the web can access our URL. We could of course choose the middle option and use Cloud Load Balancing in conjunction with Cloud Armor which provides defenses against DDoS and application attacks, and offers a rich set of WAF rules. However, let’s keep it simple for now.
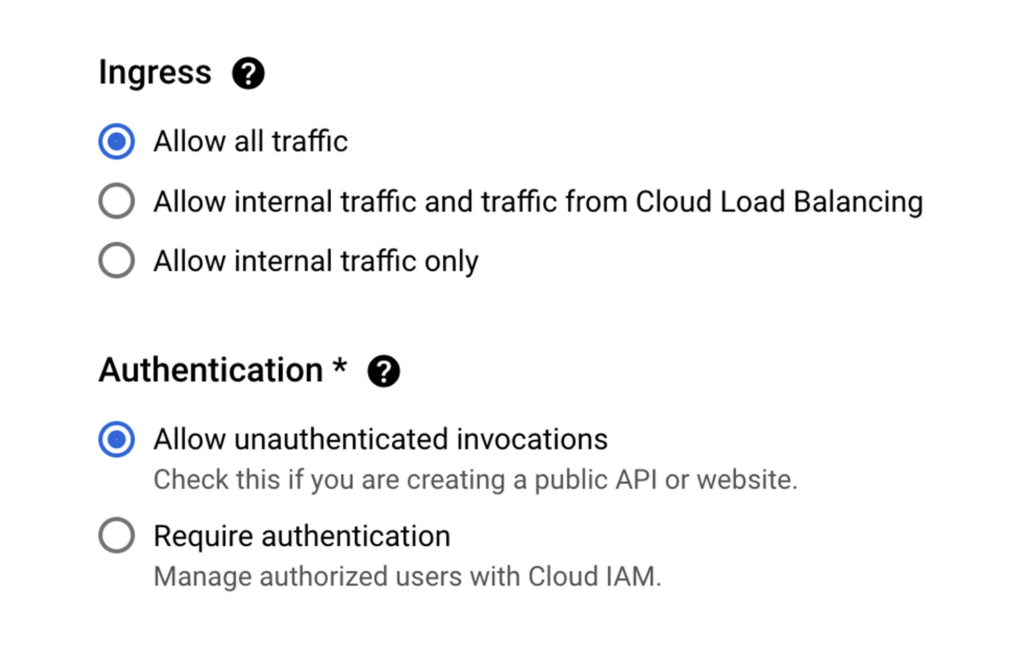
Keep in mind that our Backend service will only accept requests from within our VPC network, and that we don’t have a private IP address for Cloud Run.
So let’s ensure that all egresses from our Frontend actually get routed to the VPC Connector, this way when our Frontend calls a Backend API via it’s URL endpoint, the Backend will receive the request from within the VPC and allow it in.
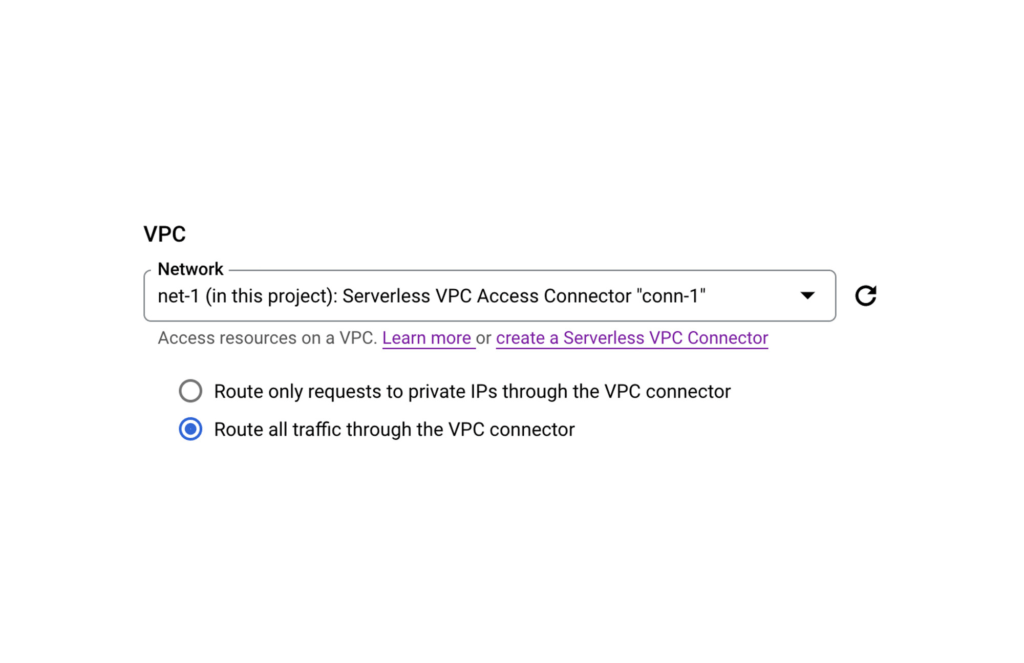
PS: If your Backend requires authentication don’t forget to create a Service Account for your Frontend Service and then give it the necessary role following a service-to-service auth pattern.
And that’s it. You now have an operationally acceptable private space like environment with an app composed of two Cloud Run services where the Backend service and Postgres instance are network isolated from the Internet. If after reading this blog you would like to get hands-on experience with the technologies mentioned above, then take a look at Google Cloud Skills Boost. There you will find learning paths, quests, and labs curated to boost your cloud skills in a particular area.
For example here’s a great lab that takes you through developing a REST API on Cloud Run using Go.

4052
Of your peers have already downloaded this article
4:30 Minutes
The most insightful time you'll spend today!
Customer and developer expectations are increasingly driving enterprise IT to employ new approaches to serving the needs of a diverse mix of users and experiences.
That’s where application programming interfaces (APIs) come into play. They are the foundation which digital business is built, allowing app developers to create apps that can serve the needs of a specific segment of users.
APIs are not new in many industries, but with the explosion of apps and experiences required in the digital world, and new customer-centric IT organizations, companies across industries need better solutions than ever to manage their APIs and API-driven businesses. API management enables you to create, manage, secure, analyze, and scale APIs.
An API management solution needs to include at least the following capabilities:
- Developer portal to attract and engage application developers, enabling them to discover, explore, purchase (or profit from), and test APIs and register to access and use the APIs
- API gateway to secure and mediate the traffic between clients and backends, and between a company’s APIs and the developers, customers, partners, and employees who use the APIs.
- API lifecycle management to manage the process of designing, developing, publishing, deploying, and versioning APIs.
More sophisticated API management provides additional capabilities including:
- An analytics engine that provides insights for business owners, operational administrators, and application developers enabling them to manage all aspects of a company’s APIs and API programs
- API monetization to enable API providers to package, price, and publish their APIs so that partners and developers can purchase access or take part in revenue sharing.
- It is typical for API management capabilities to be delivered in the cloud as a SaaS (Software as a Service) solution or on premises in a private cloud, or sometimes using a hybrid approach.
Download the full guide to understand how APIs can help your business become more user-centric.
A Run-through of an Innovative 2021 with Apigee

3390
Of your peers have already read this article.
1:30 Minutes
The most insightful time you'll spend today!
Apigee is committed to continually innovating new capabilities and solutions for our customers, and 2021 saw new product launches, partnerships, and best practices for managing your expanding range of business-critical use cases. Here are some of our favorite stories from 2021.
Spotting the trends in APIs
Our State of API Economy 2021 Report surveyed over 700 IT leaders globally and identified five key API trends that emerged post-COVID. SaaS and hybrid cloud-based API deployments are increasing with half of all respondents reporting increases in these areas, and AI- and ML-powered API management is also gaining traction, with usage growing 230% year-over-year among Apigee customers. Business metrics like Net Promoter Score (NPS) and speed-to-market are API users’ preferred way to measure success, and API ecosystems are increasingly innovation drivers, with high-maturity organizations much more likely to focus on building a developer ecosystem or B2B partner ecosystem around their API. Finally, API security and governance is more important than ever, as research showed that increased investment in security and governance was a high priority. Check out the blog to explore these five trends in more detail.
Launching new capabilities with Apigee X
We announced Apigee X, our next-generation platform that brings the powerful scale of Google technologies to Apigee API Management and allows enterprises to power API programs for enhanced scale, security, and automation. Apigee X customers can harness the capabilities of Cloud CDN to maximize the availability and performance of APIs across the globe, deploying across more than two dozen Google Cloud regions and enhancing caching at over 100 locations. Apigee X customers can apply solutions like Cloud Armor web application firewall for enhanced API security and Cloud Identity and Access Management (IAM) for authenticating and authorizing access to the Apigee platform. Apigee X also enhances automation by applying Google Cloud’s AI and ML capabilities to historical API metadata to detect anomalies, predict traffic, and ensure compliance. To read more about these features, check out our blogs on Apigee X and Cloud Armor, Apigee X and Cloud CDN, and Apigee X and AI.
Making new connections with Apigee Integration
Apigee brought our successful API-first approach to integration this year with the release of Apigee Integration. This silo-busting solution lets customers connect existing data and applications, and surface them as easily accessible APIs. Apigee Integration brings together the best of API management and integration into one unified platform so IT teams can scale their operations, improve developer productivity, and increase the speed to market. The platform comes with built-in connectors to Salesforce, Cloud SQL (MySQL, PostgreSQL), Cloud Pub/Sub and BigQuery, with connectors for additional third-party applications and databases on their way. Advanced integration patterns also serve our customers with even more use cases. Check out our launch blog and our Next session video for more details.
Managing GraphQL APIs with Apigee
The exponential rise in digital services adoption among enterprises now generates petabytes of data every minute. You can harness the power of this data with query languages like GraphQL, accessing the data your app needs with one single request. The growing popularity of GraphQL APIs and their business-critical use cases mean it’s important to manage them with full life cycle capabilities, much like you manage your REST APIs. Last year we compared REST and GraphQL and introduced best practices for managing GraphQL APIs. You can also read our blog announcing Apigee’s support for the management of GraphQL APIs, and our partnership with StepZen to deliver these capabilities. To dive deeper into building GraphQL APIs, check out our Next session video.
Looking back at the year’s top stories
2021 was the year of the customer, and we published the following stories to show how API management helps enterprises modernize their applications, build digital ecosystems, and generate value for their customers and their own organizations:
- Telco:
- Retail:
- Financial services:
- Energy:
That’s a wrap for 2021! We hope you have a safe and happy holiday season, and we can’t wait to see what the new year brings for us. Stay tuned in 2022 for product launch announcements, partnerships, tips, and stories of how organizations like yours are innovating with Apigee.
More Relevant Stories for Your Company

Partnering for a Healthier Tomorrow: Device Connect for Fitbit
Healthcare is at the beginning of a fundamental transformation to become more patient-centered and data-driven than ever before. We now have better access to healthcare, thanks to improved virtual care, while wearables and other tools have dramatically increased our ability to take control of our own health and wellness. Healthcare

Cardinal Health Leads the Way in Healthcare App Modernization
Apps play a critical role in an ever-expanding range of healthcare services, as patients and providers increasingly expect streamlined, engaging digital experiences. This means that IT must become faster, more agile, and free from the constraints of everyday infrastructure management. At Cardinal Health, we are continuously enhancing our technology to

Expert Takeaways on API Strategies from The State of API Economy 2021 Report
Did you know API traffic for Apigee customers increased 46% year-over-year, to 2.21 trillion calls, between 2019 and 2020? If you have more questions on APIs trends and their role in disrupting enterprises digitally, you can catch up on key take aways from the Google Cloud's State of API Economy

Driving Digital Success: Three ROI Criteria for Competitive Advantage
Choosing ROI criteria that drive smart decisions about digital investments is necessary to win in the app economy. But according to an Apigee Institute survey of IT and Marketing executives, there is a wide gap between what corporate leaders believe are the best ROI metrics and what are actually used in most
