





How PLAID’S Multi-cloud Approach with Anthos Clusters on AWS Drives Higher Business Growth

5445
Of your peers have already read this article.
3:00 Minutes
The most insightful time you'll spend today!
Editor’s note: Today’s post comes from Naohiko Takemura, Head of Engineering, and Kosukex Oya, Engineer, both from Japanese customer experience platform PLAID. The company runs its platform in a multicloud environment through Anthos clusters on AWS and shares more on its experiences and best practices.
At PLAID, our mission is to maximize the value of people through data, and we are developing a range of products that focus on improving customer experience. Our core product is a customer experience platform, KARTE, that can analyze the behavior and emotions of website visitors and application users, enabling businesses to deliver relevant communications in real time. We make KARTE available as a service to functions such as human resources and industries such as real estate and finance, and run the platform in a multicloud environment to achieve high-speed response and meet availability requirements. This is where Anthos comes in.
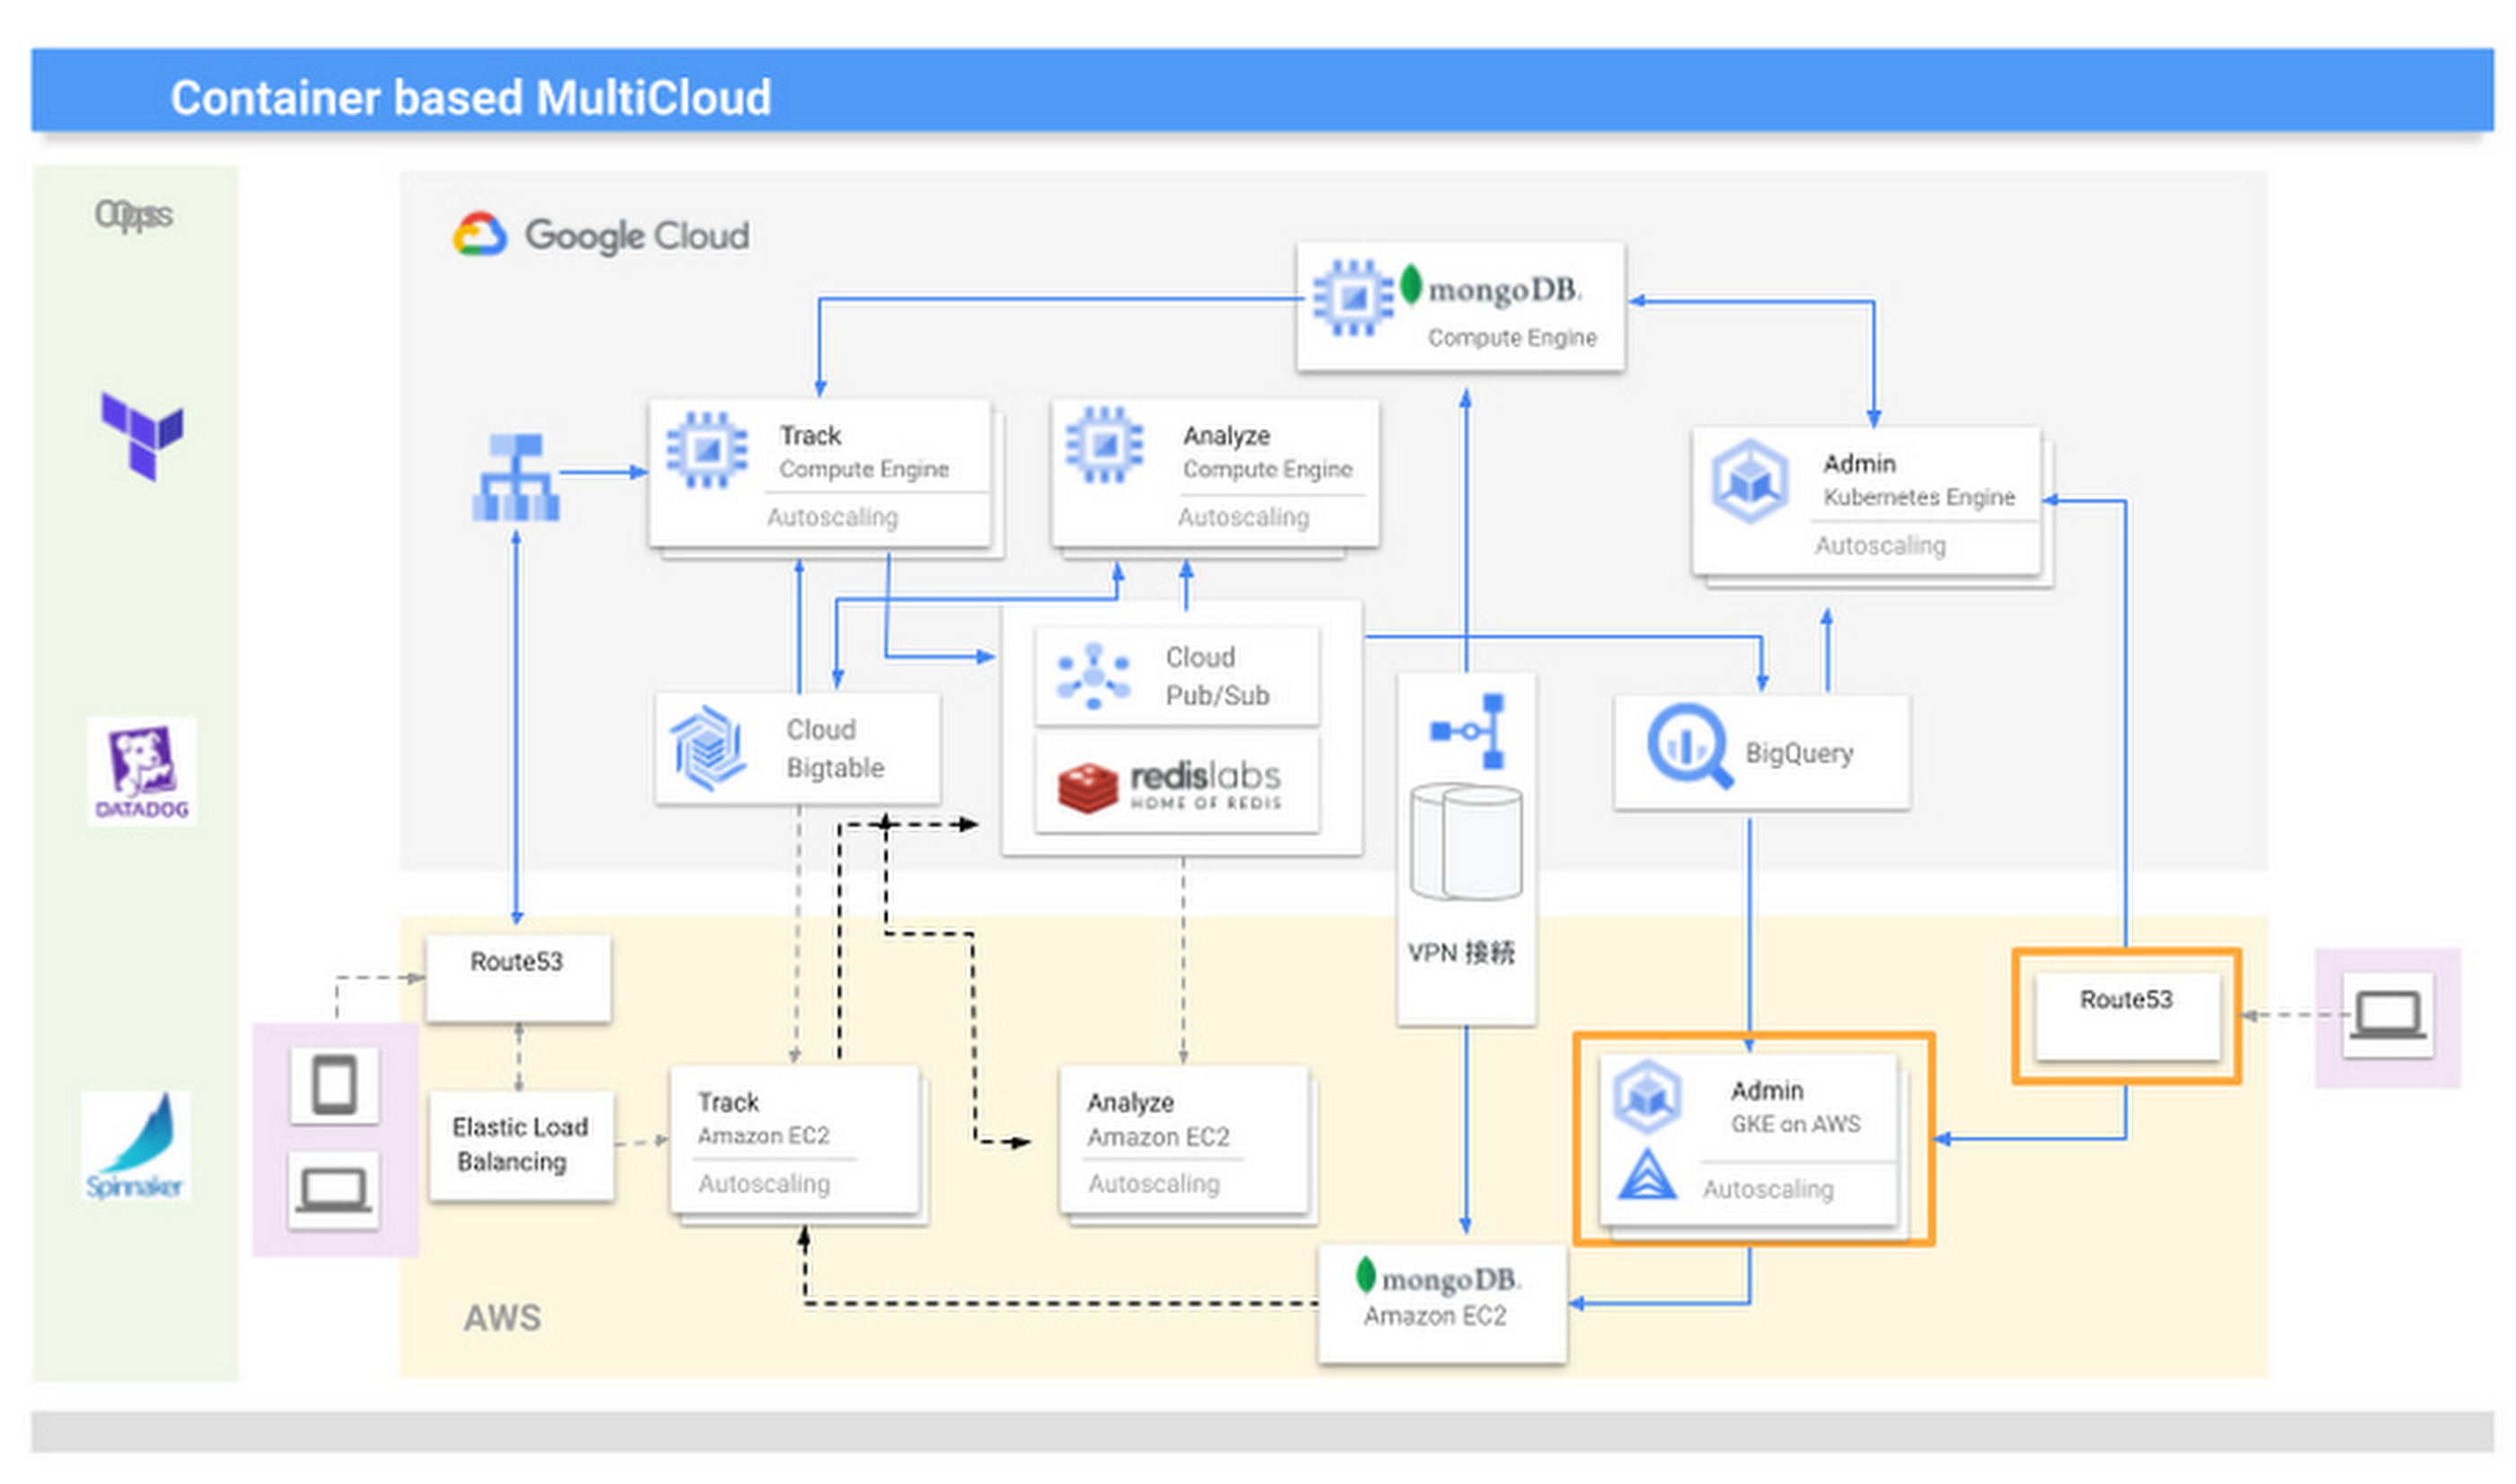
We introduced KARTE in 2015 and updated the system configuration in line with the addition of new functions and the need to increase scale. Our multicloud configuration is optimized through Anthos clusters on AWS, which give us access to the capabilities of Google Kubernetes Engine (GKE).
KARTE runs in two groups of server instances in each cloud; one group runs the management screens used by clients, and the other provides content for visitors to our website. In Google Cloud, the management system runs in GKE and content is delivered through Compute Engine.
We initially developed and operated the core of our services on another provider and from 2016 began to transition to Google Cloud due to its strong data processing capabilities. The products that handled big data, such as Cloud Bigtable and BigQuery, were attractive because they could handle data in real time and were compatible with KARTE. Now most functions, including peripheral aspects, run in Google Cloud, because we thought if we built a system centered on these products, it would become efficient to build other parts on Google Cloud.
While we considered migrating everything to Google Cloud, we decided to leverage its strengths alongside those of our existing provider, AWS. We felt a multicloud approach could create more opportunities and deliver higher growth than a mono-cloud environment.
We completed our move to a multicloud environment in 2017 and found that by building systems with almost the same content on two cloud services to leverage the strengths of each, we could reduce costs and improve performance and availability.
However, as KARTE grew, and the content of the service increased in complexity, we began to experience new problems. The increased load on the system due to an influx of in-house engineers from 2018 onwards impacted the scalability and development speeds of our conventional monolithic architecture running in virtual machines. We opted for an approach based on microservices and containerization, excluding the components that enabled real-time analysis as these had been modernized since initially being deployed in 2016, and the management screens, as the infrastructure running these did not require crisp tuning. Our key priority was to improve the ability of our engineers to deliver quickly.
From 2019, we turned to promoting microservices that make full use of container technology. When deciding to move from a target built on virtual machines to containerization, we evaluated the ease of use of GKE and decided to build in Google Cloud. At the same time, the number of systems with strict service level obligations was increasing, so to ensure higher availability, we considered running these in a multi cloud environment. The announcement of Anthos clusters on AWS at Google Cloud Next ‘19 in San Francisco provided an answer.
We had been wondering how to achieve the equivalent smooth operation of GKE in our AWS environment, and welcomed the Anthos clusters on AWS announcement. We consulted with a Google Cloud customer engineer through an early access program and quickly gained an opportunity to work with this version of Anthos. This allowed us to provide feedback and requests for improvement, and this paved the way for us to implement the product to take advantage of its functionality and future enhancements. With Google Cloud, we have been able to continue to interact closely with the development team to understand and provide input into the product roadmap.
We are now realizing the benefits of multicloud, including faster development speeds and higher availability. For businesses in general, we recommend they take a thoughtful approach to multicloud—while for us, multicloud is a useful mechanism that enables us to provide large-scale data analysis in real time, other businesses should consider whether multicloud is right for them and if so, the role of a technology like Anthos. They should also start small before ramping up. Moving forward, we are keen to see what other products Google Cloud is creating that can help drive our business to a higher level.
How PLAID’S Multi-cloud Approach with Anthos Clusters on AWS Drives Higher Business Growth
5446
Of your peers have already read this article.
3:00 Minutes
The most insightful time you'll spend today!
Editor’s note: Today’s post comes from Naohiko Takemura, Head of Engineering, and Kosukex Oya, Engineer, both from Japanese customer experience platform PLAID. The company runs its platform in a multicloud environment through Anthos clusters on AWS and shares more on its experiences and best practices.
At PLAID, our mission is to maximize the value of people through data, and we are developing a range of products that focus on improving customer experience. Our core product is a customer experience platform, KARTE, that can analyze the behavior and emotions of website visitors and application users, enabling businesses to deliver relevant communications in real time. We make KARTE available as a service to functions such as human resources and industries such as real estate and finance, and run the platform in a multicloud environment to achieve high-speed response and meet availability requirements. This is where Anthos comes in.
We introduced KARTE in 2015 and updated the system configuration in line with the addition of new functions and the need to increase scale. Our multicloud configuration is optimized through Anthos clusters on AWS, which give us access to the capabilities of Google Kubernetes Engine (GKE).
KARTE runs in two groups of server instances in each cloud; one group runs the management screens used by clients, and the other provides content for visitors to our website. In Google Cloud, the management system runs in GKE and content is delivered through Compute Engine.
We initially developed and operated the core of our services on another provider and from 2016 began to transition to Google Cloud due to its strong data processing capabilities. The products that handled big data, such as Cloud Bigtable and BigQuery, were attractive because they could handle data in real time and were compatible with KARTE. Now most functions, including peripheral aspects, run in Google Cloud, because we thought if we built a system centered on these products, it would become efficient to build other parts on Google Cloud.
While we considered migrating everything to Google Cloud, we decided to leverage its strengths alongside those of our existing provider, AWS. We felt a multicloud approach could create more opportunities and deliver higher growth than a mono-cloud environment.
We completed our move to a multicloud environment in 2017 and found that by building systems with almost the same content on two cloud services to leverage the strengths of each, we could reduce costs and improve performance and availability.
However, as KARTE grew, and the content of the service increased in complexity, we began to experience new problems. The increased load on the system due to an influx of in-house engineers from 2018 onwards impacted the scalability and development speeds of our conventional monolithic architecture running in virtual machines. We opted for an approach based on microservices and containerization, excluding the components that enabled real-time analysis as these had been modernized since initially being deployed in 2016, and the management screens, as the infrastructure running these did not require crisp tuning. Our key priority was to improve the ability of our engineers to deliver quickly.
From 2019, we turned to promoting microservices that make full use of container technology. When deciding to move from a target built on virtual machines to containerization, we evaluated the ease of use of GKE and decided to build in Google Cloud. At the same time, the number of systems with strict service level obligations was increasing, so to ensure higher availability, we considered running these in a multi cloud environment. The announcement of Anthos clusters on AWS at Google Cloud Next ‘19 in San Francisco provided an answer.
We had been wondering how to achieve the equivalent smooth operation of GKE in our AWS environment, and welcomed the Anthos clusters on AWS announcement. We consulted with a Google Cloud customer engineer through an early access program and quickly gained an opportunity to work with this version of Anthos. This allowed us to provide feedback and requests for improvement, and this paved the way for us to implement the product to take advantage of its functionality and future enhancements. With Google Cloud, we have been able to continue to interact closely with the development team to understand and provide input into the product roadmap.
We are now realizing the benefits of multicloud, including faster development speeds and higher availability. For businesses in general, we recommend they take a thoughtful approach to multicloud—while for us, multicloud is a useful mechanism that enables us to provide large-scale data analysis in real time, other businesses should consider whether multicloud is right for them and if so, the role of a technology like Anthos. They should also start small before ramping up. Moving forward, we are keen to see what other products Google Cloud is creating that can help drive our business to a higher level.
Gmail’s BIMI Increases Confidence about Security and Delivers Immersive Email Experiences

5465
Of your peers have already read this article.
3:00 Minutes
The most insightful time you'll spend today!
Creating a secure-by-default experience based on robust defenses has always been a core design principle for Gmail. That’s why we’ve established a strong baseline of security in Gmail, with built-in protections to help automatically filter out potentially malicious messages. While these defenses help keep Gmail users safe, email functions as part of a large, complex, interconnected ecosystem that we continually invest in and work to protect. After first announcing Gmail’s Brand Indicators for Message Identification (BIMI) pilot last year, today we’re announcing that over the coming weeks we’re rolling out Gmail’s general support of BIMI, an industry standard that aims to drive adoption of strong sender authentication for the entire email ecosystem. BIMI provides email recipients and email security systems increased confidence in the source of emails, and enables senders to provide their audience with a more immersive experience.


“Bank of America has a wide range of security measures in place to support our customers, and we constantly evolve our program to deliver best in class protection. Part of this effort is our partnership with Google on BIMI, which provides an easy way to validate if correspondence is from us.” — Bank of America
BIMI enables organizations that authenticate their emails using Domain-based Message Authentication, Reporting, and Conformance (DMARC)—a standard for providing strong sender authentication that allows security systems to perform better filtering, separating legitimate messages from potentially spoofed ones—to validate ownership of their logos and securely transmit them to Google. BIMI is designed to be easy: for organizations with DMARC in place, validated logos display on authenticated emails from their domains and subdomains.
Here’s how it works: Organizations who authenticate their emails using Sender Policy Framework (SPF) or Domain Keys Identified Mail (DKIM) and deploy DMARC can provide their validated trademarked logos to Google via a Verified Mark Certificate (VMC). BIMI leverages Mark Verifying Authorities, like Certification Authorities, to verify logo ownership and provide proof of verification in a VMC. Once these authenticated emails pass our other anti-abuse checks, Gmail will start displaying the logo in the existing avatar slot.
“Gmail’s support of BIMI is a win for email authentication, brand trust, and consumers alike. BIMI gives organizations the opportunity to provide their customers with a more immersive email experience, strengthening email sender authentication across the entire email ecosystem.” — Seth Blank, Chair of the AuthIndicators Working Group
This is just the start for BIMI. The standard expects to expand support across logo types and validators. For logo validation, BIMI is starting by supporting the validation of trademarked logos, since they are a common target of impersonation. Today, Entrust and DigiCert support BIMI as Certification Authorities, and in the future the BIMI working group expects this list of supporting validation authorities to expand further. To learn more about BIMI and see the latest news, visit the working group’s website.
To take advantage of BIMI, ensure that your organization has adopted DMARC, and that you have validated your logo with a VMC. For Gmail users, no action is required. We’re proud to be one of the leading members in both establishing and supporting the BIMI standard and will continue to support efforts that contribute to security for the entire email ecosystem.
Making Hybrid Work Human: Google Workspace and Economist Impact Survey

5478
Of your peers have already read this article.
2:30 Minutes
The most insightful time you'll spend today!
Google Workspace recently commissioned Economist Impact to complete a global survey (October 2021)* on the state of hybrid work, including its challenges and opportunities. We already knew that the pandemic had fundamentally changed the world of work, but the survey emphasizes the scale, reach, and longevity of those changes..
Over 75% of respondents believe that hybrid/flexible work will be a standard practice within their organizations in the coming three years. Given that 70% of respondents said they never worked remotely before the pandemic, it’s clear that hybrid has become the dominant model for work and that it’s here to stay.
But it’s also clear, as we’ll see below, that hybrid has some serious gaps that need to be addressed if it’s going to be sustainable and successful in the long term.
Defining hybrid work
As part of our work on the hybrid work survey and a broader project with The Economist Group, we interviewed a group of experts across research, consulting, business, and the advocacy world to arrive at a definition of hybrid work that captures all ways work is changing.
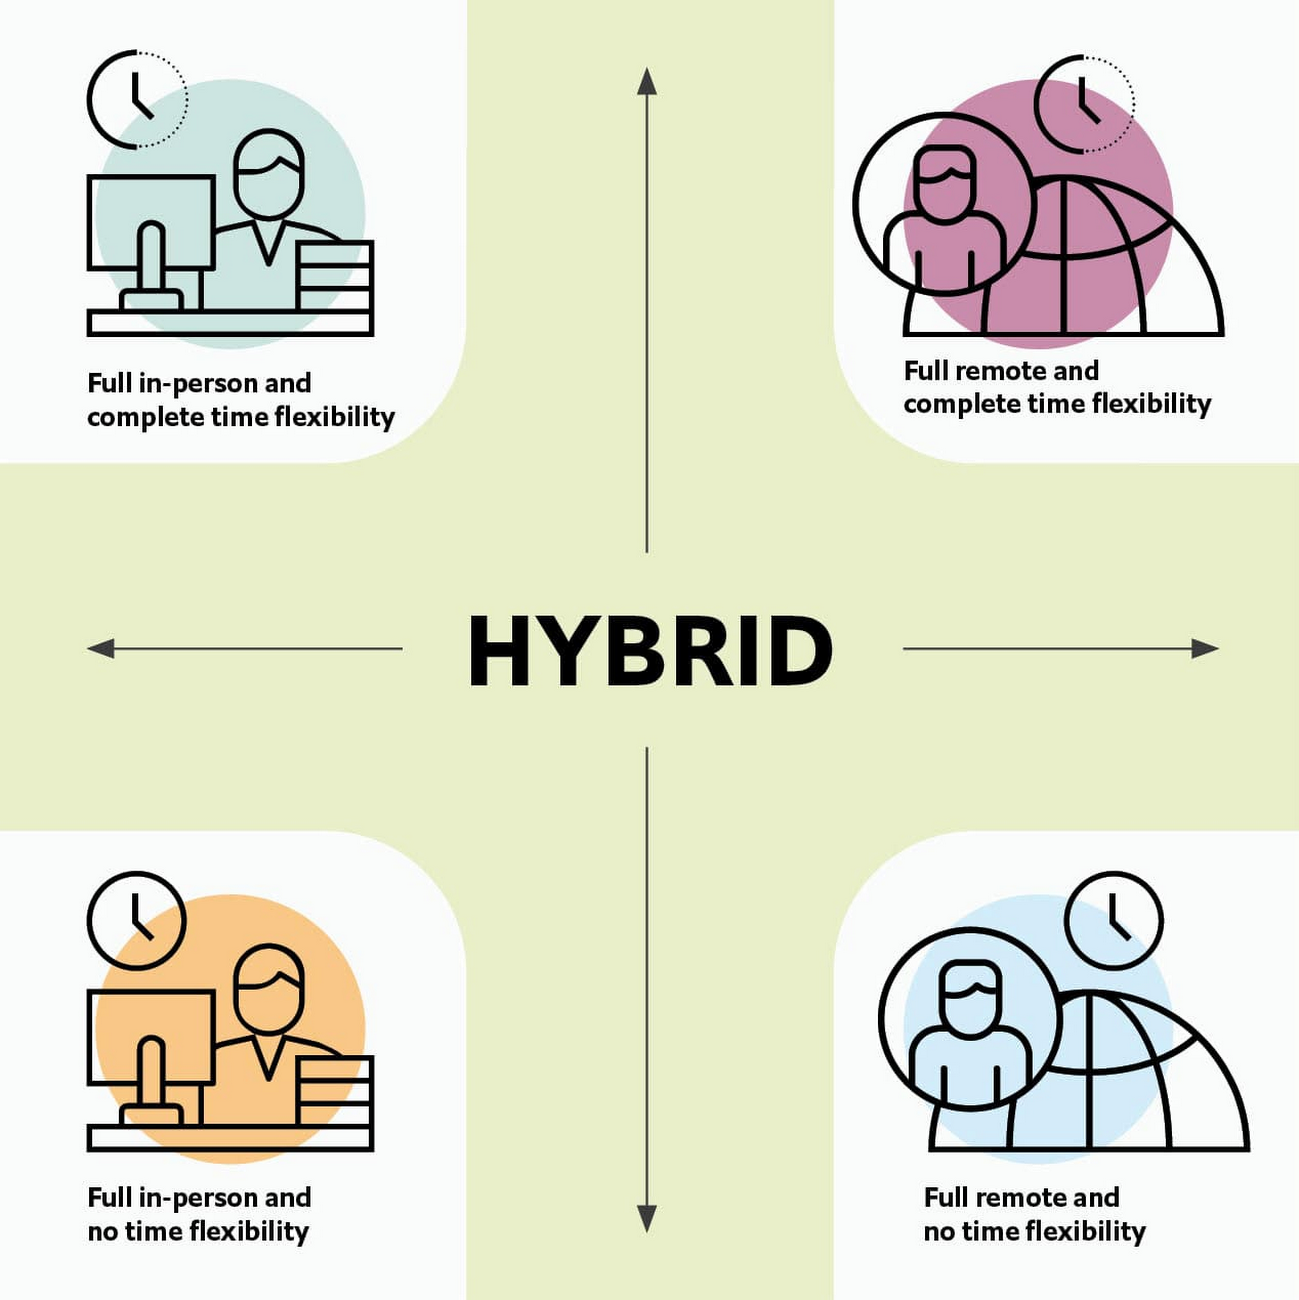
As Brian Kropp, one of the interviewees and vice president at Gartner, puts it: “Hybrid work is not just about different locations, but also different timings and different schedules.”
Harriet Molyneaux, managing director at HSM Advisory, a future-of-work research and advisory group, adds to this notion by describing the time-location work spectrum: “At one end of the spectrum is everyone in the office, nine till five, so both restricted time and location. And then at the other end of the spectrum is anywhere around the world at any time. So no restricted time or location. A hybrid is anything that sits in the middle of that.”
I agree with Brian and Harriet’s views. Flexibility in both location and hours is a core part of our working definition of hybrid work: a spectrum of flexible work arrangements in which an employee’s work location and/or hours are not strictly standardized.
Given this definition and framework, how is hybrid work faring and what lies ahead?
Individual wellbeing is coming at the cost of organizational connection
Early on in the pandemic, productivity remained steady or even increased for many organizations. But it came at a cost, with levels of burnout spiking as employees juggled caregiving, homeschooling, and other demands in their personal lives with work responsibilities.
Based on the survey data, wellbeing has made an upward shift, no doubt aided by things like students returning to schools in many regions and fewer demands being made of working parents. The majority of respondents said that hybrid work, based on their own experiences, can have a positive impact on the physical, mental, financial, and social wellbeing of employees.
But it appears that individual wellbeing is coming at the cost of organizational connection. The majority of respondents said they feel disconnected from their organization and co-workers (57%), that limited networking opportunities negatively impact career growth (62%), and that limited social interactions with co-workers has had a negative impact on their mental health (54%).
To be sustainable, hybrid work models must address this sense of disconnection in real and tangible ways. And it won’t happen just by increasing the number of virtual meetings. Although 72% of people say that virtual meetings improve inclusion and participation, 68% also say there are too many virtual meetings to begin with. We need new ways for people to connect spontaneously.
Hybrid workers are often using tools built for a bygone desktop era
When asked about the most important conditions needed to achieve the long-term success of hybrid work models, the number one choice globally was “new technologies that allow for time and location flexibility.”
Naturally, it was gratifying to see this, since Google Workspace is built on a cloud-based platform that empowers collaboration from anywhere, on any device, but the survey answer also highlights how much organizations have had to scramble to meet the demands of the pandemic. Some had to take legacy, office-centric systems and make them work for a distributed workforce overnight, often leveraging less-than-ideal technologies like VPNs that introduce digital friction.
As a result, top technology concerns of respondents include:
- unreliable internet access (if only all our WiFi connections were hybrid-ready!)
- reliance on slow or outdated tools
- accessing and maintaining files in multiple places
- relying on too many applications in order to get work done
Hybrid work, it seems to me, doesn’t need more applications and collaboration surfaces. It needs deeper, more meaningful connections in the tools and surfaces we already have.
As organizations assess their tech stacks, they should consider whether they can shape the behaviors they want from hybrid employees (e.g., real-time collaboration, ease of information sharing) with the tools they have in place. Or are the limits of the technology determining hybrid employee behavior?
The management and culture gap
In the same way that tools have often been built for a shared physical workspace, organizational culture seems to lag behind the hybrid moment. The majority of respondents said that a lack of face-to-face supervision creates a sense of distrust among managers and employees, and that they feel stressed by increased monitoring associated with flexible work. And more than 62% said that limited networking opportunities with senior employees and co-workers has a negative impact on career growth.
Strikingly, more than 70% of respondents indicated that the culture of trust between managers and employees needed improvement. Training and management best practices (60% of people want more of both) might help fill some of the gaps, but a manager can’t build trust with their hybrid teams by going through a training program.
The role of manager must itself evolve to meet the demands of a hybrid model. How can we empower managers to be the bridge between the “office of one” and the “office of many”? And as I discussed previously on Forbes, driving towards impact rather than output is a more sustainable metric for team engagement and productivity. It also dispenses with monitoring as a core part of a manager’s role, freeing them up to be a coach-and-connector.
How Google Workspace can help bridge the hybrid work gaps
No one has all the answers for how to make hybrid work successful, and I suspect we will see iterations of the model into 2022 and beyond as organizations—including Google—experiment with the right mix of location, culture, processes, and tools.
On the technology front, Google Workspace is uniquely positioned to bridge many of the emerging hybrid work gaps. Over the last year, we’ve delivered a set of innovations that are designed to deepen collaboration experiences while strengthening social connections within and across teams.
For example, we launched smart canvas to bring new collaboration capabilities to the places where people are already working together, helping to keep them connected, rather than having them switch tabs or open new apps. And we delivered Spaces as a central place for collaboration, where teams can share ideas, work on documents together, and manage tasks from a single place. Because all their work is preserved for future reference, team members can easily jump in and contribute at a time that works best for them, seeing a full history of the conversations, context, and content along the way. Spaces helps people maintain individual wellbeing while preserving the health of a group project.
In Google Meet, we’ve introduced real-time captions in multiple languages (in preview now), the ability for people to customize their video tiles, including being able to turn off their own to help with meeting fatigue, and we’ve implemented automatic light adjustments and noise cancellation. These changes help ensure that everyone can be seen and heard.
Meanwhile, features like hand-raise, Q&A, and polls have helped make meetings more inclusive and companion mode (in preview) can bring these to life in hybrid settings, to help ensure that there’s one cohesive conversation between the people in the office and their colleagues working somewhere else. We view companion mode as a bridge between the office and “somewhere else.”
On the personal wellbeing front, we launched Focus Time, which lets people block out their calendars for uninterrupted focus work, and Time Insights in Google Calendar, where employees can look at how they’re spending their time and adjust as needed.
As hybrid work continues to evolve, Google Workspace is committed to supporting wellbeing and seamless collaboration with tools that can remove digital friction and help people maintain connections—to each other and the organizations they work for.
*Survey details: The survey, completed in October 2021, polled a total of 1,244 employees and managers in four regions (North America, Europe, APAC, and Latin America), from more than 15 industries, in every age group, and from both small and large organizations. The focus was on knowledge workers, though it’s important to note that some of those people have been working on the frontlines; 20% of respondents indicated they haven’t worked remotely at all during the pandemic. This includes people in hospitality, retail, transportation and logistics, and healthcare.
4426
Of your peers have already watched this video.
1:32 Minutes
The most insightful time you'll spend today!
How the UK’s Football Association Turns to Tech to Ensure its 29 Teams Deliver World-Class Performance
The FA is an iconic British institution responsible for overseeing all aspects of football in the UK, from the grassroots club level across the country to the national teams who play at Wembley.
However, even icons like The FA must evolve to stay at the top of their game and they realized their old methods of pen and paper needed to change.
So The FA partnered with Google Cloud to transform itself into a digital leader. The first step was to implement G Suite to get all 29 professional national teams on the same page.
For all 350+ staff at St. George’s Park training facility and coaches throughout the country and on the road, G Suite provides an intuitive and easy way for all these entities to work together.
Coaches could communicate through Hangout; analysts could
compile and share data in Sheets; AI training plans could be distributed
and executed using Slides; and Drive helped support players on the
move, giving immediate access to important information, like dietary
requirements, training data, travel docs and more.
Watch the video to find out more.
How to Use Data to Tell Compelling Stories and Win New Deals

4505
Of your peers have already read this article.
2:30 Minutes
The most insightful time you'll spend today!
A picture is worth a thousand words–especially at work. The data we present every day is what helps us drive decision-making in the workplace. But understanding how to visualize a story can be difficult if you’re left staring at numbers sitting stagnant in rows or columns within a spreadsheet.
This is where visualization with charts and reports becomes critical. Let’s say your team needs to understand global sales trends. If you have a waterfall chart that shows regional contribution to total revenue or a scatter plot that shows individual salesperson performance, it’s much easier to spot patterns, draw insights, and make informed recommendations. The same goes for analyzing travel expenses.
In Google Sheets, we have several built-in tools that make it easy to create and share useful charts and reports so that you can quickly visualize data (without having to leave the spreadsheet). Follow these tips to showcase your data in Sheets and influence decisions.
1. Pick the most compelling way to visualize your data.
Perhaps just as important as the data you reference is the way in which you present it. Charts are the basic building blocks for data visualization and can take many forms–from bar charts to line graphs to scatter plots. There are more than 30 chart types to choose from in Sheets, and we’re constantly adding more ways to express your data. Here are a few we recommend:
- To draw attention to a key metric or KPI, try the brand new scorecard chart. For example, you can show the total sales number for your organization’s top-selling product, and even call out percentage increase or decrease over time.
- To illustrate how values add to or subtract from a starting value, try a waterfall chart. For example, show how your product sales and restocking efforts led to a net decrease in inventory from last quarter to this quarter.
- To represent different data series using lines and bars, try a combo chart. For example, you can show revenue in bars and profit margins in a line across the same chart, giving you a more complete picture of your organization’s financial health.
If you’re unsure how to best present your data, Google’s built-in machine learning can help you choose the right visualization—Sheets intelligently suggests charts for you. Simply highlight data you would like to visualize, click the chart button, and then select one of the suggested charts. According to our internal data, more than 1.5 million charts are inserted into Sheets each week based on intelligent recommendations.
Note: Once you have a chart inserted into Sheets, you may want to control the look and feel. We recently made it possible to click directly on data labels, chart titles, or legends and drag to reposition them. You can also easily delete these elements using the delete or backspace keys, if you want to make other data points stand out. We’re exploring even more ways to customize charts—stay tuned.
2. Be sure to tell a complete story.
Data really comes to life when you put several charts and tables together into a report or dashboard. Going back to our sales data example, an individual line graph showing revenue over time gives you quick insight into the general sales trend for your organization (hopefully, up and to the right!). But when you surround that line graph with other charts and tables–like a pie chart showing total revenue breakdown by-product, or a stacked bar chart comparing revenue driven by each sales team–you can tell a more complete story.
If you do build reports featuring multiple charts, there are ways that Sheets can help you organize and format them more quickly. Earlier this year, we made it easier to align, size, and position objects within your spreadsheets so you can quickly put several charts together. We also recently added themes, which let you alter the look and feel of an entire spreadsheet—including charts, pivot tables, and cells—to ensure a consistent look and feel across the elements in your report. To apply a preset theme, select Format > Theme and choose the right option. Faster formatting can mean faster reporting.
More Relevant Stories for Your Company

How EDI empowers its workforce in the field, in the office, and at home
For consulting companies such as EDI Environmental Dynamics Inc. (EDI), interactions among employees and customers are the direct drivers of value, and helping them collaborate has a tangible impact on the bottom line. However, connecting people from the field to work-from-home spaces to the office is no easy task. EDI, an environmental

How Cardinal Group Created a Collaborative Culture and Reduced Support Tickets by 43% Per IT Team Member
At Cardinal Group, we have four distinct lines of business, each of which are critical to our overall company performance: real estate investment, third-party property management, construction management, and marketing. As the VP of IT and Data, one of my top priorities is giving each of our team members across

Elevate Your SRE Practice: Streamlining Your SLO Design Process
Poll three Site Reliability Engineers with the question "What is SRE?" and you're likely to get five different answers: an implementation of DevOps, a role, a set of practices, a cultural shift, a snazzy title. While these definitions may not necessarily align with those in the SRE books, there is one

Nubian Skin Beats Spikes in Customer Interest with G Suite
“Nude” comes in all shapes, sizes and colors. But for Ade Hassan, finding undergarments to match her skin tone took more effort than necessary. Born in the U.K. to Nigerian parents, Hassan searched unsuccessfully for underwear and swimwear that matched her skin—a problem that continued to frustrate her through college
