





How Connected-Stories Uses BigQuery and AI/ML to Craft Personalized Ad Experiences

4003
Of your peers have already read this article.
4:00 Minutes
The most insightful time you'll spend today!
Editor’s note: The post is part of a series highlighting our awesome partners, and their solutions, that are Built with BigQuery
In the field of producing engaging video content such as ads, many marketers ignore the power of data to improve their creative efforts to meet the consumers’ need for personalized messages. The demand for creative tech to efficiently personalize is real as marketers need personalized video Ads to reach their audience with the right message at the right time. Data, Insights and Technology are the main ingredients to deliver this value while ensuring security and privacy requirements are met. The Connected-Stories team partnered with Google Cloud to build a platform for Ad personalization. Google Data Cloud and BigQuery are at the forefront to assimilate data, leverage ML models, create personalized ads, and capitalize on real-time intelligence as the core features of the Connected-Stories NEXT platform.
Connected-Stories NEXT is an end-to-end creative management platform to develop, serve, and optimize interactive video and display ads that scale across any channel. The platform ingests first-party data to create custom ML models, measure numerous third-party data points to help brands develop unique customer journeys and create videos that their data signals can drive. An intelligent feedback loop passes real-time data back, enabling brands to make data-driven and actionable video ads that take the brand’s campaigns to the next level.
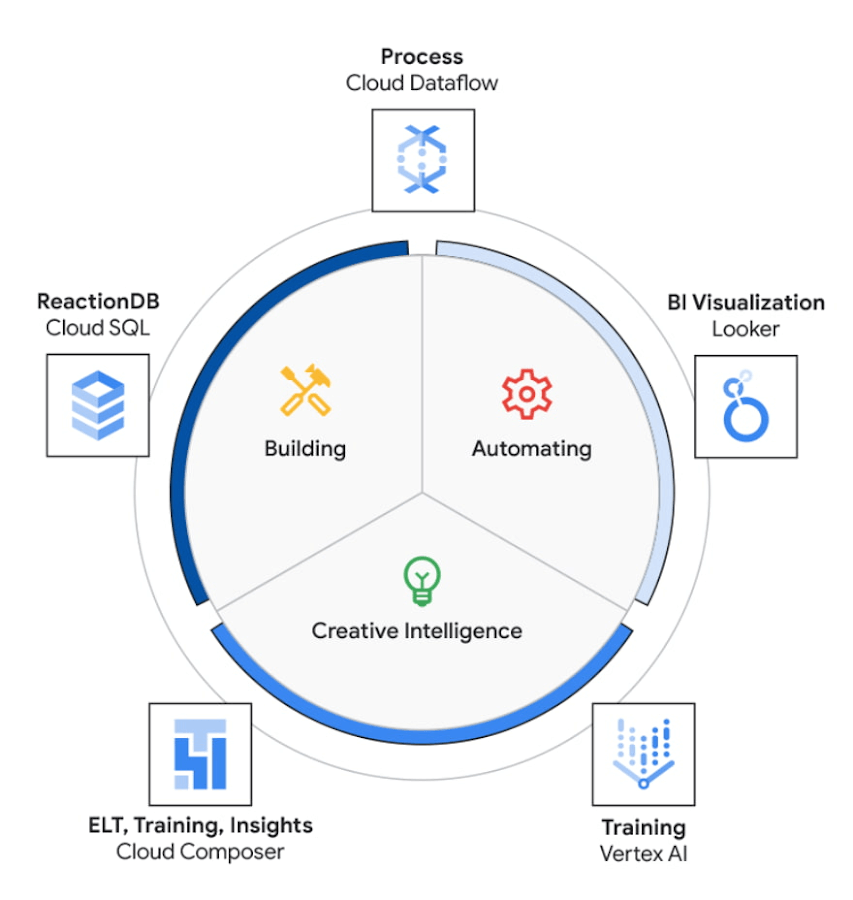
The core use case of the NEXT platform revolves around collecting user’s interaction data and optimizing for precision and speed to create an actionable Ad experience that is personalized for each user. The platform processes complex data points to create interactive data visualizations that allow for accurate analysis. The platform uses Vertex AI to access managed tools, workflows, and infrastructure to build, deploy, and scale ML models that have improved the accuracy to identify segments for further analysis.
The platform ingests 200M data events with peaks and valleys of activity. These events are processed to generate dashboards that enable users to visualize metrics based on filters in real-time. These dashboards have high performance requirements in terms of a responsive user interface under constantly changing data dimensions.
Google Cloud’s serverless stack coupled with limitless data cloud infrastructure has been the core to the NEXT platform’s data-driven innovation. The growing volume of data ingested, streamed and processed were scaled uniformly across the compute, storage and analytical layers of solution. A lean development team at Connected-Stories were able to focus all-in on the solution, while the serverless stack scaled, lowered attack service in terms of security and optimized the cost footprint through pay-as-you-go features.
BigQuery has been the backbone to support the vast amounts of data spreading over multiple geos resulting in workloads running at petabyte scale. BigQuery’s fully managed serverless architecture, real-time streaming, built-in machine learning and rich business intelligence capabilities distinguishes itself from a cloud data warehouse. It is the foundation needed to approach data and serve users in an unlimited number of ways. For an application with zero tolerance for failure, given its fully managed nature, BigQuery handles replication, recovery, data distributed optimization and management.
The platform’s requirements include the need for low maintenance, constantly ingesting and refreshing data and smart-tuning of aggregated data. These capabilities can be implemented by BigQuery’s materialized views feature. Materialized views are useful for precomputed views that regularly cache query results for better performance. These views possess the innate feature to read only the delta change from base tables and calculate the up-to-date aggregations. Materialized views impart faster outputs and consume fewer resources while reducing the cost footprint.
Some key considerations in using Google cloud and focusing on the Serverless stack include: quick onboarding to development, prototyping in short sprints and ease of preparing data in a rapidly changing environment. Typical considerations around low code / no code include data transformation, aggregation and reduced deployment time. These considerations are fulfilled through using serverless capabilities within Google Cloud such as PubSub, Cloud Storage, Cloud Run, Cloud Composer, Dataflow and BigQuery as described in the Architecture diagram below. The use of each of these components and services are described below.
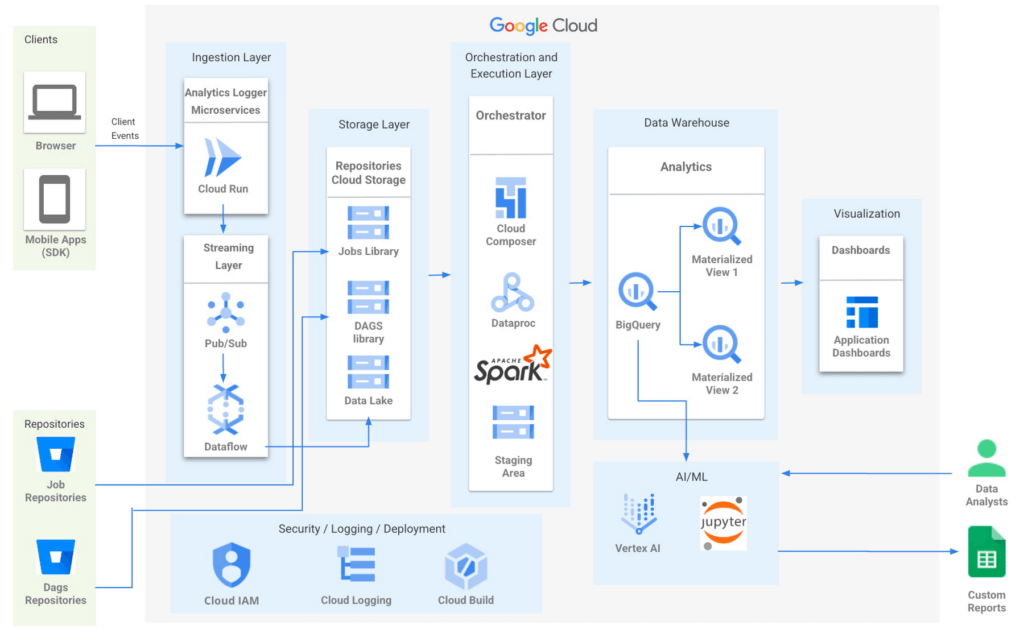
- Input/Ingest: At a high-level, microservices hosted in Cloud Run collect and aggregate incoming Ads events.
- Enrichment: The output of this stage is a Pub-Sub message enriched with more attributes based on a pre-configured campaign.
- Store: a Cloud Dataflow streaming job to create text files in Cloud Storage buckets.
- Trigger: Cloud Composer triggers the spark jobs based on text files to process and group them to produce desired output as one record per impression, a logical group of events.
- Deploy: Cloud Build is then used to automate all deployments.
Thus far, all Google cloud managed services work together to ingest, store and trigger the orchestration, all of which are scalable based on configurations including autoscaling capabilities.
- Visualization: A visualization tool reads data from BigQuery to compute pre-aggregations required for each dashboard.
- Data Model Evolution considerations: Though the solution served the purpose of creating pre-aggregations, as the data model evolved by adding a column or creating a new table, it led to recreating pre-aggregations and querying the data again. Alternatively, creating aggregate tables as an extra output of current ETLs seemed like a viable option. However, this would increase the cost and complexity of jobs. A similar situation to reprocess or update aggregated tables would occur as data is updated.
Precomputed views of data that is periodically cached are critical to reach the audience with the right message at the right time.
- Performance: In order to increase the performance of the platform, we need to have regularly precomputed views of the data, cached .
- Materialized Views: Consumers of these views needed faster response times, to consume fewer resources and output only the changes in comparison to a base table. BigQuery Materialized views were used to solve this very requirement. Materialized views have been highly leveraged to optimize the design resulting in lesser maintenance and access to fresh data with high performance with a relatively low technical investment in creating and maintaining SQL code.
- Dashboards: Application dashboards pointing to the Materialized views are highly performant and provide a view into fresh data.
- Custom Reports with Vertex AI Notebooks: Vertex AI notebooks directly read data from BigQuery to produce custom reports for a subset of customers. Vertex AI has been hugely beneficial to data analysts, where an environment with pre-installed libraries simplifies the readiness to use. Vertex AI Workbench notebooks are used to share these reports within the team allowing them to work always on the cloud without having the need to download data at any time. Besides, it increases the velocity to develop and test ML models faster.
The NEXT platform has yielded benefits such as customers having the ability to create unique consumer journeys powered by AI / ML personalization triggers, using first-party data and business intelligence tools to capitalize on real-time creative intelligence, which is a dashboard to measure campaign performance for cross-functional teams to analyze the impact of Ad content experience at a granular level. All of these while ensuring controlled access to data to enrich data without moving across clouds. The NEXT platform can keep up with increased demands for agility, scalability and reliability through the underlying usage of Google Cloud.
Partnering with Google, in the context of the Google Built with BigQuery program has surfaced the differentiated value in areas of creating interactive personalized Ads by using real-time data. In addition, by sharing this data across organizations as assets, ML models have fueled higher levels of innovation. Connected-Stories plan to deepen the penetration into the entire spectrum of services offered in the AI/ML area to enhance core functionality and provide newer capabilities to the platform.
Click here to learn more about Connected-Stories NEXT Platform capabilities.
The Built with BigQuery Advantage for ISVs
Through Built with BigQuery, launched in April ‘22 as part of Google Data Cloud Summit, Google is helping tech companies like Connected-Stories co-innovate in building applications that leverage Google’s data cloud with simplified access to technology, helpful and dedicated engineering support, and joint go-to-market programs. Participating companies can:
- Get started fast with a Google-funded, pre-configured sandbox.
- Accelerate product design and architecture through access to designated technical experts from the ISV Center of Excellence who can share insights from key use cases, architectural patterns, and best practices encountered in the field.
- Amplify success with joint marketing programs to drive awareness, generate demand, and increase adoption.
The Google Data Cloud spectrum of products and specifically BigQuery give ISVs the advantage of a powerful, highly scalable data warehouse that’s integrated with Google Cloud’s open, secure, sustainable platform. And with a huge and expanding partner ecosystem and support for multi-cloud, open source tools and APIs, Google provides technology companies the portability and extensibility they need to avoid data lock-in and exercise choice.
We thank the Google Cloud and Connected-Stories team members who co-authored the blog: Connected-Stories: Luna Catini, Marketing Director, Google: Sujit Khasnis, Cloud Partner Engineering
Speed Up Data-driven Innovation in Life Sciences with Google Cloud

4281
Of your peers have already read this article.
1:30 Minutes
The most insightful time you'll spend today!
The last few years have underscored the importance of speed in bringing new drugs and medical devices to market, while ensuring safety and efficacy. Over this time, healthcare and life sciences organizations have transformed the way they research, develop, and deliver patient care by embracing agility and innovation.
Now, the industry is set to reap the benefits of cloud technology and overcome the existing barriers to innovation.
What’s holding back innovation?
Costly clinical trials: The process of trialing and developing new drugs and devices is still long and costly, with more than 1 in 5 clinical trials failing due to a lack of funding.1 The high failure rate comes as no surprise when you consider the average clinical trial costs $19 million and takes 10-15 years (through all 3 phases) to be approved.2
Stringent security requirements: Pre-clinical R&D and clinical trials use large volumes of highly sensitive patient data – making the life sciences industry one of the top sectors targeted by hackers.3 On top of this, the FDA and other regulatory bodies have strict requirements for medical device cybersecurity.
Unpredictable supply chains: Global supply chains are becoming increasingly complex and unpredictable. This can be brought on by anything from supply shortages, to geo-political events, and even bad weather. Making things worse is the lack of visibility into medical shipment disruptions – so when disaster strikes you’re often caught off guard.
Google Cloud for life sciences
At Alphabet, we’ve made significant investments in healthcare and life sciences, helping to tackle the world’s biggest healthcare problems, from chronic disease management, to precision medicine, to protein folding.
Together with Google, you can transform your life sciences organization and deliver secure, data-driven innovation across the value chain.
- Accelerate clinical trials to deliver life-saving treatments faster and at less cost. Clinical trials require relevant and equitable patient cohorts that can produce clinically valid data. Solutions like DocAI can enable optimal patient matching for clinical trials, helping organizations optimize clinical trial selection and increase time to value. How that patient data is collected is also important. Collection in a physician’s office captures a snapshot of the participant’s data at one point in time and doesn’t necessarily account for daily lifestyle variables. Fitbit, used in more than 1,500 published studies–more than any other wearable device–can enrich clinical trial endpoints with new insights from longitudinal lifestyle data, which can help improve patient retention and compliance with study protocols. We have introduced Device Connect for Fitbit, which empowers healthcare and life sciences enterprises with accelerated analytics and insights to help people live healthier lives. We are able to empower organizations to improve clinical trials in key ways:
- Enable clinical trial managers to quickly create and launch mobile and web RWE collection mechanism for patient reported outcomes
- Enable privacy controls with Cloud Healthcare Consent API and, as needed, remove PHI using Cloud Healthcare De-identification API
- Ingest RWE and data into BigQuery for analysis
- Leverage Looker to enable quick visualization and powerful analysis of a study’s progress and results
- Ensure security and privacy for a safe, coordinated, and compliant approach to digital transformation. Google Cloud offers customers a comprehensive set of services including pioneering capabilities such as BeyondCorp Enterprise for Zero Trust and VirusTotal for malicious content and software vulnerabilities; Chronicle’s security analytics and automation coupled with services such as Security Command Center to help organizations detect and protect themselves from cyber threats; as well as expertise from Google Cloud’s Cybersecurity Action Team. Google Cloud also recently acquired Mandiant, a leader in dynamic cyber defense, threat intelligence and incident response services.
- Optimize supply chains and enhance your data to prepare for the unpredictable. With a digital supply chain platform, we can empower supply chain professionals to solve problems in real time including visibility and advanced analytics, alert-based event management, collaboration between teams and partners, and AI-driven optimization and simulation.
Ready to learn more? We’ll be taking a deep dive into each of the challenges outlined above in our life sciences video series. Stay tuned.
- National Library of Medicine
- How much does a clinical trial cost?
- Life Sciences Industry Becomes Latest Arena in Hackers’ Digital Warfare
BigQuery Reference Guide: Understanding Tables within and Routine for Data Transformation

3681
Of your peers have already read this article.
3:00 Minutes
The most insightful time you'll spend today!
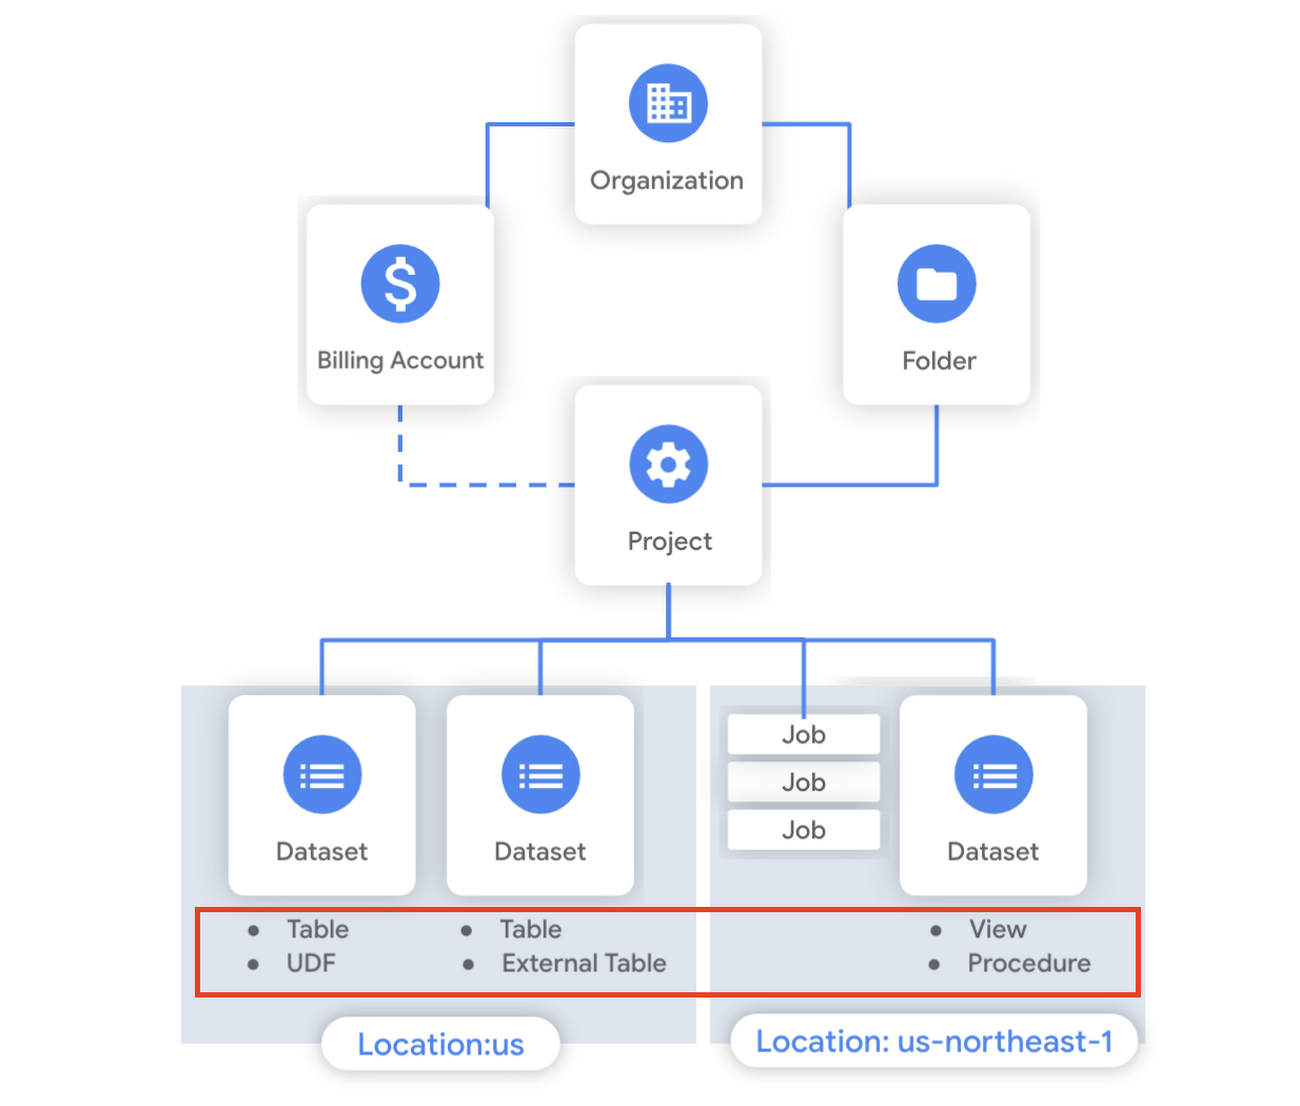
Last week in our BigQuery Reference Guide series, we spoke about the BigQuery resource hierarchy – specifically digging into project and dataset structures. This week, we’re going one level deeper and talking through some of the resources within datasets. In this post, we’ll talk through the different types of tables available inside of BigQuery, and how to leverage routines for data transformation. Like last time, we’ll link out to the documentation so you can learn more about using these resources in practice.
What is a table?
A BigQuery table is a resource that lives inside a dataset. It contains individual records organized into rows, with each record composed of columns (also called fields) where a specified data type is enforced. BigQuery supports numerous different data types including GEOGRAPHY for geospatial data, STRUCT and ARRAY for more complex data, and new parameterized data types to add specific constraints like the number of characters in a string.
Data access can also be controlled at the table, row and column levels; more details on data governance will be covered later in the series. Metadata, such as descriptions and labels, can be used for surfacing information to end users and as tags for monitoring. You can create and manage a table directly in the UI, through the API / Client SDKs or in a SQL query using a DDL statement.
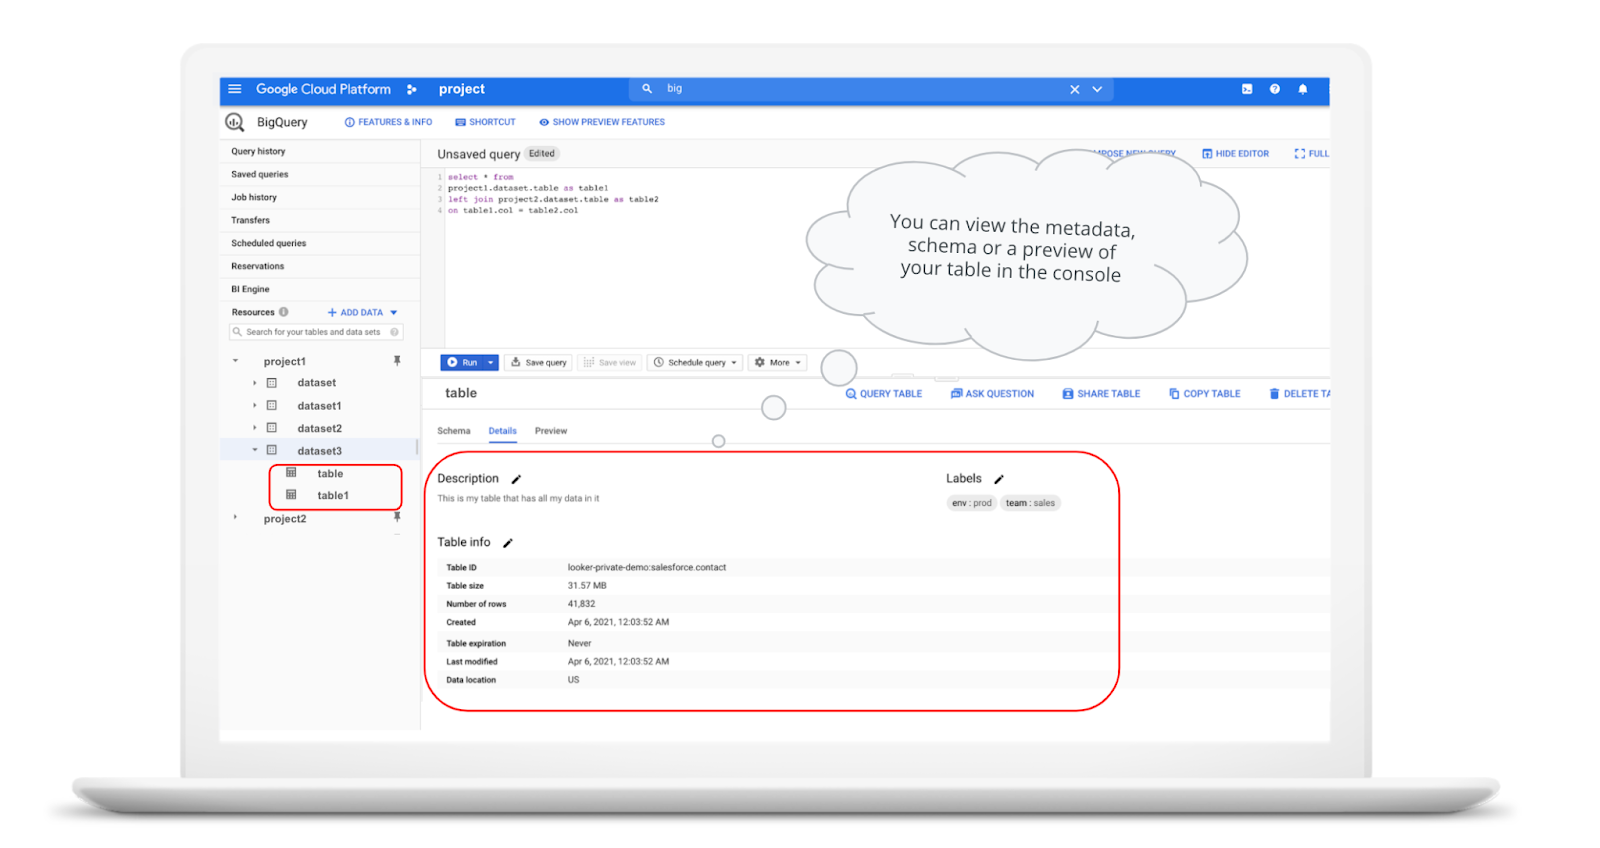
bq show \--schema \--format=prettyjson \project1:dataset3.table
Managed and external tables
Managed tables are tables that are backed by native BigQuery storage, which has many benefits that improve query performance including support for partitions and clusters. We’ll cover more details on BigQuery storage later in this series. Another advantage of using a managed table is that BigQuery allows you to use time travel to access data from any point within the last seven days and query data that was updated, expired or deleted. And now you can even create a snapshot of your table, to preserve its contents at a given time.
# create a snapshot of transactions in the library_backup dataset as of one hour agoCREATE SNAPSHOT TABLElibrary_backup.salesCLONE retail.transactionsFOR SYSTEM_TIME AS OF TIMESTAMP_SUB(CURRENT_TIMESTAMP(), INTERVAL 1 HOUR);
While managed tables store data inside BigQuery storage, external tables are backed by storage external to BigQuery. BigQuery currently supports creating an external table from Cloud Storage, Cloud Bigtable and Google Drive. Besides an external table, you can create a connection to Cloud SQL, which is somewhat analogous to an external dataset. Here, you can leverage federated queries to send a query that executes in Cloud SQL but returns the results to be used within BigQuery.
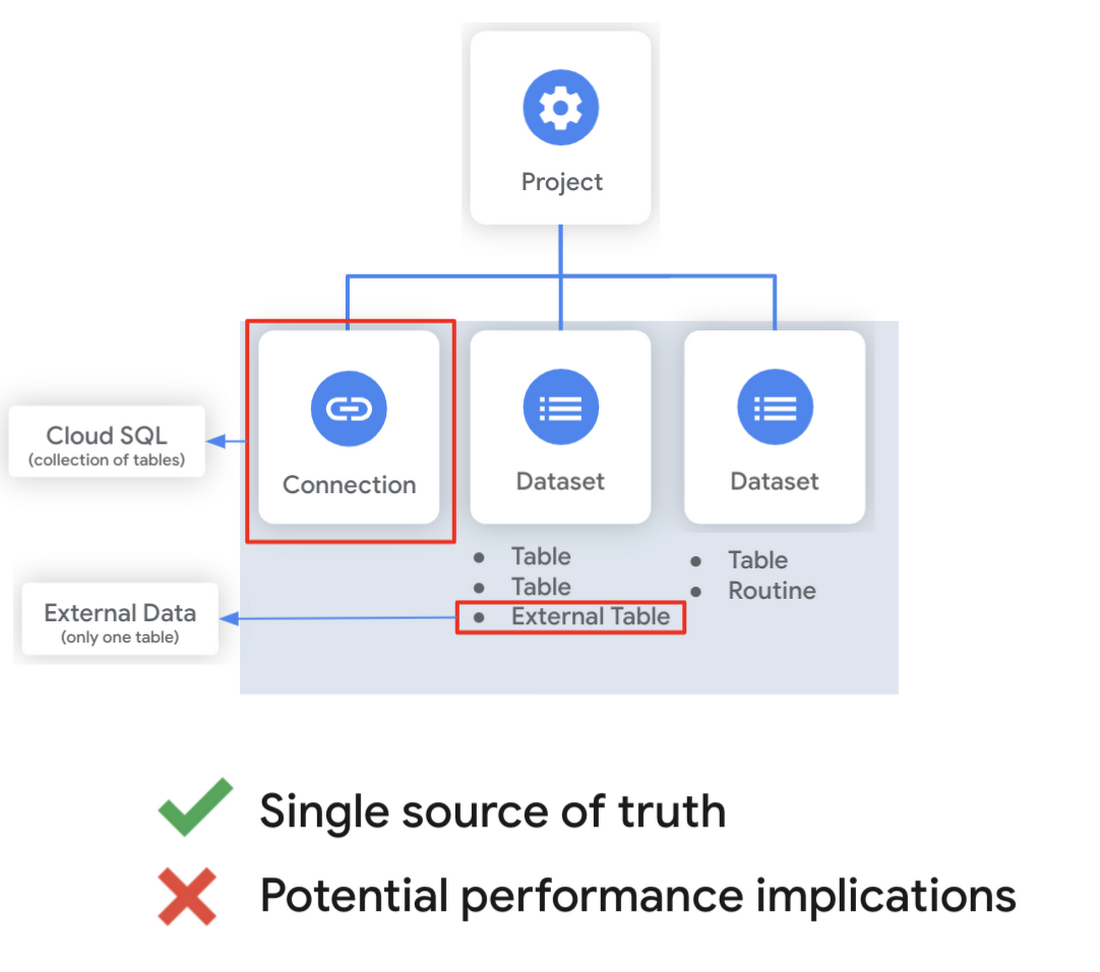
Using external tables or federated queries may result in queries that aren’t as fast as if the data had been stored in BigQuery itself. However, they can be useful for some data transformation patterns – for example, you may want to schedule a DDL/DML query that hydrates a managed table using a federated query, which selects and transforms data from Cloud SQL. An external table might also be useful for multi-consumer workflows where BQ storage isn’t the source of truth. Like, if you have a dataproc cluster accessing data in a Cloud Storage bucket that you’re not quite ready to port into BigQuery (although I do recommend taking a look at our connector if you need some convincing). You can learn more about querying external data in this video.
Logical and materialized views
In BigQuery, you can create a virtual table with a logical view or a materialized view. With logical views, BigQuery will execute the SQL statement to create the view at run time, it will not save the result anywhere. Additionally, you can grant users access to an authorized view to share query results without giving them access to the underlying tables.
# create a view that aggregates daily sales from a retail transaction tableCREATE VIEW retail.daily_sales as (SELECT date(t.transaction_timestamp) as date, sum(li.sale_price) as total_salesFROM retail.transaction_detail as tLEFT JOIN UNNEST(t.line_items) as liGROUP BY 1)
On the other hand, materialized views are re-computed in the background when the base data changes. No user action is required – they are always fresh! Better yet, if a query, or part of a query, against the source table can be resolved by querying the materialized view, BigQuery will reroute for improved performance. However, materialized views use a restricted SQL syntax and a limited set of aggregation functions. You can find details on limitations here.
# create a materialized view that aggregates daily salesCREATE MATERIALIZED VIEW retail.daily_sales as (SELECT date(t.transaction_timestamp) as date, sum(li.sale_price) as total_salesFROM retail.transaction_detail as tLEFT JOIN UNNEST(t.line_items) as liGROUP BY 1)
Temporary and cached results tables
Aside from the tables we’ve mentioned so far, you can also create a temporary managed table using the TEMP or TEMPORARY keyword. This table is saved in BigQuery storage and can be referenced for the duration of the script. Temporary tables can be a good alternative to WITH clauses because the defining query is only executed once as opposed to being inlined every place the alias is referenced.
| Original code | Optimized |
| with a as ( select …),b as ( select … from a …),c as ( select … from a …)select b.dim1, c.dim2from b, c; | create temp table a asselect …; with b as ( select … from a …),c as ( select … from a …)select b.dim1, c.dim2from b, c; |
It’s also important to mention that BigQuery writes all query results to a table – one either explicitly identified by the user or to a cached results table. Temporary, cached results tables are maintained per-user, per-project. There are no storage costs for temporary tables.
User defined functions & procedures
In BigQuery, a routine is either a user defined function (UDF) or a procedure. Routines allow you to re-use logic and handle your data in a unique way. A UDF is a function that is created using either SQL or Javascript, it takes arguments as input and returns a single value as an output. UDFs are often used for cleaning or re-formatting data. For example, extracting parameters from a URL string, restructuring nested data, or cleaning up strings:
# UDF to clean up string valuesCREATE OR REPLACE FUNCTIONmy_dataset.cleanse_string_test (text STRING)RETURNS STRINGAS (REGEXP_REPLACE(LOWER(TRIM(text)), '[^a-zA-Z0-9 ]+', ''));
We even have a community driven open-source repository of BigQuery UDFs! Just like logical views, you can create an authorized UDF that protects aspects of the underlying data. For more details on UDFs checkout our video here. You might also want to take a look at table functions – a preview feature where you can create a SQL UDF that returns a table instead of a scalar value.
Procedures, on the other hand, are blocks of SQL statements that can be called from other queries. Unlike UDFs, stored procedures can return multiple values or no values – which means you can run them to create or modify tables. In BigQuery, you can also leverage scripting capabilities within procedures to control execution flow with IF and WHILE statements. Plus, you can call your UDFs within your procedure! These aspects make procedures great for extract-load-transform (ELT) driven workflows.
# Procedure to create daily sales rollup, starting from startDate until endDateCREATE OR REPLACE PROCEDURE my_dataset.sum_sales(startDate STRING, endDate STRING)BEGINCREATE OR REPLACE TABLE retail.sales_resultAS (SELECTdate(t.transaction_timestamp) as date,sum(li.sale_price) as total_salesFROM retail.transaction_detail as tLEFT JOIN UNNEST(t.line_items) as liWHERE transaction_timestamp >= TIMESTAMP(startDate) AND transaction_timestamp <= TIMESTAMP(endDate)GROUP BY 1);END;CALL retail.sum_sales('2020-08-01', '2020-01-20');
To ensure consistent analytics across your organization, I recommend that you create a library dataset to house UDFs and procedures. You can easily grant everyone in your organization the BigQuery Data Viewer role to the library dataset so that all analysts use consistent and up-to-date logic in their queries.
Stay tuned!
We hope this gave you an understanding of how to leverage some of the different resources inside of a BigQuery dataset, and to help you make decisions like using native versus external storage, logical versus materialized views, and user defined functions or procedures.
Next up we’ll be talking about workload management in BigQuery by taking a look at jobs and the reservation model. Be sure to keep an eye out for more in this series by following me on LinkedIn and Twitter, and subscribing to our Youtube channel.
Google Cloud Tools Help U.S. Forest Department Generate Years of Insights into Earth’s Natural Resources

5013
Of your peers have already read this article.
3:00 Minutes
The most insightful time you'll spend today!
For 117 years, the U.S. Department of Agriculture’s Forest Service has been a steward of America’s forests, grasslands, and waterways. It directly manages 193 million acres and supports sustainable management on a total of 500 million acres of private, state, and tribal lands. Its impact reaches far beyond even that, offering its research and learning freely to the world.
At Google, we’re big admirers of the Forest Service’s mission. So we were thrilled to learn in 2011 that its scientists were using Google Earth Engine, our planetary-scale platform for Earth Science data and analysis, to aid its research, understanding, and effectiveness. In the years since, Google has worked with the Forest Service to meet its unique requirements for visual information about the planet. Using both historical and current data, the Forest Service built new products, workflows, and tools that help more effectively and sustainably manage our natural resources. The Forest Service also uses Earth Engine and Google Cloud to study the effects of climate change, forest fires, insects and disease, helping them create new insights and strategies.
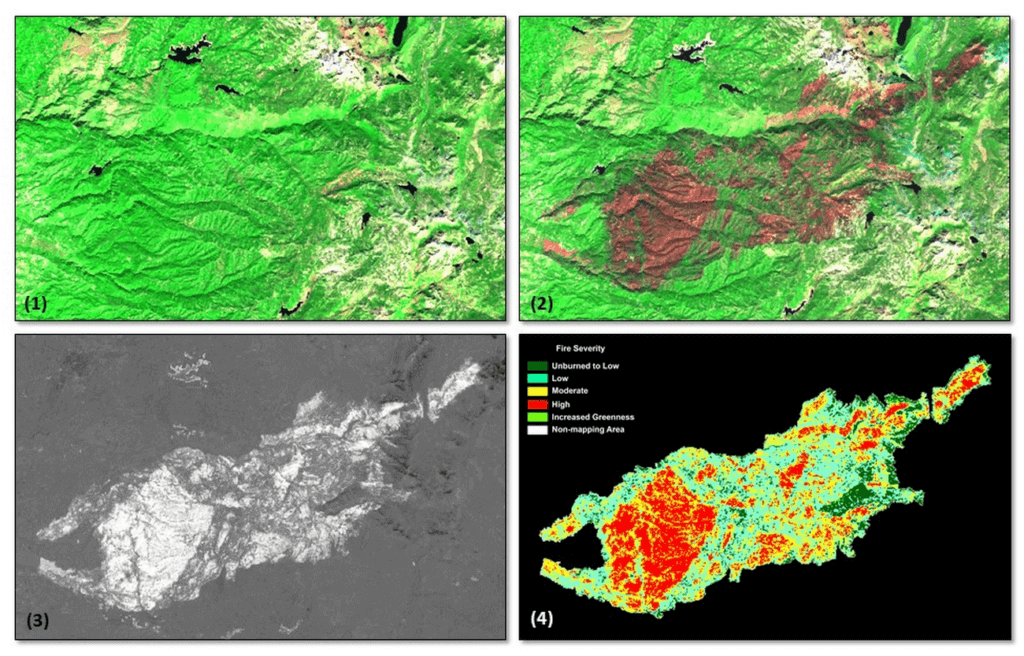
Besides gaining newfound depths of insight, the Forest Service has also sped up its research dramatically, enabling everyone to do more. Using Google Cloud and Earth Engine, the Forest Service reduced the time it took to analyze 10 years worth of land-cover changes from three months to just one hour, using just 100 lines of code. The agency built new models for coping with change, then mapped these changes over time, in its Landscape Change Monitoring System (LCMS) project.
Emergency responders can now work better on new threats that arise after wildfires, hurricanes, and other natural disasters. Forest health specialists can detect and monitor the impacts of invasive insects, diseases, and drought. More Forest Service personnel can use new tools and products within Earth Engine, thanks to numerous training and outreach sessions within the Forest Service.
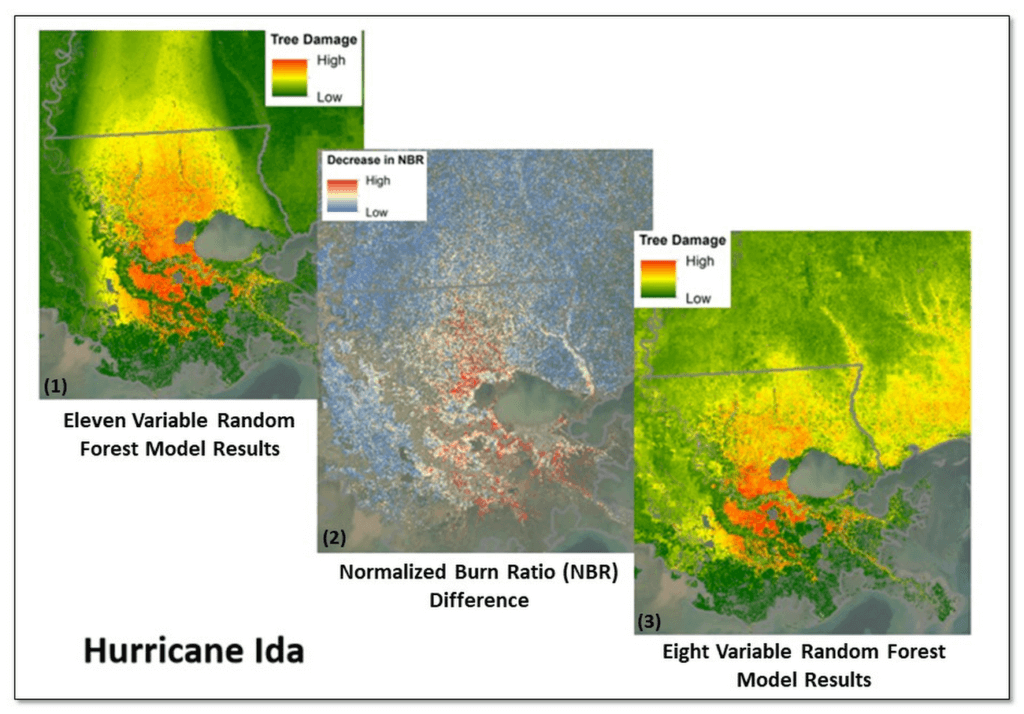
Researchers elsewhere also benefited when the Forest Service created new toolkits, and posted them to GitHub for public use. For example, there’s geeViz, a repository of Google Earth Engine Python code modules useful for general data processing, analysis, and visualization.
This is only the start. Recently, the Forest Service started using Google Cloud’s processing and analysis tools for projects like California’s Wildfire and Forest Resilience Action Plan. Forest Service researchers also use Google Cloud to better understand ecological conditions across landscapes in projects like Fuelcast, which provides actionable intelligence for rangeland managers, fire specialists, and growers, and the Scenario Investment Planning Platform for modeling local and national land management scenarios.
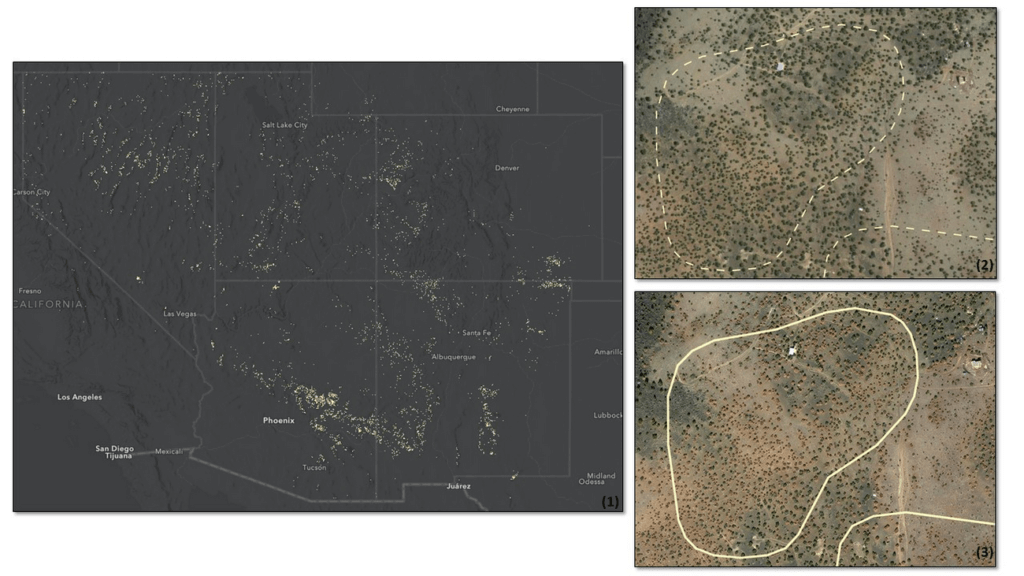
The Forest Service is a pioneer in building technology to help us better understand and care for our planet. With more frequent imaging, rich satellite data sets, and sophisticated database and computation systems, we can view and model the Earth as a large-scale dynamic system.
We are honored and excited to respond to the unique set of requirements of the scientists, engineers, rangers, and firefighters of the USFS, and look forward to years of learning about — and better caring for — our most precious resources.
*Image 1: The USDA Forest Service (USFS) Geospatial Technology and Applications Center (GTAC) uses science-based remote sensing methods to characterize vegetation and soil condition after wildland fire events. The results are used to facilitate emergency assessments to support hazard mitigation, to inform post-fire restoration planning, and to support the monitoring of national fire policy effectiveness. GTAC currently conducts these mapping efforts using long-established geospatial workflows. However, GTAC has adapted its post-fire mapping and assessment workflows to work within Google Earth Engine (GEE) to accommodate the needs of other users in the USFS. The spatially and temporally comprehensive coverage of moderate resolution multispectral data sources (e.g., Landsat, Sentinel 2) and analytical power provided by GEE allows users to create geospatial burn severity products quickly and easily. Box 1 shows a pre-fire Sentinel-2 false color composite image. Box 2 shows a post-fire Sentinel-2 false color composite image with the fire scar apparent in reddish brown. Box 3 shows a differenced Normalized Burn Ratio (dNBR) image showing the change between the pre- and post-fire images in Boxes 1 and 2. Box 4 shows a thresholded dNBR image of the burned area with four classes of burn severity (unburned to high severity), which is the final output delivered to forest managers.
*Image 2: Leveraging Google Earth Engine (GEE), the USDA Forest Service (USFS) Geospatial Technology and Applications Center (GTAC) and USFS Region 8, developed the Tree Structure Damage Impact Predictive (TreeS-DIP) modeling approach to predict wind damage to trees resulting from large hurricane events and produce spatial products across the landscape. TreeS-DIP results become available within 48 hours following landfall of a large storm event to allow allocation of ground resources to the field for strategic planning and management. Boxes 1 and 3 above show TreeS-DIP modeled outputs with varying data inputs and parameters. Box 2 shows changes in greenness (Normalized Burn Ratio; NBR) that was measured with GEE during the recovery from Hurricane Ida and is shown as a visual comparison to the rapidly available products from TreeS-DIP.
*Image 3: Severe drought conditions across the American West prompted concern about the health and status of pinyon-juniper woodlands, a vast and unique ecosystem. In a cooperative project between the USDA Forest Service (USFS) Geospatial Technology and Applications Center (GTAC) and Forest Health Protection (FHP), Google Earth Engine (GEE) was used to map pinyon pine and juniper mortality across 10 Western US States. The outputs are now being used to plan for future work including on-the-ground efforts, high-resolution imagery acquisitions, aerial surveys, in-depth mortality modeling, and planning for 2022 field season work.
Box 1 contains remote sensing change detection outputs (in white) generated with GEE, showing pinyon-juniper decline across the Southwestern US. Box 2 shows NAIP imagery from 2017 with, with box 3 showing NAIP imagery from 2021. NAIP imagery from these years shows trees changing from healthy and green in 2017 to brown and dying in 2021. In addition, box 2 and box 3 show change detection outputs from Box 1 for a location outside of Flagstaff, AZ converted to polygons (in white). The polygon in box 2 is displayed as a dashed line to serve as a reference, while the solid line in box 3 shows the measured change in 2021. Converting rasters to polygons allows the data to be easily used on tablet computers, as well as the ability to add information and photographs from field visits.
Home Depot’s Interconnected Retail Experience by Virtue of Google Cloud Migration for SAP Applications

8261
Of your peers have already read this article.
1:30 Minutes
The most insightful time you'll spend today!
With nearly 2,300 stores, The Home Depot is the world’s largest home-improvement chain — a brand that professional contractors and DIYers alike have come to depend on. The home improvement industry continues to experience unprecedented demand and dramatic increases in online ordering accompanied by expanding consumer expectations for things like curbside pickup and same day delivery. The Home Depot’s decision to migrate to cloud-based infrastructure, including the migration of the company’s SAP applications on Google Cloud which began in 2017, has set it up for success in an increasingly digital world, and helped the company adapt to changing market conditions quickly.
Interconnected retail at scale
Building on a strong customer-first philosophy, The Home Depot aims to create what it calls interconnected retail—allowing customers to shop however, whenever, and wherever they want. “So many companies are focused on omni-channel retail,” explains Sam Moses, Vice President of Corporate Systems. “At The Home Depot, we wanted to take it to the next level. Interconnected retail puts the customer at the center of everything and enables them to shop in store, online, or both. Customers can begin a transaction online and continue in-store, or vice-versa.”
To support this strategy, the company’s SAP environment needed to be more agile. Running everything on-premises, from central finance to POS systems, meant that The Home Depot’s IT teams experienced redundancy and repetitive, manual processes. Their data warehouse needed an upgrade to process and analyze growing and increasingly diverse data sets. The Home Depot chose to migrate its SAP environment to Google Cloud to support both the velocity and scale needed for the business as well as critical analytics capabilities needed for its bold digital initiatives. “We chose Google Cloud to support our SAP implementation. Our decision had a lot to do with the relationship between Google Cloud and SAP and also for the applications and services that are offered by Google Cloud, like BigQuery, which are helping to enable data and analytics within our organization,” Moses explains.
After migrating its SAP applications—including S/4HANA, its customer activity repository (CAR), general ledger, e-commerce system, enterprise data warehouse and more to Google Cloud, the company now has the speed, scale and flexibility to tackle enormous spikes in the business, all while staying fully available for their customers. Additionally, The Home Depot was able to transform its financial systems and make them more agile to deliver critical information across multiple business functions in real time.
Maximizing data insights to support customer experiences
By migrating to Google Cloud, The Home Depot is leveraging Google Cloud analytics to build the industry’s most efficient supply chain including more robust demand forecasting, supplier lead times, estimated delivery times and more, all while maintaining better security than before. “We experienced unprecedented change in our customers’ behavior and their buying patterns, which puts a lot of pressure on our supply chain,” explains Moses. “So having the ability to leverage data and analytics gives us insights to know exactly what it is that our customers need.”
The company’s analysts now use BigQuery ML for machine learning directly against the company’s BigQuery data and use AutoML to determine the best model for predictions. The Home Depot’s engineers have also adapted BigQuery to monitor, analyze, and act on application performance data across all its stores and warehouses in real time—capabilities that were not as seamless in the on-premises environment.
With hundreds of projects on Google Cloud, The Home Depot’s cloud journey is well on track, but the company is always looking to the future. “As our customers’ needs have continued to evolve, and as technology has continued to evolve, our relationship with Google will continue to advance — to be able to innovate together, to be able to find new solutions together, to better serve our customers.”
Learn more about how The Home Depot is renovating its retail operation with SAP on Google Cloud.

Google Leads the Database-as-a-Service Market: Forrester Research
DOWNLOAD RESEARCH REPORTS5478
Of your peers have already downloaded this article
3:00 Minutes
The most insightful time you'll spend today!
Database-as-a-service (DBaaS) has become critical for all businesses to build and support modern business applications and operational systems. It is changing the way companies build and support business applications and operational systems. With DBaaS, organizations can provision a relational or non-relational database of any size in minutes, without needing any technical expertise.
For app developers, it offers a database platform to build simple to sophisticated applications quickly, allowing them to focus on application logic rather than deal with database administration challenges. DBaaS automates the provisioning, administration, backup, recovery, availability, security, and scalability of the database without the need for a database administrator (DBA).
In addition, DBaaS helps enterprises migrate from their on-premises databases to the cloud to save money, support elastic scale, and deliver higher performance for expanding workloads.
Analyst firm Forrester Research in its recent report on the Database-as-a-Service market has named Google Cloud a leader in this space as it supports a broader set of use cases, automation, high-end scalability and performance, and security.
Download this Forrester Research report to understand why enterprises are turning to DBaaS and why Google Cloud is a leader in this space.
More Relevant Stories for Your Company
Memorystore for Redis Read Replicas to Scale App Read Requests by 6X
Modern applications need to process large-scale data at millisecond latency to provide experiences like instant gaming leaderboards, fast analysis of streaming data from millions of IoT sensors, or real-time threat detection of malicious websites. In-memory datastores are a critical component to deliver the scale, performance, and availability required by these

An AI-Powered Cost Cutting Guide: 8 Strategies for Maximizing Profits
We are increasingly seeing one question arise in virtually every customer conversation: How can the organization save costs and drive new revenue streams? Everyone would love a crystal ball, but what you may not realize is that you already have one. It's in your data. By leveraging Data Cloud and




Replacing Oracle with Cloud Spanner: What Optiva Learnt
Optiva is a Canada-based provider of business support system (BSS) and Operations Support Systems (OSS) software and services to the telecommunications vertical. Optiva sought to improve its product offering. In the way were very tough challenges including a need for accuracy, the need to deal with very high volumes, the

Wayfair Writes its Success Story with BigQuery for Internal Analytics
Editor’s note: Home-goods and furniture giant Wayfair first partnered up with Google Cloud to transform and scale its storefront—work that proved its value many times over during the unprecedented surge in ecommerce traffic during 2020. Today, we hear how BigQuery’s performance and cost optimization have transformed the company’s internal analytics
