





An AI-Powered Cost Cutting Guide: 8 Strategies for Maximizing Profits

1722
Of your peers have already read this article.
3:30 Minutes
The most insightful time you'll spend today!
We are increasingly seeing one question arise in virtually every customer conversation: How can the organization save costs and drive new revenue streams?
Everyone would love a crystal ball, but what you may not realize is that you already have one. It’s in your data. By leveraging Data Cloud and AI solutions, you can put your data to work to achieve your financial objectives. Combining your data and AI reveals opportunities for your business to reduce expenses and increase profitability, which is especially valuable in an uncertain economy.
Google Cloud customers globally are succeeding in this effort, across industries and geographies. They are improving ROI by saving money and creating new revenue streams. We have distilled the strategies and actions they are implementing—along with customer examples and tips—in our eBook, “Make Data Work for You.” In it, you’ll find ways you can pare costs, increase profitability, and monetize your data.
Find money in your data
Our Google Cloud teams have identified eight strategies that successful organizations are pursuing to trim expenses and uncover new sources of revenue through intelligent use of data and AI. These use cases range from scaling small efficiencies in logistics to accelerating document-based workflows, monetizing data, and optimizing marketing spend.
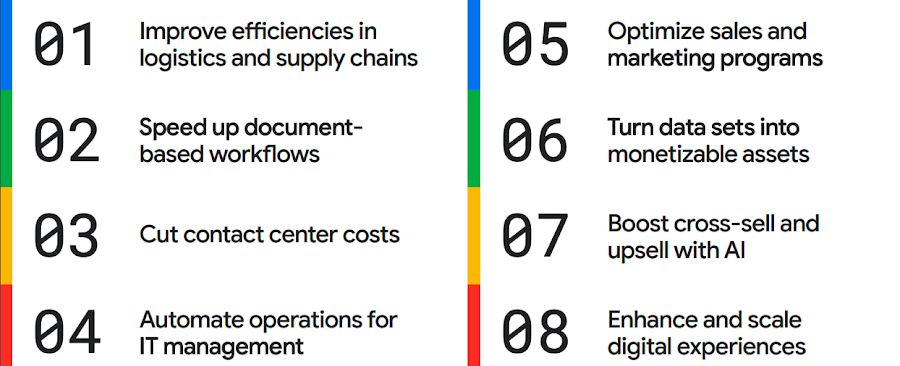
The results are impressive. They include massive cost savings and additional revenue. On-time deliveries have increased sharply at one company, and procure-to-pay processing costs have fallen by more than half at another. Other organizations have reaped big gains in ecommerce upselling and customer satisfaction.
We’ve found that businesses across every industry and around the globe are able to take action on at least one of these eight strategies. Contrary to common misperceptions, implementation does not require massive technology changes, crippling disruption to your business, or burdensome new investments.
What success looks like
If you worry your business is not ready or you need to gain buy-in from leadership, the success stories of the 15 companies in this report are helpful examples. Learning how organizations big and small, in different industries and parts of the world, have implemented these data and AI strategies makes the opportunities more tangible.
Carrefour
Among the world’s largest retailers, Carrefour operates supermarkets, ecommerce, and other store formats in more than 30 countries. To retain leadership in its markets, the company wanted to strengthen its omnichannel experience.
Carrefour moved to Google Data Cloud and developed a platform that gives its data scientists secure, structured access to a massive volume of data in minutes. This paved the way for smarter models of customer behavior and enabled a personalized recommendation engine for ecommerce services.
The company saw a 60% increase in ecommerce revenue during the pandemic, which it partly attributes to this personalization.
ATB Financial
ATB Financial, a bank in the Canadian province of Alberta, uses its data and AI to provide real-time personalized customer service, generating more than 20,000 AI-assisted conversations monthly. Machine learning models enable agents to offer clients real-time tailored advice and product suggestions.
Moreover, marketing campaigns and month-end processes that used to take five to eight hours now run in seconds, saving over CA$2.24 million a year.
Bank BRI
Bank BRI, which is owned by the Indonesian government, has 75.5 million clients. Through its use of digital technologies, the institution amasses a lot of valuable data about this large customer base.
Using Google Cloud, the bank packages this data through more than 50 monetized open APIs for more than 70 ecosystem partners who use it for credit scoring, risk management, and other applications. Fintechs, insurance companies, and financial institutions don’t have the talent or the financial resources to do quality credit scoring and fraud detection on their own, so they are turning to Bank BRI.
Early in the effort, the project generated an additional $50 million in revenue, showing how data can drive new sources of income.
How to get going now
“Make Data Work for You” will help you launch your financial resiliency initiatives by outlining the steps to get going. The process lays the groundwork for realizing your own cost savings and new revenue streams by leveraging data and AI.
Among these steps include building frameworks to operate cost efficiently, make informed decisions related to spending and optimize your data and AI budgets.
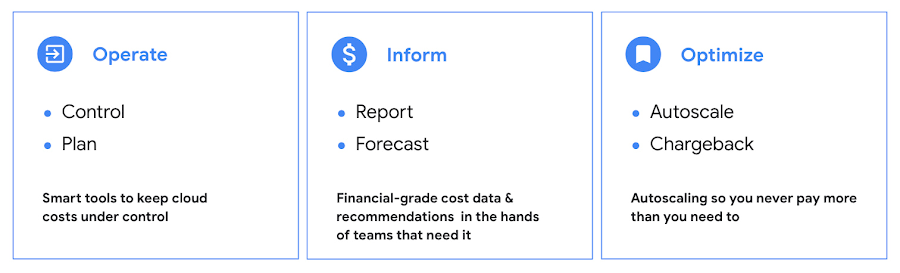
Operate: Billing that’s specific to your use-case
Control your costs by choosing data and analytics vendors who offer industry-leading data storage solutions and flexible pricing options. For example, multiple pricing options such as flat rate and pay-as-you-go allow you to optimize your spend for best price-performance.
Inform: make informed decisions based on usage
Use your cloud vendor’s dashboards or build a billing data report to gain insights on your spending over time. Make use of cost recommendations and other forecasting tools to predict what your future expenses are going to be.
Optimize: Never pay more than you use
While planning data analytics capacity, organizations often overprovision and overpay than what they actually use. Consider migrating your workloads that have unpredictable demand to a data warehousing solution that offers granular level autoscaling features so that you never have to pay for more than what you use.
There are other key moves that will set your initiative up for success including how to shorten time to value in building AI models and measuring impact. You can find details in the report.
A brighter future
The teams at Google Cloud helped the companies in “Make Data Work for You,” along with many more organizations, use their data and AI to achieve meaningful results. Download the full report to see how you can too.
Make Meaningful Analysis with Geo Boundary Public Datasets on BigQuery

6362
Of your peers have already read this article.
4:00 Minutes
The most insightful time you'll spend today!
Geospatial data is a critical component for a comprehensive analytics strategy. Whether you are trying to visualize data using geospatial parameters or do deeper analysis or modeling on customer distribution or proximity, most organizations have some type of geospatial data they would like to use – whether it be customer zipcodes, store locations, or shipping addresses. However, converting geographic data into the correct format for analysis and aggregation at different levels can be difficult. In this post, we’ll walk through some examples of how you can leverage the Google Cloud platform alongside Google Cloud Public Datasets to perform robust analytics on geographic data. The full queries can be accessed from this notebook here.
Public US Geo Boundaries dataset
BigQuery hosts a slew of public datasets for you to access and integrate into your analytics. Google pays for the storage of these datasets and provides public access to the data via the bigquery-public-data project. You only pay for queries against the data. Plus, the first 1 TB per month is free! These public datasets are valuable on their own, but when joined against your own data they can unlock new analytics use cases and save the team a lot of time.
Within the Google Cloud Public Datasets Program there are several geographic datasets. Here, we’ll work with the geo_us_boundaries dataset, which contains a set of tables that have the boundaries of different geospatial areas as polygons and coordinates based on the center point (GEOGRAPHY column type in BigQuery), published by the US Census Bureau.

Mapping geospatial points to hierarchical areas
Many times you will find yourself in situations where you have a string representing an address. However, most tools require lat/long coordinates to actually plot points. Using the Google Maps Geocoding API we can convert an address into a lat/long and then store the results in the BigQuery table.
With a lat/long representation of our point, we can join our initial dataset back onto any of the tables here using the ST_WITHIN function. This allows us to check and see if a point is within the specified polygon.
ST_WITHIN(geography_1, geography_2)
This can be helpful for ensuring standard nomenclature; for example, metropolitan areas that might be named differently. The query below maps each customers’ address to a given metropolitan area name.
SELECTcust.id as customer_id,metro.name as metro_nameFROM `looker-private-demo.retail.customers` as cust,`bigquery-public-data.geo_us_boundaries.metropolitan_divisions` as metroWHERE ST_WITHIN(ST_GEOGPOINT(cust.longitude, cust.latitude),metro.metdiv_geom)
It can also be useful for converting to designated market area (DMA), which is often used in creating targeted digital marketing campaigns.
SELECTcust.id as customer_id,dma.dma_nameFROM `looker-private-demo.retail.customers` as cust,`bigquery-public-data.geo_us_boundaries.designated_market_area` as dmaWHERE ST_WITHIN(ST_GEOGPOINT(cust.longitude, cust.latitude),dma.dma_geom)
Or for filling in missing information; for example, some addresses may be missing zip code which results in incorrect calculations when aggregating up to the zipcode level. By joining onto the zip_codes table we can ensure all coordinates are mapped appropriately and aggregate up from there.
SELECTzip.zip_code,count(distinct cust.id) as unique_customersFROM `looker-private-demo.retail.customers` as cust,`bigquery-public-data.geo_us_boundaries.zip_codes` as zipWHERE ST_WITHIN(ST_GEOGPOINT(cust.longitude, cust.latitude),zip.zip_code_geom)GROUP BY 1
Note that the zip code table isn’t a comprehensive list of all US zip codes, they are zip code tabulation areas (ZCTAs). Details about the differences can be found here. Additionally, the zip code table gives us hierarchical information, which allows us to perform more meaningful analytics. One example is leveraging hierarchical drilling in Looker. I can aggregate my total sales up to the country level, and then drill down to state, city and zipcode to identify where sales are highest. You can also use the BigQuery GeoViz tool to visualize geospatial data!

Aside from simply checking if a point is within an area, we can also use ST_DISTANCE to do something like find the closest city using the centerpoint for the metropolitan area table.
SELECTcust.id as customer_id,ARRAY_AGG(metro.name order by ST_DISTANCE(ST_GEOGPOINT(cust.longitude, cust.latitude),metro.internal_point_geom) asc limit 1)[offset(0)] as metro_nameFROM`looker-private-demo.retail.customers` as cust,`bigquery-public-data.geo_us_boundaries.metropolitan_divisions` as metroGROUP BY cust.id
This concept doesn’t just hold true for points, we can also leverage other GIS functions to see if a geospatial area is contained within areas that are listed in the boundaries datasets. If your data comes into BigQuery as a GeoJSON string, we can convert it to a GEOGRAPHY type using the ST_GEOGFROMGEOJSON function. Once our data is in a GEOGRAPHY type we can do things like check to see what urban area the geo is within – using either ST_WITHIN or ST_INTERSECTS to account for partial coverage. Here, I am using the customer’s zip code to find all metropolitan divisions where the zip code polygon and the metropolitan polygon intersect. I am then selecting the metropolitan area that has the most overlap (or the intersection has the largest area) to be the customer’s metro that we use for reporting.
SELECTcust.id as customer_id,ARRAY_AGG(metro.name order by ST_AREA(ST_INTERSECTION(zip.zip_code_geom,metro.metdiv_geom)) desc limit 1)[offset(0)] as metro_nameFROM`looker-private-demo.retail.customers` as custJOIN `bigquery-public-data.geo_us_boundaries.zip_codes` as zip on cust.zip=zip.zip_code,`bigquery-public-data.geo_us_boundaries.metropolitan_divisions` as metroWHERE ST_INTERSECTS(zip.zip_code_geom,metro.metdiv_geom)GROUP BY cust.id
The same ideas can be applied to the other tables in the dataset including the county, urban areas and National Weather Service forecast regions (which can also be useful if you want to join your datasets onto weather data).
Correcting for data discrepancy
One problem that we may run into when working with geospatial data is that different data sources may have different representations of the same information. For example, you might have one system that records state as a two letter abbreviation and another using the full name. Here, we can use the state table to join the different datasets.
SELECTst.state_name,sum(ab.sales+fn.sales) as total_salesFROM `bigquery-public-data.geo_us_boundaries.states` as stLEFT JOIN abbreviated_table as ab on ab.state = st.stateLEFT JOIN fullname_table as fn on fn.state = st.state_nameWHERE COALESCE(ab.state, fn.state) IS NOT NULLGROUP BY 1
Another example might be using the tables as a source of truth for fuzzy matching. If the address is a manually entered field somewhere in your application, there is a good chance that things will be misspelled. Different representations of the same name may prevent tables from joining with each other or lead to duplicate entries when performing aggregations. Here, I use a simple Soundex algorithm to generate a code for each county name, using helper functions from this blog post. We can see that even though some are misspelled they have the same Soundex code.

Next, we can join back onto our counties table so we make sure to use the correct spelling of the county name. Then, we can simply aggregate our data for more accurate reporting.
SELECTc.county_name,sum(sales) as total_salesFROMtableJOIN `bigquery-public-data.geo_us_boundaries.counties` as con testing.dq_fm_Soundex(table.county) = testing.dq_fm_Soundex(c.county_name)WHERE c.state_fips_code = cast(36 as string)GROUP BY 1
Note that fuzzy matching definitely isn’t perfect and you might need to try different methods or apply certain filters for it to work best depending on the specifics of your data.
The US Geo Boundary datasets allow you to perform meaningful geographic analysis without needing to worry about extracting, transforming or loading additional datasets into BigQuery. These datasets, along with all the other Google Cloud Public Datasets, will be available in the Analytics Hub. Please sign up for the Analytics Hub preview, which is scheduled to be available in the third quarter of 2021, by going to g.co/cloud/analytics-hub.
Quick Recap on Google Cloud: Latest News, Launches, Updates, Events and More

12940
Of your peers have already read this article.
2:00 Minutes
The most insightful time you'll spend today!
Want to know the latest from Google Cloud? Find it here in one handy location. Check back regularly for our newest updates, announcements, resources, events, learning opportunities, and more.
Tip: Not sure where to find what you’re looking for on the Google Cloud blog? Start here: Google Cloud blog 101: Full list of topics, links, and resources.
Week of May 24-May 28 2021
- Google Cloud for financial services: driving your transformation cloud journey–As we welcome the industry to our Financial Services Summit, we’re sharing more on how Google Cloud accelerates a financial organization’s digital transformation through app and infrastructure modernization, data democratization, people connections, and trusted transactions. Read more or watch the summit on demand.
- Introducing Datashare solution for financial services–We announced the general availability of Datashare for financial services, a new Google Cloud solution that brings together the entire capital markets ecosystem—data publishers and data consumers—to exchange market data securely and easily. Read more.
- Announcing Datastream in Preview–Datastream, a serverless change data capture (CDC) and replication service, allows enterprises to synchronize data across heterogeneous databases, storage systems, and applications reliably and with minimal latency to support real-time analytics, database replication, and event-driven architectures. Read more.
- Introducing Dataplex: An intelligent data fabric for analytics at scale–Dataplex provides a way to centrally manage, monitor, and govern your data across data lakes, data warehouses and data marts, and make this data securely accessible to a variety of analytics and data science tools. Read more.
- Announcing Dataflow Prime–Available in Preview in Q3 2021, Dataflow Prime is a new platform based on a serverless, no-ops, auto-tuning architecture built to bring unparalleled resource utilization and radical operational simplicity to big data processing. Dataflow Prime builds on Dataflow and brings new user benefits with innovations in resource utilization and distributed diagnostics. The new capabilities in Dataflow significantly reduce the time spent on infrastructure sizing and tuning tasks, as well as time spent diagnosing data freshness problems. Read more.
- Secure and scalable sharing for data and analytics with Analytics Hub–With Analytics Hub, available in Preview in Q3, organizations get a rich data ecosystem by publishing and subscribing to analytics-ready datasets; control and monitoring over how their data is being used; a self-service way to access valuable and trusted data assets; and an easy way to monetize their data assets without the overhead of building and managing the infrastructure. Read more.
- Cloud Spanner trims entry cost by 90%–Coming soon to Preview, granular instance sizing in Spanner lets organizations run workloads at as low as 1/10th the cost of regular instances, equating to approximately $65/month. Read more.
- Cloud Bigtable lifts SLA and adds new security features for regulated industries–Bigtable instances with a multi-cluster routing policy across 3 or more regions are now covered by a 99.999% monthly uptime percentage under the new SLA. In addition, new Data Access audit logs can help determine whether sensitive customer information has been accessed in the event of a security incident, and if so, when, and by whom. Read more.
- Build a no-code journaling app–In honor of Mental Health Awareness Month, Google Cloud’s no-code application development platform, AppSheet, demonstrates how you can build a journaling app complete with titles, time stamps, mood entries, and more. Learn how with this blog and video here.
- New features in Security Command Center—On May 24th, Security Command Center Premium launched the general availability of granular access controls at project- and folder-level and Center for Internet Security (CIS) 1.1 benchmarks for Google Cloud Platform Foundation. These new capabilities enable organizations to improve their security posture and efficiently manage risk for their Google Cloud environment. Learn more.
- Simplified API operations with AI–Google Cloud’s API management platform Apigee applies Google’s industry leading ML and AI to your API metadata. Understand how it works with anomaly detection here.
- This week: Data Cloud and Financial Services Summits–Our Google Cloud Summit series begins this week with the Data Cloud Summit on Wednesday May 26 (Global). At this half-day event, you’ll learn how leading companies like PayPal, Workday, Equifax, and many others are driving competitive differentiation using Google Cloud technologies to build their data clouds and transform data into value that drives innovation. The following day, Thursday May 27 (Global & EMEA) at the Financial Services Summit, discover how Google Cloud is helping financial institutions such as PayPal, Global Payments, HSBC, Credit Suisse, AXA Switzerland and more unlock new possibilities and accelerate business through innovation. Read more and explore the entire summit series.
- Announcing the Google for Games Developer Summit 2021 on July 12th-13th–With a surge of new gamers and an increase in time spent playing games in the last year, it’s more important than ever for game developers to delight and engage players. To help developers with this opportunity, the games teams at Google are back to announce the return of the Google for Games Developer Summit 2021 on July 12th-13th. Hear from experts across Google about new game solutions they’re building to make it easier for you to continue creating great games, connecting with players and scaling your business. Registration is free and open to all game developers. Register for the free online event at g.co/gamedevsummit to get more details in the coming weeks. We can’t wait to share our latest innovations with the developer community. Learn more.
Discover Latest Resources on Google Cloud’s Datasets Solution

6346
Of your peers have already read this article.
3:00 Minutes
The most insightful time you'll spend today!
Editor’s note: With Google Cloud’s datasets solution, you can access an ever-expanding resource of the newest datasets to support and empower your analyses and ML models, as well as frequently updated best practices on how to get the most out of any of our datasets. We will be regularly updating this blog with new datasets and announcements, so be sure to bookmark this link and check back often.
August 2021
New dataset: Google Cloud Release Notes
- Looking for a new way to access Google Cloud Release Notes besides the docs, the XML feed, and Cloud Console? Check out the Google Cloud Release Notes dataset. With up-to-date release notes for all generally available Google Cloud products, this dataset allows you to use BigQuery to programmatically analyze release notes across all products, exploring security bulletin updates, fixes, changes, and the latest feature releases.
- Access the dataset

July 2021
Best practice: Use Google Trends data for common business needs
- The Google Trends dataset represents the first time we’re adding Google-owned Search data into Datasets for Google Cloud. The Trends data allows users to measure interest in a particular topic or search term across Google Search, from around the United States, down to the city-level. You can learn more about the dataset here, and check out the Looker dashboard here! These tables are super valuable in their own right, but when you blend them with other actionable data you can unlock whole new areas of opportunity for your team. To learn how to make informed decisions with Google Trends data, keep reading.
- Access the dataset
New dataset: COVID-19 Vaccination Search Insights
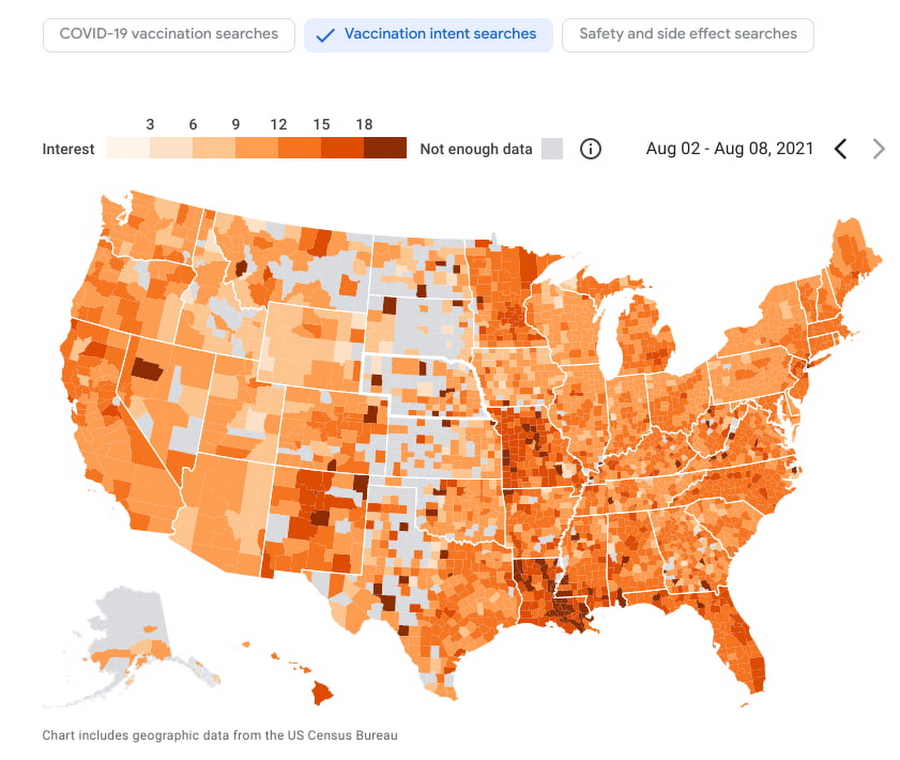
- With COVID-19 vaccinations being a topic of interest around the United States, this dataset shows aggregated, anonymized trends in searches related to COVID-19 vaccination and is intended to help public health officials design, target, and evaluate public education campaigns. Check out this interactive dashboard to explore searches for COVID-19 vaccination topics by region.
- Access the dataset
June 2021
New dataset: Google Diversity Annual Report 2021
- Since 2014, Google has disclosed data on the diversity of its workforce in an effort to bring candid transparency to the challenges technology companies like Google face in recruitment and retention of underrepresented communities. In an effort to make this data more accessible and useful, we’ve loaded it into BigQuery for the first time ever. To view Google’s Diversity Annual Report and learn more, check it out.
- Access the dataset
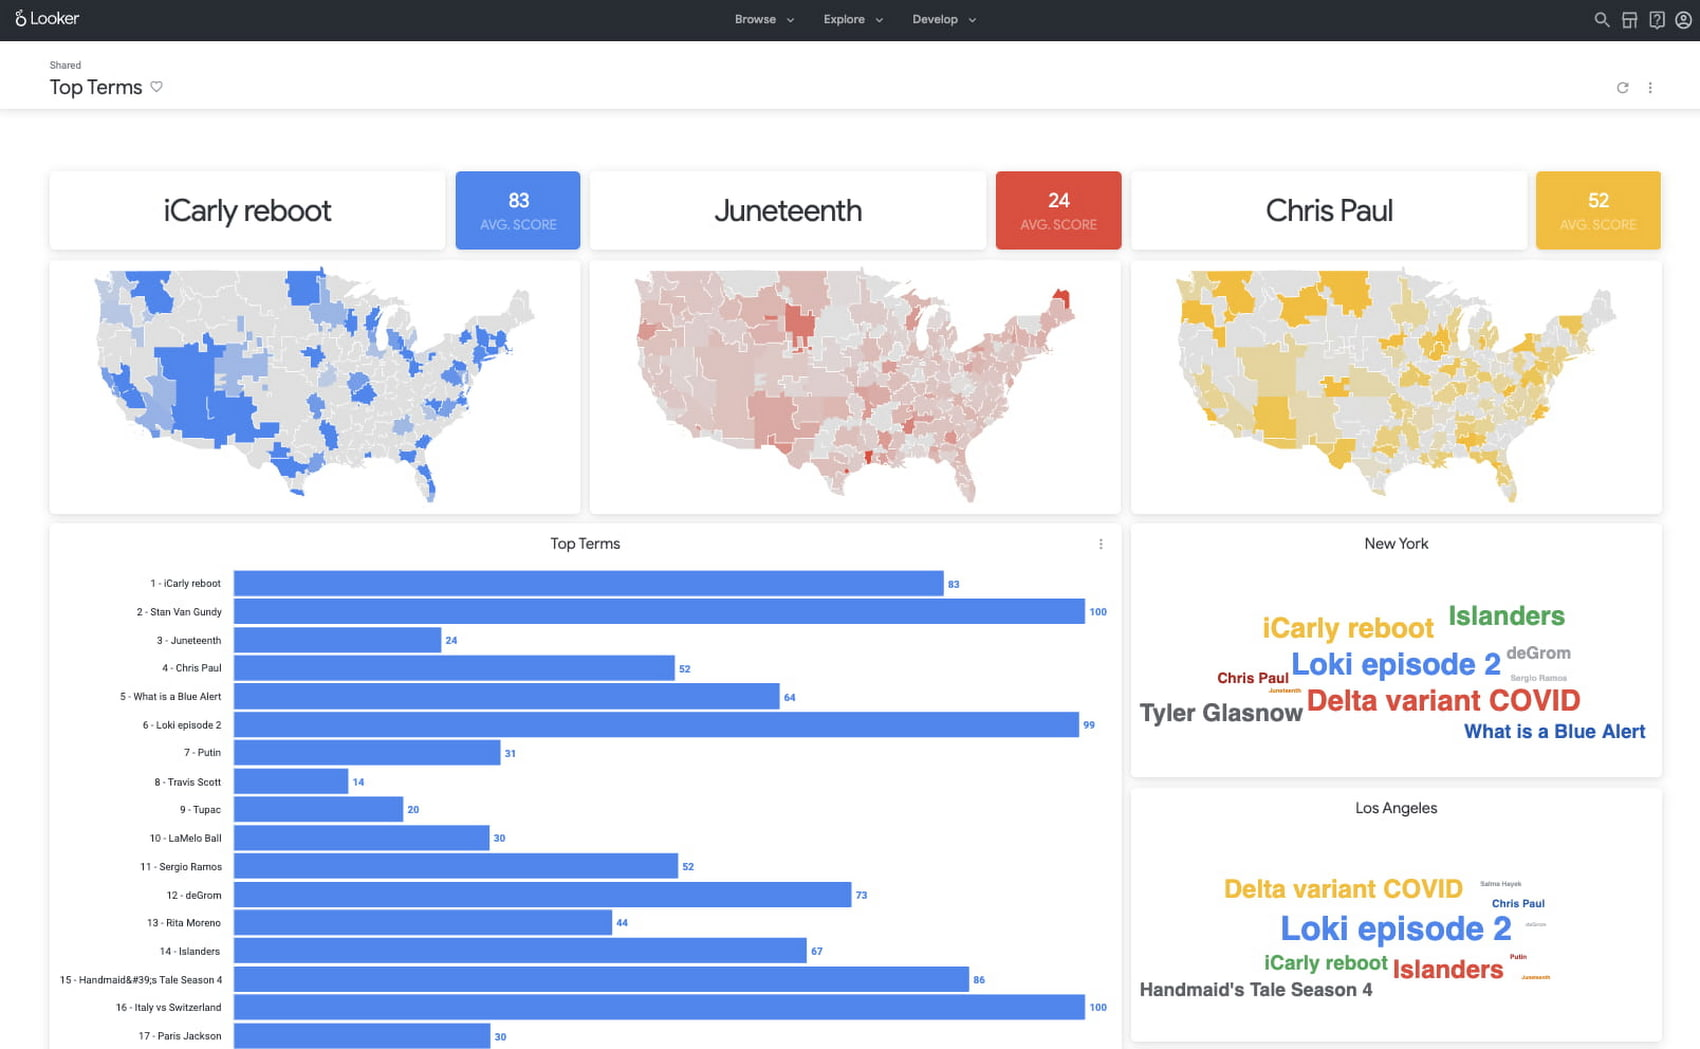
New dataset: Google Trends Top 25 Search terms
- The most popular and surging Google Search terms are now available in BigQuery as a public dataset. View the Top 25 and Top 25 rising queries from Google Trends from the past 30-days, including 5 years of historical data across the 210 Designated Market Areas (DMAs) in the US. Keep reading.
- Access the dataset
New dataset: COVID-19 Vaccination Access
- With metrics quantifying travel times to COVID-19 vaccination sites, this dataset is intended to help Public Health officials, researchers, and Healthcare Providers to identify areas with insufficient access, deploy interventions, and research these issues. Check out how this data is being used in a number of new tools.
- Access the dataset
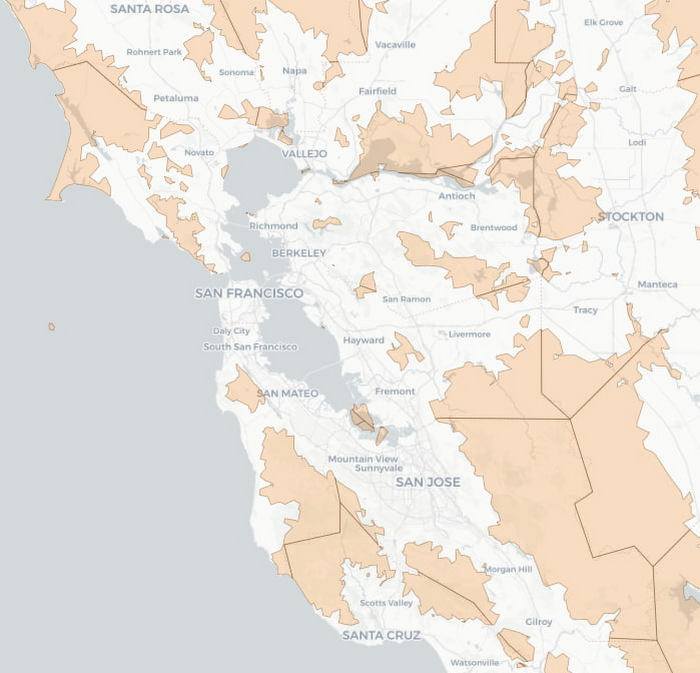

Best practice: Leveraging BigQuery Public Boundaries datasets for geospatial analytics
- Geospatial data is a critical component for a comprehensive analytics strategy. Whether you are trying to visualize data using geospatial parameters or do deeper analysis or modeling on customer distribution or proximity, most organizations have some type of geospatial data they would like to use – whether it be customer zipcodes, store locations, or shipping addresses. However, converting geographic data into the correct format for analysis and aggregation at different levels can be difficult. In this post, we’ll walk through some examples of how you can leverage the Google Cloud platform alongside Google Cloud Public Datasets to perform robust analytics on geographic data. Keep reading.
- Access the dataset

Get the metadata and try BigQuery sandbox
When you’ve learned about many of our datasets and pre-built solutions from across Google, you may be ready to start querying them. Check out the full dataset directory and read all the metadata at g.co/cloud/marketplace-datasets, then dig into the data with our free-to-use BigQuery sandbox account, or $300 in credits with our Google Cloud free trial.
3356
Of your peers have already watched this video.
28:03 Minutes
The most insightful time you'll spend today!
Crux Accelerates Data Operations with Google BigQuery
Being in the constantly evolving and changing data business, Crux Informatics has integrated with Google Cloud and BigQuery to achieve the benefits of a data cloud, including fully managed global scale, load management, high performance, and genuinely good support.
Watch this video to learn more about how this partnership will help Crux get success with BigQuery.
Guide for Measuring Cloud Spanner Performance for Your Custom Workload

4838
Of your peers have already read this article.
3:00 Minutes
The most insightful time you'll spend today!
Database migration to a new database platform or technology can be daunting for various reasons. One of the common concerns is database performance. It is hard to evaluate database performance early in the evaluation cycle without performing actual data migration and application changes. This becomes even more important in the case of Cloud Spanner where modernization is required at both the database and application layers.
The traditional approach to evaluate database performance is to deploy the application and database together, migrate historical data to the new database and then simulate load tests by running an application on the new database. Doing all this for an early performance evaluation of Cloud Spanner may feel like a lot of effort.
In this post, we will explore a middle ground to performance testing using JMeter. Performance test Cloud Spanner for a custom workload before making application code changes and executing data migration. More detailed step-by-step guide is published here.
Goals
- Estimate the number of Cloud Spanner nodes needed (and get a cost estimate).
- Performance test the most frequently used set of queries and transactions.
- Demonstrate the ability to scale horizontally.
- Better understand the optimizations needed for schema and sql queries.
- Determine latency of DML operations.
Limitations
- You cannot test using non-java client libraries.
- It is more complex to test non-jdbc compliant features like mutations, parallel reads etc.
Preparing for performance tests
- Identify top SQL queries, latency, frequency / hour and avg number of rows returned or updated for each. This information will also serve as a baseline for the current system.
- Determine Cloud Spanner region / multi-region deployment. Ideally, load should be generated from the Cloud Spanner instance’s leader region for minimum latency and best performance. Read Demystifying Cloud Spanner multi-region configurations for more details on various configurations of Cloud Spanner.
- Estimate the number of Cloud Spanner nodes required for a given workload based on (step 1). It is recommended to have a minimum of 2 nodes for linear scaling.
Note: Peak performance numbers of regional performance and multi regional performance are published. It is based on a 1KB single row transaction with no secondary indexes. - Request quota for Cloud Spanner nodes on a given region / multi-region. It can take up to 1 business day.
Setting up Cloud Spanner
Creating the schema for Cloud Spanner
You can use the following tools to generate a schema for Cloud Spanner if you are migrating from the following source databases. Alternatively, you can model the schema manually. Schema design has a huge performance impact, hence it is recommended to review the schema very carefully.
| Source | Target | Tool(s) | |
| 1. | MySQL / MariaDB | Cloud Spanner | HarbourBridgeStriim |
| 2. | Postgresql | Cloud Spanner | HarbourBridgeStriim |
| 3. | Oracle | Cloud Spanner | Striim |
| 4. | SQL Server | Cloud Spanner | Striim |
Note: Manual review and tuning of schema will be needed to optimize and mitigate potential hotspots. You will need to keep in mind schema design best practices when modeling your schema.
Populating seed data into Cloud Spanner
Performance of a database depends on the amount of data present. Existing data (and indexes) determines how much data is scanned on select queries and therefore performance. Hence, it is important to seed data into Cloud Spanner before performance testing.
For most realistic results, data should be migrated from an existing production source. Sometimes you cannot do that due to schema changes. One way is to utilize a custom ETL job to export and transform data and then import into Cloud Spanner. Another alternative could be to mock seed data using JMeter(More details in later sections).
JMeter performance tests
Writing Tests
JMeter will interact with Cloud Spanner just like your application. It will perform DML operations the same way as your application does. Hence, tests need to simulate production like transactions. For example if a transaction is made up of insert and/or update statements in several tables within transaction boundaries then JMeter should mimic the same.
JMeter has the following hierarchy:
Test Plan > Thread Group(s) > Sampler(s) (aka test)
Test plan is a top level component. It can contain global properties and libraries (like jdbc driver etc).
Thread Group(s) are representative of a database transaction. It contains one or more sampler(s). All the samplers within a thread group execute serially.
Sampler(s) should represent a single DML call. If your transaction needs to have multiple dml calls, you should create multiple samplers. Typically you will use JDBC Sampler for database calls. You can also use JSR 223 Sampler as described here, in case you need to use mutations or parallel reads etc. Results from one sampler can be passed to the next, as in real world application.
Executing tests and collecting results
JMeter tests should be executed as physically close to Cloud Spanner instances as possible to minimize network latency. Therefore it is best to execute them from Compute Engine (via private service connect) from the same region as the Cloud Spanner instance. In-case of multi region Cloud Spanner, GCE instances should be created in the Leader Region of the Cloud Spanner instance for lowest network latency.
JMeter should be executed via command line, it is a CPU intensive application so make sure you have allocated enough resources on the VM.
Refer to the Cloud Spanner monitoring dashboard to ensure that your Cloud Spanner instance’s CPU utilization is at or below the recommended values. In addition, use introspection tools to investigate performance issues with your database.
You might need to optimize your queries (add indexes) and re-execute tests in multiple waves to tune the performance as needed.
Try it yourself
Follow a detailed step by step tutorial on Measure Cloud Spanner performance test using JMeter to test Cloud Spanner performance yourself.
More Relevant Stories for Your Company

AI Solutions for Government Organizations: How to Get Started
Cloud-native features are helping public sector teams innovate faster than ever. Ideas discussed in a morning meeting can be a working proof of concept later that day. Managed services can remove administrative burden and reduce the steps needed to design and provision cloud infrastructure. Security can be built-in from the

Ahead of the Curve: 5 Data and AI Trends Set to Shape 2023
How will your organization manage this year's data growth and business requirements? Your actions and strategies involving data and AI will improve or undermine your organization's competitiveness in the months and years to come. Our teams at Google Cloud have an eye on the future as we evolve our strategies

Cloud Bigtable Helps Fraud-detection Company Meet Scalability Demands and Secure Customer Data
Editor’s note: Today we are hearing from Jono MacDougall , Principal Software Engineer at Ravelin. Ravelin delivers market-leading online fraud detection and payment acceptance solutions for online retailers. To help us meet the scaling, throughput, and latency demands of our growing roster of large-scale clients, we migrated to Google Cloud and its

Architecting Multi-region Database Disaster Recovery for MySQL
Enterprises expect extreme reliability of the database infrastructure that’s accessed by their applications. Despite your best intentions and careful engineering, database errors happen, whether that’s machine crashes or network partitioning. Good planning can help you stay ahead of problems and recover more quickly when issues do occur. This blog shows one approach
