





How a Mid-Sized Firm is Shrinking Inventory Carryovers 50% with AI

7449
Of your peers have already read this article.
5:30 Minutes
The most insightful time you'll spend today!
For more than 10 years, NMK Textile Mills has manufactured bed linens for major retailers in the United States and Canada. As e-commerce exploded, the company’s co-founder saw an opportunity to grow the business. So, in addition to manufacturing bed linens wholesale for retail customers, NMK Textile Mills reworked its complete supply chain to manufacture products for California Design Den, which became an e-commerce retailer selling its own fashion-forward products directly to consumers online.
With California Design Den’s push into e-commerce, it became apparent the SMB company (with about 250 global employees) faced the same tough supply chain questions as large retail customers, including maintaining enough inventory to meet customer demand in a timely, efficient way.
California Design Den depended upon a myriad of systems to track its complex forecasting and reordering processes. Team members typically planned inventory manually using desktop spreadsheet software, which could lead to excess inventory. Accurately forecasting demand and supply was essential to the company’s financial success—but it was also a challenge.
A couple years ago, California Design Den partnered with Pluto7, a technology solutions provider that offers a software as a service (SaaS) called Planning In A Box. Leveraging Google Cloud Platform machine learning and artificial intelligence, Planning In A Box intelligently helps predict demand and balances it with supply.
But that was just the beginning. “Along the way, we realized that to compete with larger retailers, make quicker decisions, and move faster, we needed to go further,” says Deepak Mehrotra, Co-founder and Chief Adventurer at California Design Den.
With guidance from Pluto7, California Design Den began migrating its database to Google Cloud Platform. Using Google BigQuery, Google Compute Engine, Google Cloud SQL, and Google Cloud Storage, and experimenting with Google Cloud Vision and Google Cloud AutoML, the company is reducing inventory carryovers by more than 50%, improving the accuracy of demand planning quarter over quarter, and gaining granular insights into how individual SKUs are performing.
“We would need an army of data scientists to make faster decisions on pricing and inventory levels. With Google Cloud Platform machine learning and artificial intelligence, we don’t need that. We can make much faster pricing decisions to optimize profitability and move inventory.”
—Deepak Mehrotra, Co-founder and Chief Adventurer, California Design Den
No need for army of data scientists
“Using Google Cloud Platform machine learning and AI was essential for California Design Den if it was to compete successfully with larger retailers,” Deepak says.
For example, tastes and fashions in bed linens can change quickly and consumer prices fluctuate. With more than 2,500 SKUs, it wasn’t possible for California Design Den’s team to continuously monitor product demand and experiment with competitive pricing in real time.
“We would need an army of data scientists to make faster decisions on pricing and inventory levels,” says Deepak. “With Google Cloud Platform machine learning and artificial intelligence, we don’t need that. We can make much faster pricing decisions to optimize profitability and move inventory.”
By integrating all its data onto Google Cloud Platform, California Design Den’s team gains deeper insights into product sales over time, which in turn helps the company improve demand planning by better determining which styles to manufacture and sell in the future.
“When experienced employees leave, their knowledge leaves with them. By having all data in one place, and with machine learning and AI, California Design Den can go back in its history, look at products made or sold years ago, and analyze product performance.”
—Deepak Mehrotra, Co-founder and Chief Adventurer, California Design Den
Merging visuals with data
Before Google Cloud Platform, team members had to dig through spreadsheets and run scenarios to get a sense of how particular products had sold. The next step was to perform keyword searches across the company’s photo library in the cloud to find each product’s image. From there, a team member would insert the product images into a presentation, along with relevant data points, to provide a report for stakeholders on how particular styles performed.
Today, California Design Den, with the help of Pluto7, is integrating its entire product image library with its database on Google Cloud Platform. Experimenting with Google Cloud Vision and Google Cloud AutoML, California Design Den is moving towards a day when team members can run sales scenarios and get deep background data on individual product performance while viewing images of the relevant products.
Merging product visuals with data will help designers and team members better understand sales patterns over time and in context. In the past, making correlations between things like which sheet colors sold well in California, compared to how the same sheet colors performed on the East Coast, was something that California Design Den employees primarily did in their heads.
“When experienced employees leave, their knowledge goes with them,” says Manjunath Devadas, Founder and CEO at Pluto7. “By having all data in one place, and with machine learning and AI, California Design Den can go back in its history, look at products made or sold years ago, and analyze product performance.”
“We are literally growing the complexity of our business on all levels, including designing, manufacturing, selling, reordering, inventory holding—everything.”
—Deepak Mehrotra, Co-founder and Chief Adventurer, California Design Den
Reimagining supply-demand balancing
Pluto7’s mission statement is to democratize supply demand balancing with machine learning and AI. California Design Den is a case in point, as the combination of Planning In A Box and Google Cloud Platform gives the company greater control over its destiny.
“Big retailers used to tell us what to manufacture and how much they would pay for it,” says Deepak. “That was our primary business, and if we didn’t accept the terms, a competitor would.” Today, in addition to continuing to make products for retailers, California Design Den can design, make, and sell a variety of designs for itself, including custom and limited-edition products, thanks to Google Cloud Platform and Pluto7 software offerings. The payoff is not only in having a more diversified business. California Design Den also receives more favorable profit margins by selling its own products.
“We are literally growing the complexity of our business on all levels, including designing, manufacturing, selling, reordering, inventory holding—everything,” Deepak says. “We can make smaller batches. We can connect directly with consumers. We can identify the missing pieces—what should we produce next, when, and how much? We otherwise couldn’t afford the level of talent it would take to do this.”
Cutting through the noise
Google and Pluto7 software helped California Design Den reduce inventory carryovers by more than 50%. Inventory tracking and distribution, along with insights and visibility into product sales, are faster, more efficient, and accurate. Google Cloud Platform flexible pricing, speed, reliability, security, and scalability enable California Design Den to stay relevant and be more competitive.
In addition to benefiting from Google Cloud Platform, California Design Den relies on G Suite—also part of Google Cloud—to enhance collaboration among its global teams. Previously, the company’s email server would sometimes crash, due to the heavy load of sharing product photos and other data. “Gmail and Google Drive handle the everyday demands on the business effortlessly and reliably,” Deepak says.
“Google machine learning and AI enable us to cut through all the noise from raw data, so we can see what’s important. We can focus on analytics to guide us to success today and in the future.”
—Deepak Mehrotra, Co-founder and Chief Adventurer, California Design Den
The company is exploring additional ways to leverage Google Cloud Platform in the near future. For example, one possibility is to import customer reviews from sites where products are sold into Google BigQuery, and to use that data to perform sentiment analysis via Google Cloud Natural Language. It could provide another valuable data source to help California Design Den’s team decide where to focus future designs.
“Google machine learning and AI enable us to cut through all the noise from raw data, so we can see what’s important,” Deepak says. “We can focus on analytics to guide us to success today and in the future.”
What Swiggy and You Can Learn From This Company’s Use of ML to Engage Customers

9655
Of your peers have already read this article.
1:45 Minutes
The most insightful time you'll spend today!
The app economy has enabled a huge range of unique business models to flourish. One such model is online food ordering and delivery services, in which apps leverage geo-location data to aggregate local food choices and offer personalized options to consumers.
A leading company in this space is Just Eat. Launched in the UK in 2001 with a vision of ‘serving the world’s greatest menu. Brilliantly.’ The company has capitalized on the popularity of online food delivery and grown its presence across 12 markets.
Just Eat acts as an intermediary between take-out food outlets and hungry customers, giving local restaurants access to a broader base of potential diners, while providing consumers with an easy and secure way to order and pay for food from their favourite restaurants.
Today the company helps 27 million customers find food from more than 112,000 restaurants—everything from homemade Italian pasta, to Chinese noodle bowls, to fish-and-chips.
Data is the fuel of Just Eat’s rapid growth, but it wasn’t always looked at that way. In its early days, Just Eat struggled with the deluge of information and faced fragmentation across its systems. In fact, the company realized its legacy data vendor wasn’t capable of ingesting 90 percent of the data produced by its food platform. This was incredibly frustrating for Just Eat’s analysts and data scientists, who had to waste time cleaning up sources instead of leveraging the data to create a better user experience.
Just Eat turned to Google Cloud, and now uses machine learning (ML) to power sophisticated consumer recommendations on both its app and website. It also makes heavy use of features offered by Google Cloud Platform, including BigQuery for running analytics on its customer data set and Cloud Pub/Sub for messaging app users with relevant offers in real-time.
Having all of Just Eat’s data in one platform has translated into real value for its customers. With Google Cloud tools, Just Eat has created its own proprietary Customer Ontology framework, which today contains 5.5 billion features that better understand consumers’ behavior and food habits, and provides insights into previous visits.
Just Eat recently created an “Adventurous Index” to map its customers according to their ordering habits, enabling them to tailor their marketing and user experiences. For example, mid-adventurous customers are shown a choice of restaurants that serve their most ordered cuisine, while adventurous customers can choose from restaurants that serve a wider variety. This not only has prompted consumers to be more adventurous with their choices, but also has led to more business at a more diverse set of restaurants.
Matt Cresswell, Director of Customer Platforms at Just Eat said that Google Cloud has become integral to its product delivery: “Consumer food choice is a hugely nuanced topic. We know that individuals have their own unique journeys when they use Just Eat. We’ve sought to create a truly one-to-one relationship with every customer. The changes we’ve made to the platform mean they can access the dishes they enjoy at the touch of a fingertip, and find inspiration to discover new dishes they’ll love. We’re grateful to Google Cloud for helping us support our customers on their culinary explorations.”

4467
Of your peers have already downloaded this article
3:00 Minutes
The most insightful time you'll spend today!
Contact centers can transform customer experience using AI-driven speech analytics to evaluate every customer interaction and use it as a ‘data point’ to identify key patterns, enquiries, pain points, reviews and feedback to enhance customer experience with real-time, personalized recommendations. Knowlarity’s AI-based cloud telephony solutions for businesses built with Google Cloud takes speech analytics to another level!
Download the article to empower your contact centers with AI-powered speech analytics to make predictive analysis, reduce call handling time and volume as well as train contact center agents to provide customers with quick and real-time feedback.
How Constellation Brands’ Direct-to-Customer Tech Delivers Economic Impact across Business Portfolio

6285
Of your peers have already read this article.
3:00 Minutes
The most insightful time you'll spend today!
Editor’s note: Today we’re hearing from Ryan Mason, Director, Head of DTC Growth & Strategy, at alcoholic beverage firm, Constellation Brands on the company’s shift to Direct-to-Consumer (DTC) sales and how Google Cloud’s powerful technology stack helped with this transformation.
It’s no secret that consumer businesses have been up-ended in a lasting manner after 18 months of the pandemic. Consumers have been forced to shop differently over the past year – and as a result, they’ve evolved to be more comfortable with online spending and have grown to expect a certain level of convenience. While the e-commerce share of consumer sales has grown steadily over the past decade, the pandemic was the catalyst for the famous “10 years of growth in 3 months” which many argue is here to stay.
Facing this reality head-on, we placed a new emphasis on Direct-to-Consumer (DTC) with our acquisition of Empathy Wines, a DTC-native wine brand that sells directly to consumers via e-commerce. To accelerate our innovation in the DTC space, we added headcount and new functions to the existing Empathy team and empowered the newly-minted DTC group to apply their digital commerce operating model across the rest of the wine and spirits portfolio, which includes Robert Mondavi Winery, Meiomi Wines, The Prisoner Wine Company, High West Whiskey, and more.
One pandemic and one year later, DTC sales have surged in the wine and spirits category with Constellation positioned as a leader armed with a unique and powerful cloud technology stack, best-in-class e-commerce user experiences, modernized fulfillment solutions, and data-driven growth marketing.
Benefits of Going DTC
A report from McKinsey estimates that the strategic business shift to DTC has been accelerated by two years because of the pandemic and argues that consumer brands that want to thrive will need to aim for a 20% DTC business or higher, which is already taking shape in the market: Nike’s direct digital channels are on track to make up 21.5% of the total business by the end of 2021, up from 15.5% in the last fiscal year, and Adidas is aiming for 50% DTC by 2025. But outside of the clear revenue upside, the auxiliary benefits of going DTC are robust.
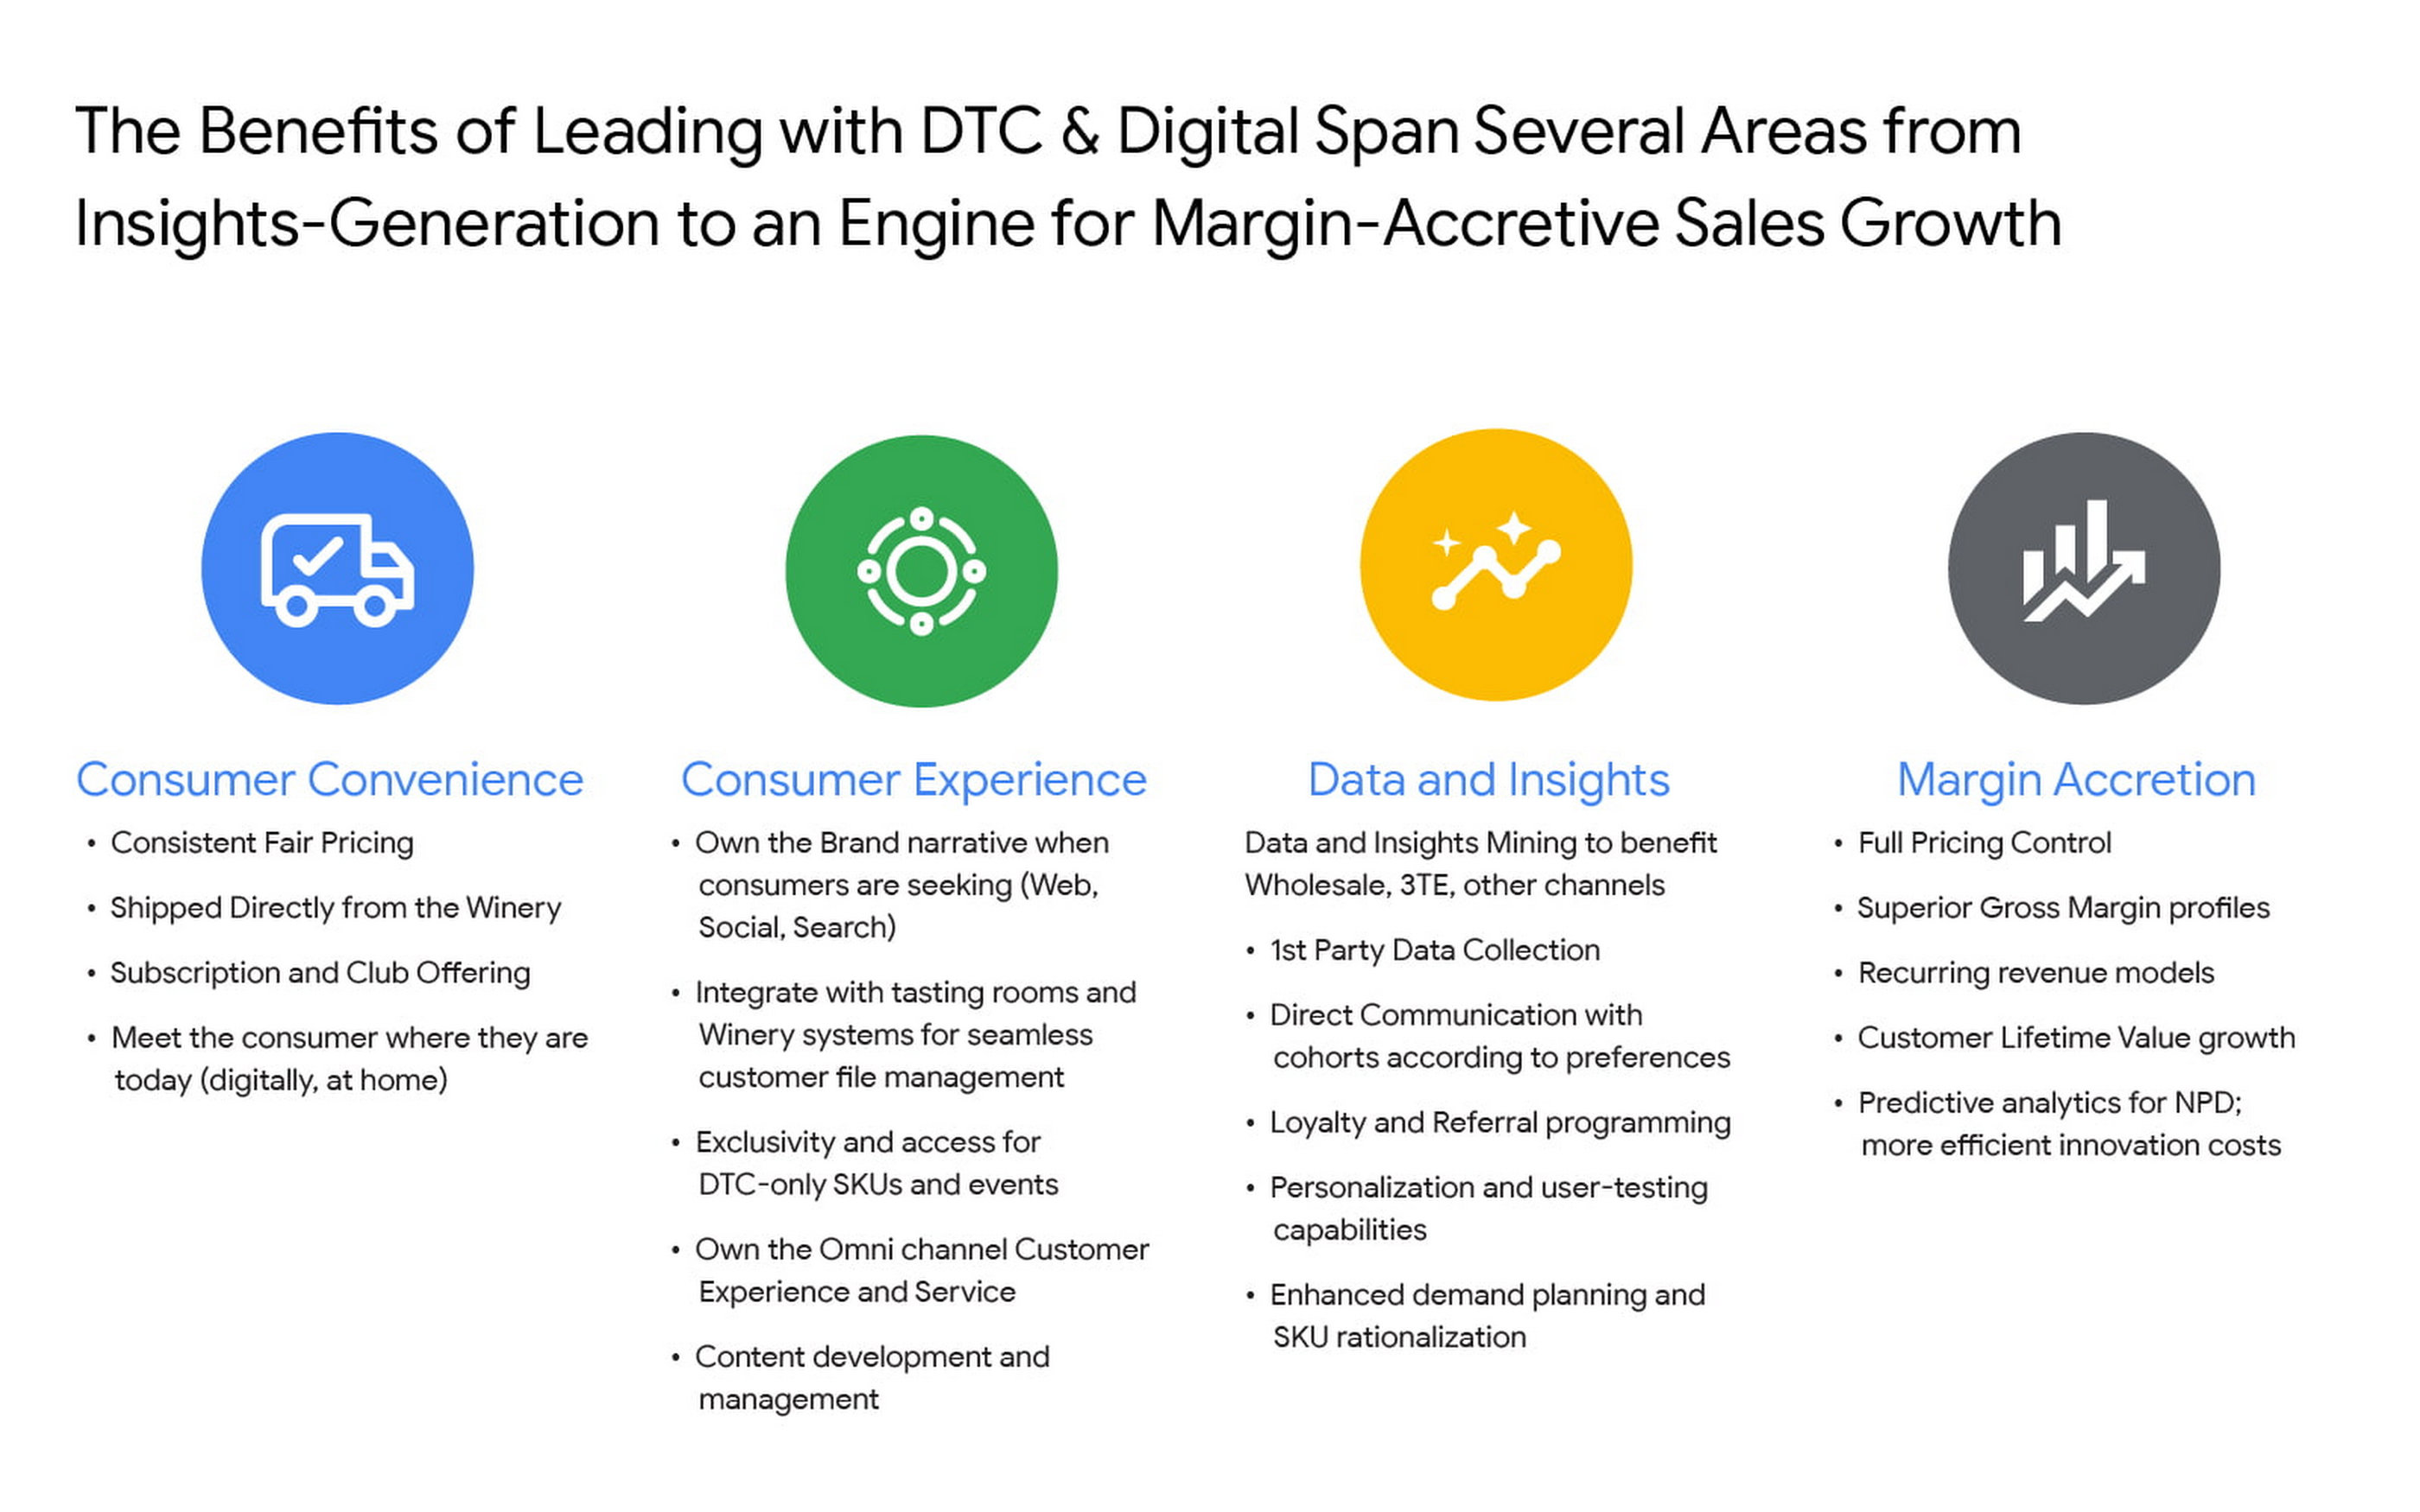
For Constellation Brands, each of these four pillars ring true, and our shift toward DTC is as much about margin accretion and revenue mix management as it is about consumer insights and data. The added complexities of the alcohol space add wrinkles to our DTC approach and manifest in many areas like consumer shopping preference, shipping and logistics hurdles, and more. In order to win share early and continue to lead the category, we recognized the need to harness the immense amount of first-party data to power impactful and actionable insights.
Our DTC technology architecture has fostered a value chain that is completely digitized: website traffic, marketing expenditures, tasting room transactions, e-commerce transactions, logistics and fulfillment events, cost of goods sold (COGS) and margin profiles, etc. are recorded and stored in a data warehouse in real time. For the first time, at any given moment, we can easily and deterministically answer complex business questions like “what is the age and gender distribution of my customers from Los Angeles who have purchased SKU X from Brand.com Y in the last 6 months? What is the cohort net promoter score? Did that increase after we introduced same-day shipping in this zip code? By how much?”
The ability to answer these questions and understand the root causes allows us to stay nimble with product offerings and iterate marketing strategies at the speed of consumer preference. Further, it enables us to optimize our omnichannel presence in the same manner by leaning on DTC consumer insights to develop valuable strategies with key wholesale distribution partners and 3-Tier eCommerce partners like Drizly and Instacart. At its core, Constellation’s DTC practice is designed to be the consumer-centric “tip-of-the-spear” responsible for generating insights from which all sales channels, including wholesale, can benefit.
Constellation’s DTC technology approach prioritizes consumer-centricity and insights generation
We have taken a modern approach to building a digital commerce technology stack, leveraging a hub-and-spoke model built around Shopify Plus and other key emergent technology providers like email provider Klaviyo, loyalty platform Yotpo, Net Promoter Score measurer Delighted, Customer Service module Gorgias, payments processor Stripe, event reservations platform Tock, and many more. For digital marketing and analytics, we use Google Cloud and Google Marketing Platform, which includes products like Analytics 360, Tag Manager 360, and Search Ads 360.
To help gather, organize, and store all of the inbound data from the ecosystem, we partnered with SoundCommerce, a data processing platform for eCommerce businesses. Together with SoundCommerce, we are able to automate data ingestion from all endpoints into a central data warehouse in Google BigQuery. With BigQuery, our data team is able to break data silos and quickly analyze large volumes of data that help unlock actionable insights about our business. BigQuery itself allows for out-of-the-box predictive analytics using SQL via BigQuery ML, and a key differentiator for us is that all Google Marketing Platform data is natively accessible for analysis within BigQuery.
But data possession only addresses half of the opportunity: we needed a powerful and modern business intelligence platform to help make sense of the vast amounts of data flowing into the system. Core to the search was to find a partner that approached BI in a way that fit with our future-looking strategy.
Our DTC team relies on the accurate measurement of variable metrics like Customer Acquisition Cost (CAC), Customer Lifetime Value (CLV), Churn, and Net Promoter Score (NPS) as a bellwether of the health of the business and monitoring these figures on a daily basis is paramount to success. To enable us to keep an accurate pulse on strategic KPIs, we considered several incumbent BI platforms. Ultimately we selected Google Cloud’s Looker for a range of benefits that separated it from the rest of the pack.

From a vision perspective, in this particular case we felt Looker was most aligned with our belief that better decisions are made when everyone has access to accurate, up-to-date information. Looker allows us to realize that vision by surfacing data in a simple web-based interface that empowers everyone to take action with real-time data on critical commercial activities. Furthermore, Looker’s ability to automate and distribute formatted modules to a myriad of stakeholders on a regular cadence increases data literacy and business performance transparency.
From a product perspective, we chose Looker for it’s cloud offering, web-based interface, and centralized, agile modeling layer that creates a trusted environment for all users to confidently interact with data — without any actual data extraction. While other BI tools have centralized semantic layers that require skilled IT resources, we’ve experienced that those can lead to bottlenecks and limited agility. With Looker’s semantic layer, LookML, our BI Team, led by Peter Donald, can easily build upon their SQL knowledge to add both a high degree of control as well as flexibility to our data model. The fully browser-based development environment allows the data team to rapidly develop, test, and deploy code and is backed by robust and seamless Git source code management.
In parallel, LookML empowers business users to collaborate without the need for advanced SQL knowledge. Our data team curates interactive data experiences with Looker to help scale access and adoption. Business users can explore ad hoc analysis, create dashboards, and develop custom data experiences in the web-based environment to get the answers they need without relying on IT resources each time they have a new question, while also maintaining the confidence that the underlying data will always be accurate. This helps us meet our primary goal of providing all businesses users with the data access they need to monitor the pulse of key metrics in near real-time.
Impact and future of DTC BI at Constellation
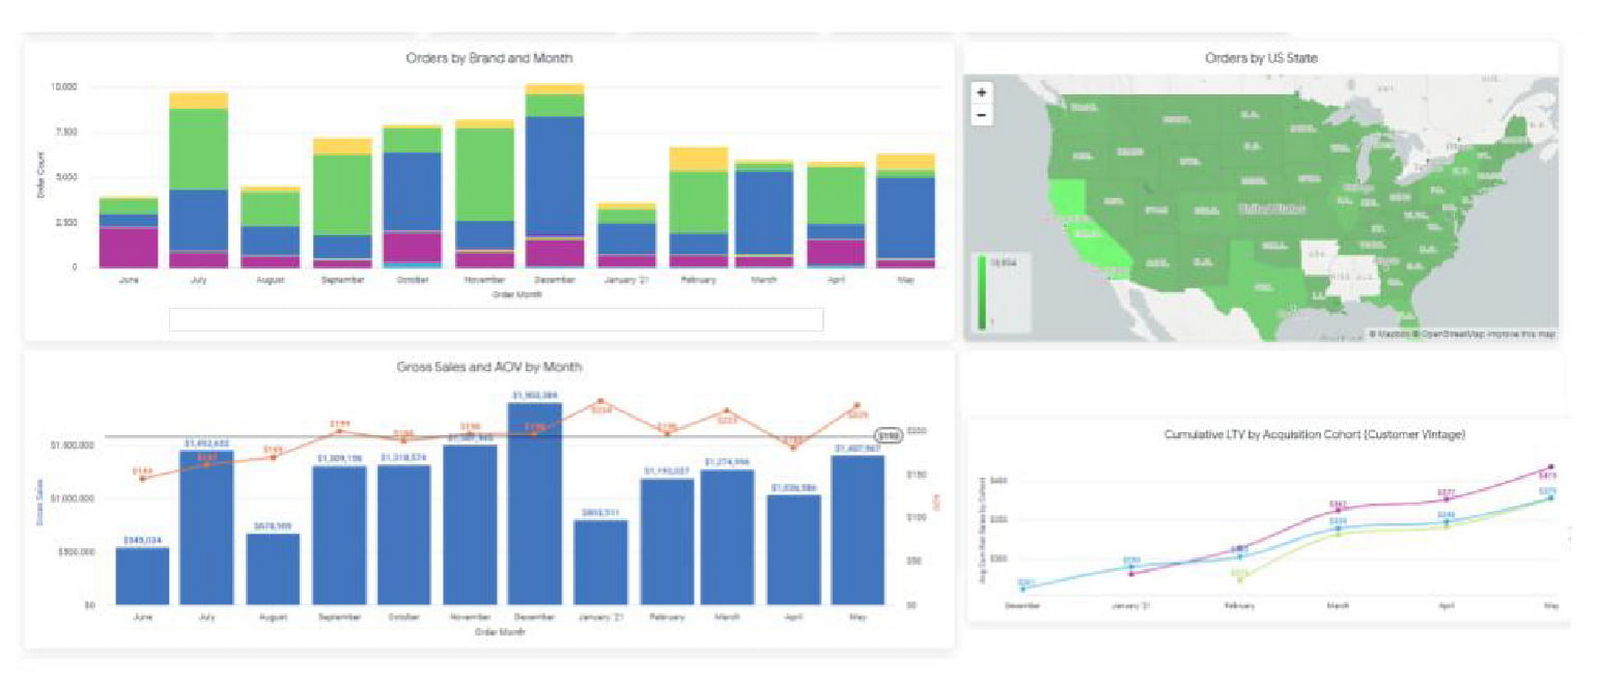
In short order, taking a modern and integrated approach to the DTC technology stack has delivered economic impact across the portfolio, helping our team understand and combat customer churn, increase conversion rates, and optimize the customer acquisition cost (CAC) and customer lifetime value (CLV) ratios. Perhaps most important is the benefit it can provide to the customer base. Mining customer data and consumer behavior generates data into what our customers are seeking, giving us insights to supply more, or less of it. For example, observing sales velocity and conversion rates by SKU or by region can help us better understand changes in customer taste profiles and fluctuations in demand, providing the foundation for a more powerful innovation pipeline and more effective sales and distribution tactics in wholesale. Our team has also been an early pilot tester for Looker’s new integration with Customer Match, which contributes to the virtuous cycle between data insight and data activation. In the future, our plan is to leverage this cycle to amplify the impact of Google Ads across Search, Shopping, and YouTube placements for the wine and spirits portfolio.
The operational impact of Looker is also substantial: our team estimates that the number of hours needed to reach critical business decisions has been reduced by nearly 60%, boosting productivity and accelerating the daily operating rhythm. A thoughtfully curated technology stack together with a modern BI solution allows us to stay at the vanguard of the industry. While the DTC sales channel is not designed to surpass the core business of wholesale for Constellation in terms of size, the approach enables unparalleled insights and measurement abilities that will pay dividends for the entire business for years to come.
Google Cloud Helps Northwell Health to Boost Caregiver Productivity and Access to Right Care Using AI

7968
Of your peers have already read this article.
2:00 Minutes
The most insightful time you'll spend today!
Lung cancer is the leading cause of cancer death in the United States and like any cancer, early detection is crucial to survival. Screening at-risk populations is an important part of reducing mortality, and if concerning nodules are found on imaging, further testing may be required. Today, we’ll share how Northwell Health uses Google Cloud products such as Cloud Healthcare APIs and BigQuery to increase caregiver productivity and deliver better care for patients with findings that indicate potential development of lung cancer.
Northwell is New York’s largest healthcare provider
Northwell Health is New York’s largest healthcare provider with 23 hospitals and nearly 800 outpatient facilities. Northwell’s nearly 4,000 doctors care for millions of patients each year, and at this scale, there is an immense amount of healthcare data to manage. To better manage and leverage this data, Northwell Health partnered with Google Cloud starting in 2018.
Enabling caregivers to spend more time with patients
Nic Lorenzen, the lead developer of Northwell Emerging Technology and Innovation team, has a mission to put together data for caregivers in a way that makes sense. It is no secret that inefficient electronic health records systems have a negative impact on a physician’s ability to deliver quality care. Traditional EHRs have information distributed across many tabs, which forces caregivers to spend considerable time at the computer trying to find information. Moreover, speed of care matters. If care is delayed, patients may have to spend more time in the hospital and may suffer worse health outcomes.
To solve this problem, Nic’s team focused on giving caregivers the most relevant pieces of data at the right time by developing an intelligent clinician rounding app. The data needed to derive these insights can depend on the caregiver’s role–a nurse cares about different things than a cardiologist. This system aggregates multiple data sources, and provides patient-specific insights to caregivers.
This system would not have been possible before with traditional EHRs and data warehouses that have proprietary data models and rarely sync data in real time. Now with data easily accessible through Google Cloud’s Healthcare solutions, Nic’s team can deliver the right clinical information to the right people instantly. These days, Nic says, “instead of spending 75% of our time dealing with architecting the underlying platforms, we spend 75% of our time focused on higher value use cases for clinicians and patients. Google Cloud’s Healthcare solutions have greatly improved our developer productivity and time to value.”
Caregivers have found this new system to be a game changer.Before the implementation of this system, caregivers would spend, on average, seven to nine minutes finding the data needed to make medical decisions for one patient. Now, that aggregated information is delivered to a caregiver’s mobile device in less than a second.
Ensuring patients get the right care with the power of AI
There are a number of reasons why patients might not get the care that they need. For example, patients today can go to multiple hospitals and clinics settings, and coordinating care across multiple facilities is complex. Regional hospitals and clinics have their own siloed view of their data, so pertinent information gathered by one clinic might not be seen by another. These gaps in clinical data lead to gaps in patient care.
When a patient gets radiologic imaging, they may have findings unrelated to the reason they initially got the imaging. For example, a chest CT for a car accident might reveal an incidental lung nodule that could be cancerous. Unfortunately, research shows that a large portion of patients do not get follow up for these incidental findings because it isn’t the primary reason why the patient is seeing a doctor. Moreover, social determinants of health are a factor that affects which patients receive follow-up care. Identifying these patients and providing the necessary follow up care prevents adverse events related to delayed detection of cancer.

With Cloud Healthcare solutions, Northwell built an AI model to identify these patients so that oncologists can appropriately follow up with patients who have findings suspicious for lung cancer. The AI model detects incidental pulmonary nodules in radiology reports so that doctors can then contact the patients that need follow-up care. Nic says his team was able to build this system in a week: “Google Cloud did a lot of heavy-lifting for us and allowed us to get to the AI applications much faster. It allowed us to build a platform that just works.”
Healthcare systems can now rapidly generate healthcare insights with one end-to-end solution, Google Cloud Healthcare Data Engine. It builds on and extends the core capabilities of the Google Cloud Healthcare API to make healthcare data more immediately useful by enabling an interoperable, longitudinal record of patient data. Northwell Health uses Google Cloud as the core of their platform, enabling their developers to create solutions to the most pressing healthcare problems.
Special thanks to Kalyan Pamarthy, Product Management Lead on Cloud Healthcare and Natural Language APIs for contributing to this blog post.
Data to Business Outcomes with Google’s Data Analytics Design Pattern

6740
Of your peers have already read this article.
1:30 Minutes
The most insightful time you'll spend today!
Companies today are inundated with vast amounts of data from various sources. This overwhelming amount of data is meant to benefit the company, but often leaves data teams feeling overwhelmed, which can create data bottlenecks and result in a slow time to value. In fact, only twenty seven percent of companies agree that data and analytics projects produce insights and recommendations that are highly actionable (Accenture). This means that nearly 3 in 4 companies are not unlocking value in their data, which poses a huge challenge for organizations trying to move the needle and drive real business results. We at Google Cloud, however, saw opportunity in this challenge, which is why we created Data Analytics Design Patterns: cross-product technical solutions designed to accelerate a customer’s path to value realization with their data. These industry solutions bring together product capabilities alongside design methodology, open source deployable code, data models, and reference architectures to accelerate your business outcomes.

With Data Analytics Design Patterns, you get access to more than 30 ready-to-deploy data analytics solutions. Design patterns leverage the best of Google and our rich partner ecosystem, including Technology Partners & System Integrators. In this blog, we will cover 3 examples on how a design pattern can be applied to unlock the value of data:
- Improve mobile app experience with Unified App Analytics
- Maximize digital shop’s revenue with Price Optimization
- Protect internal systems from security and malware threat with Anomaly Detection
Unified App Analytics
If mobile apps are part of your go-to-market strategy, you have several data sources that can provide invaluable customer insights. In addition to tools such as CRM (e.g. Salesforce) and customer care (e.g. Zendesk), you likely use Google Analytics to log app events and Firebase Crashlytics to gather data about app errors. But can you easily combine back-end server data with app front-end data to unlock customer insights?
The Unified App Analytics design pattern makes it easy to plug all the disparate data sources into a single warehouse (BigQuery) and start analyzing it with a Business Intelligence tool (Looker). Once you have a complete and real time view of your customer experience with your app, you can take action. For example, if you notice an increase in app errors, you can quickly combine your Crashlytics data with your CRM data to narrow down the crashes with the highest revenue impact and prioritize their resolution. Further, you can automate your issue resolution workflow by creating a rule for any future crash that impacts a subset of VIP customers.

With the Unified App Analytics design pattern, you’ll gain access to valuable insights about your user experience with your app so you can inform your future app strategy. For example, NPR, an American media company, increased user engagement by showing content that better mapped to listener interests and behaviors.
Price Optimization
In a competitive and hectic global marketplace, strategic pricing matters more than ever, but often projects are consumed by the tedium of standardizing, cleaning, and preparing data—from transactions, inventory, demand, among other sources.
Price Optimization solution allows retailers to build a data driven pricing model. The solution consists of three main components:
- Dataprep by Trifacta: integrates different data sources into a single Common Data Model (CDM). Dataprep is an intelligent data service for visually exploring, cleaning, and preparing structured and unstructured data for analysis, reporting, and machine learning.
- BigQuery: allows you to create and store pricing models in a consistent and scalable way as a serverless Cloud Data Warehouse service
- Looker dashboards: surface insights and enable business teams to take action with enterprise ready BI platform
With the Price Optimization design pattern from Google Cloud and our partner Trifacta, you’ll be able to rapidly unify multiple data sources and create a real-time and ML-powered analysis, leveraging predictive models to estimate future sales. For example, PDPAOLA, an online jewelry company, doubled sales with dynamic pricing adjustments enabled by a single data view.

Anomaly Detection
Organizations need to anticipate and act on risks and opportunities to stay competitive in a digitally transforming society. Anomaly detection helps organizations identify and respond to data points and data trends in high velocity, high volume data sets that deviate from historical standards and expected behaviors, allowing them to take action on changing user needs, mitigate malicious actors and behaviors, and prevent unnecessary costs and monetary losses.
The Anomaly Detection design pattern uses Google Pub/Sub, BigQuery, Dataflow, and Looker to:
- Stream events in real time
- Process the events, extract useful data points, train the detection algorithm of choice
- Apply the detection algorithm in near-real time to the events to detect anomalies
- Update dashboards and/or send alerts
The challenge of finding the important insights and anomalies in vast amounts of data applies to organizations across all industries and lines of business, but is especially important to protecting the security of an organization. For example, TELUS, a national communications company, modernized their security analytics platform leveraging this pattern, allowing them to detect anomalies in near real time to detect and mitigate suspicious activity.
Get started
Turn your data into business outcomes with Google Cloud and our broad partner ecosystem by deploying Data Analytics Design Patterns at your organization. There are more than 30 Data Analytics Design Patterns ready for you to use. We have more than 200+ more ideas in the pipeline, so be sure to check in regularly as new patterns will be added soon.
To dive deeper and find out more about how Data Analytics Design Patterns can help your organization accelerate use cases and create faster time to value, check out this video.
More Relevant Stories for Your Company

Wayfair Writes its Success Story with BigQuery for Internal Analytics
Editor’s note: Home-goods and furniture giant Wayfair first partnered up with Google Cloud to transform and scale its storefront—work that proved its value many times over during the unprecedented surge in ecommerce traffic during 2020. Today, we hear how BigQuery’s performance and cost optimization have transformed the company’s internal analytics



Scaling Data-Driven Insights Across a Complex Global Organization with Looker and BigQuery
In this video, SpringML and Iron Mountain share how migrating data to Google Cloud not only saved hundreds of thousands of dollars in licensing consolidation but allows stakeholders across a complex global organization to: Consolidate 1,200 data management applications into one data lakeUnify information governance practices across disparate corporate verticals

How Vertex AI NAS is Suitable for Most Advanced ML Workloads
Vertex AI launched with the premise “one AI platform, every ML tool you need.” Let’s talk about how Vertex AI streamlines modeling universally for a broad range of use cases. The overall purpose of Vertex AI is to simplify modeling so that enterprises can fast track their innovation, accelerate time to market,

BigQuery Helps Insurance Firms Leverage Previous Storm Data for Better Pricing Insights
It may be surprising to know that U.S. natural catastrophe economic losses totaled $119 billion in 2020, and 75% (or $89.4B) of those economic losses were caused by severe storms and cyclones. In the insurance industry, data is everything. Insurers use data to influence underwriting, rating, pricing, forms, marketing, and
