





Wayfair Writes its Success Story with BigQuery for Internal Analytics

4936
Of your peers have already read this article.
4:00 Minutes
The most insightful time you'll spend today!
Editor’s note: Home-goods and furniture giant Wayfair first partnered up with Google Cloud to transform and scale its storefront—work that proved its value many times over during the unprecedented surge in ecommerce traffic during 2020. Today, we hear how BigQuery’s performance and cost optimization have transformed the company’s internal analytics to create an environment of “yes”.
At Wayfair, we have several unique challenges relating to the scale of our product catalog, our global delivery network, and our position in a multi-sided marketplace that supports both our customers and suppliers. To give you a sense of our scale we have a team of more than 3,000 engineers with tens of millions of customers. We supply more than 20 Million items using more than 16,000 supplier partners.
Serving those constituents generates a lot of analytics work. Wayfair runs over a billion ‘analytic’ database queries a year, from both humans and systems, against multi-petabyte datasets. Scaling our previous environment to meet these challenges required us to maintain dozens of copies of data for different use cases and manage complex data synchronization routines to move trillions of records each day, resulting in long development times and high support costs for our analytics projects.
Centralizing our data using Cloud Storage and BigQuery enabled us to break down existing silos and build unified pipelines for our batch and real-time operations. BigQuery shines by letting us decouple our compute and storage resources and flexibly ingest structured data in streaming and batch modes. We also benefit from the same decoupling for more complicated machine learning (ML) workflows in Dataproc and Cloud Storage. In particular, BigQuery is extremely low maintenance. From ML and easy data integrations to the integrated query cache, many out-of-the-box features have proven valuable for multiple use cases.
Beyond storage and compute, Google Cloud offers multiple tools to maximize the value of our data. For example, we can easily connect Data Studio to BigQuery for lightning-fast dashboarding of enterprise KPI reporting. When we need to dive deeper into a metric, Looker provides an interface and semantic model that empowers more business users to answer important questions — without understanding SQL or our vast dataset and table structure.
The combination of all of Google Cloud’s tools enables every Wayfairian the opportunity to self-serve their data visualization and analysis needs. We are able to support all of the requirements of our internal and external users, from descriptive analytics to alerting and ML, in a platform that blends Google’s proprietary technology with open-source standards.we have seen a greater than 90% reduction in the number of analytic queries in production that take more than one minute to run
As a result, we have seen a greater than 90% reduction in the number of analytic queries in production that take more than one minute to run, which delights our users and increases adoption of our analytics tools across the business.
Higher performance means saying “Yes” more often
We went into the BigQuery experience expecting very strong performance on large, aggregate queries and excellent scalability — the kind of performance that could enable consistent 5-15 minute processing queries and 5-10 second response times for large analytics queries.
We weren’t disappointed — we saw slightly better than linear performance profiles as record counts went up from millions to trillions for a flat resource allocation. BigQuery had the expected high performance for aggregate queries. This made our large data processing pipelines predictable and straightforward to maintain and optimize.
Below is a plot of gigabytes processed by a query against query run time in seconds; outliers are filtered and the axes are pruned to ranges where we had a large sample size. This focuses on longer-duration queries. As an example of the linear performance, a 2 terabyte query averages 5 minutes — 2.5min/terabyte — and an 18 terabyte query (9 times as much data) averages 25s — only 1.4min/terabyte. This is despite the fact that complex queries [sorting and analytic functions are particularly problematic] are more common with large data sizes. We do see increasing variability at large sizes as slot limits and other resource constraints come into play, but these factors are controllable and ultimately a business optimization decision.
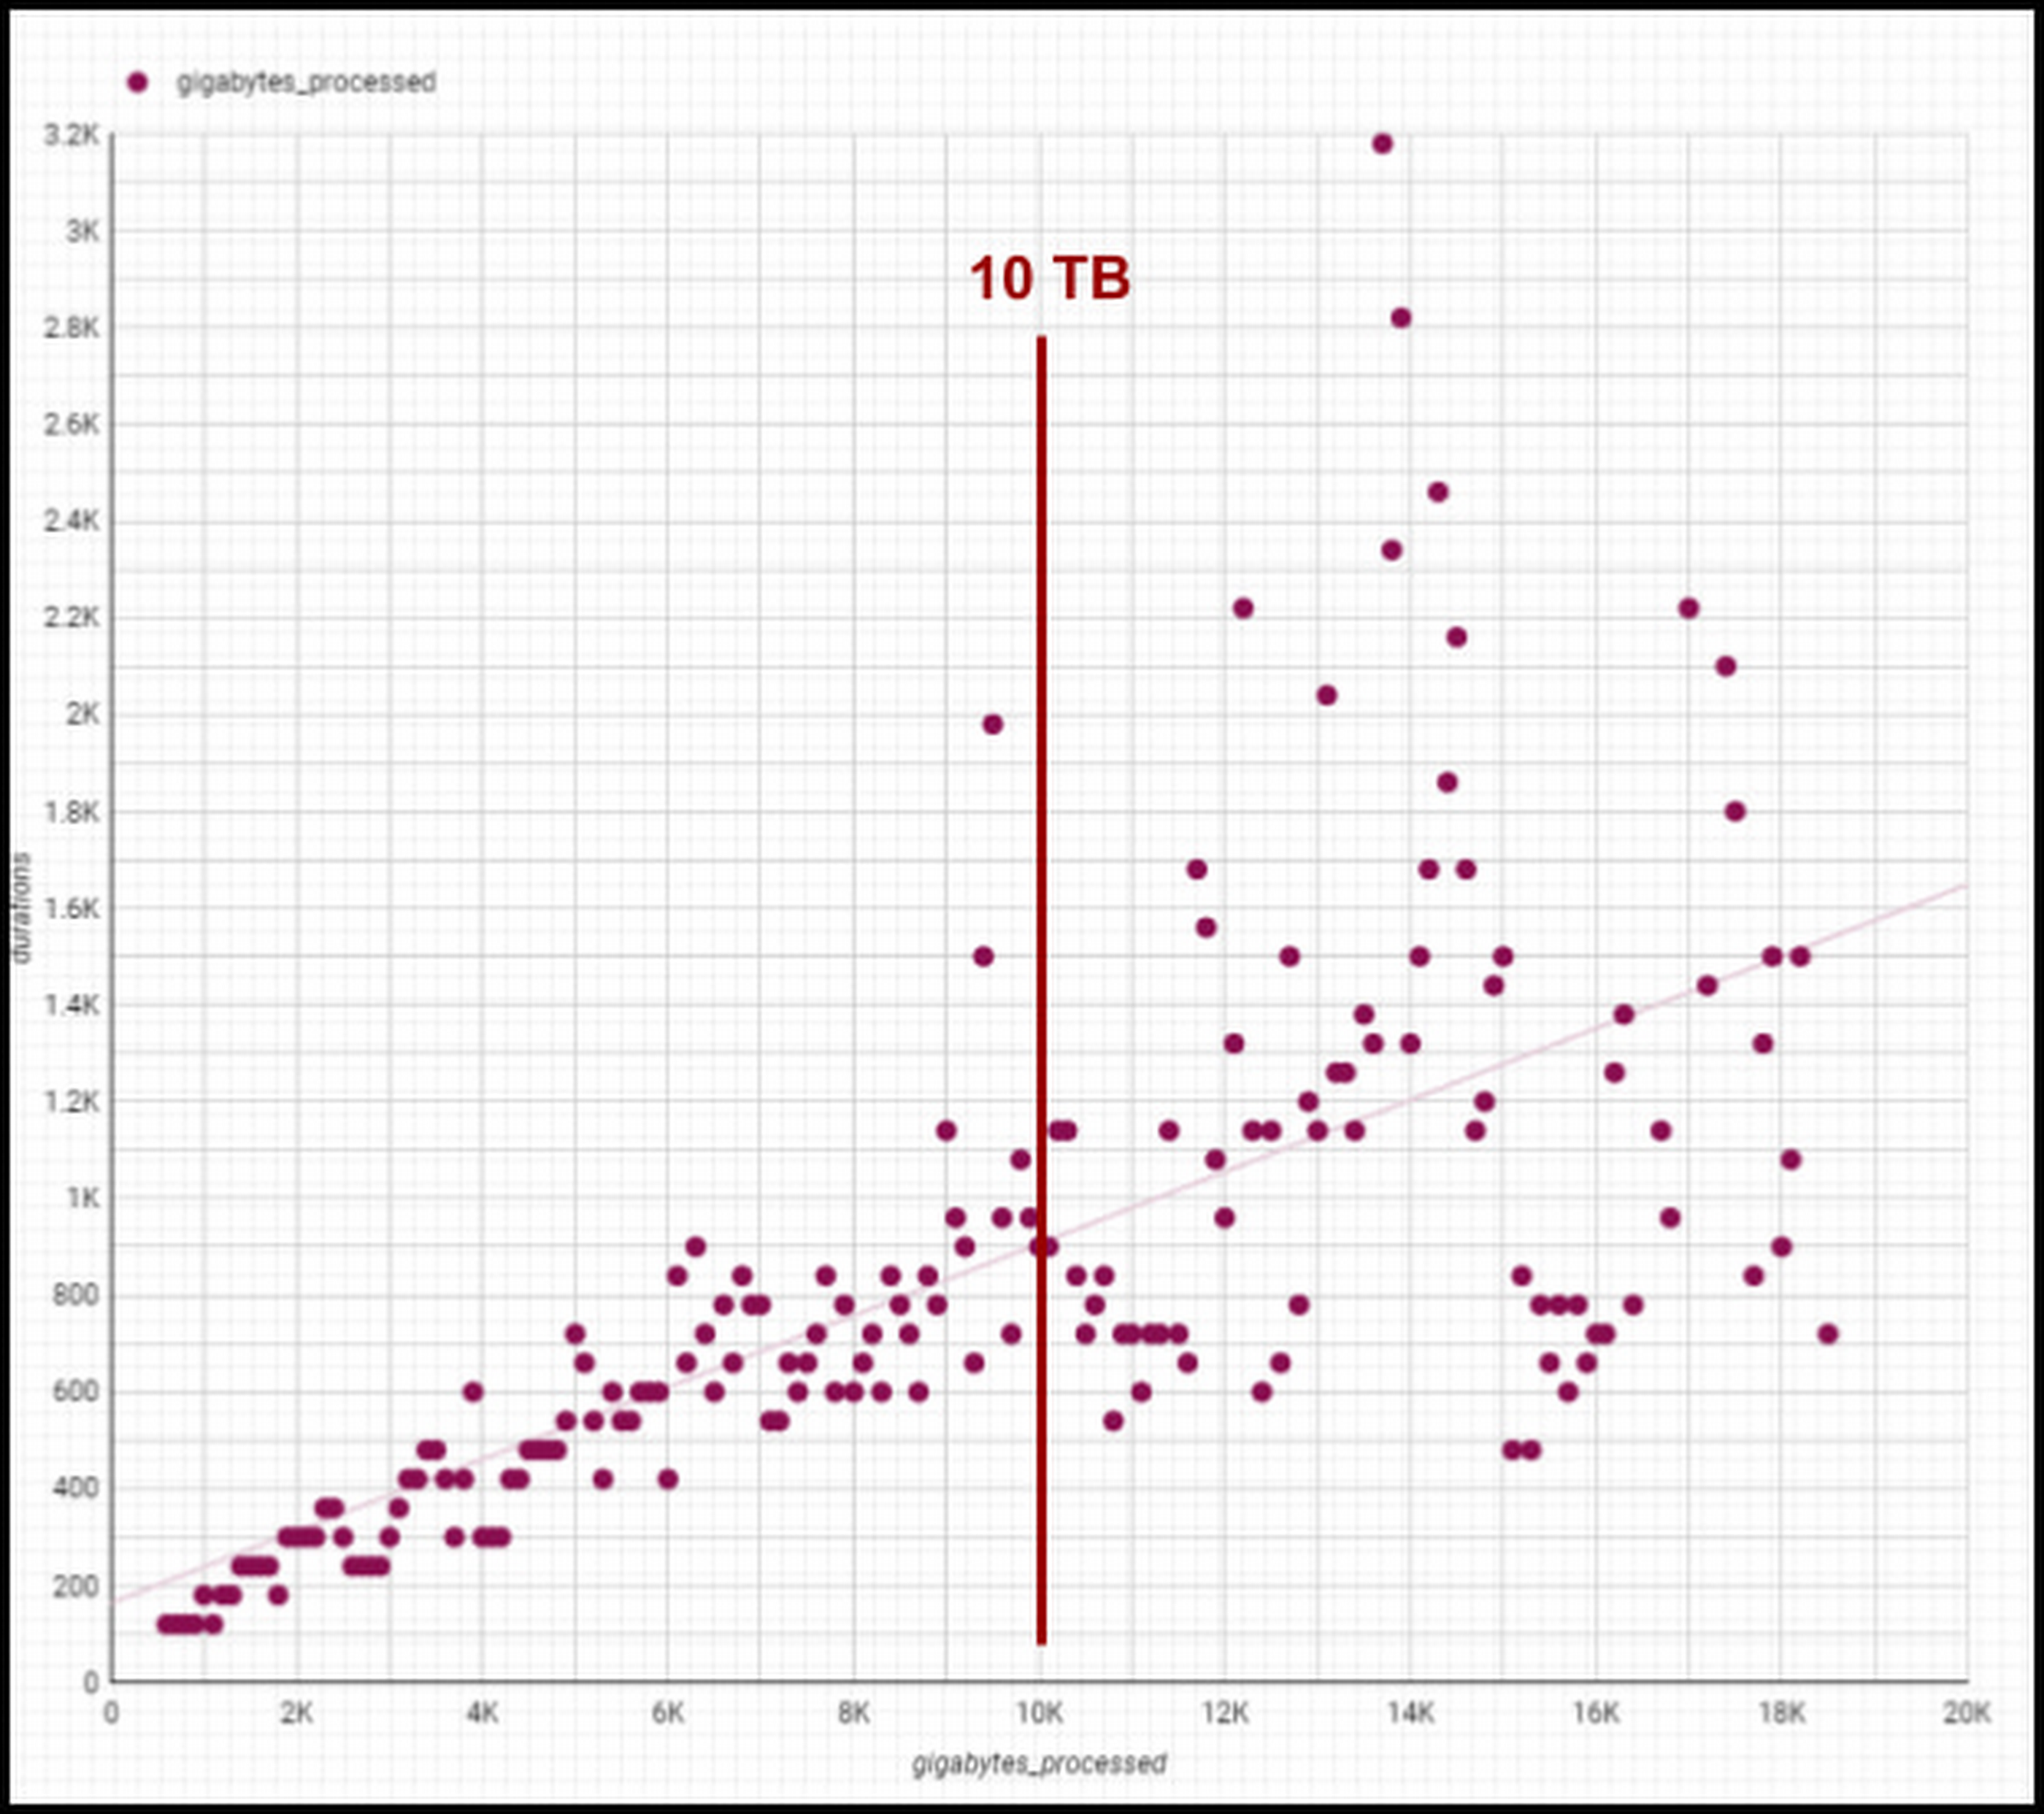
Though individual values vary greatly depending on query complexity [analytic functions/sorting can be computationally expensive], the overall trend line is below 1-1 for bytes versus duration, meaning our BigQuery query runtimes are increasing slower than our data volumes. We are still seeing sub 1:1 threshold runtimes, and we’re already at 100 PB of total data with single queries running on 50PB or more. Going strong!
One unexpected and pleasant surprise has been high performance for smaller queries, such as those required for development, interactive analytics, and internal applications we use for forecasting, segmentation, and other latency-sensitive data workflows. BigQuery’s resource management systems have provided smoother degradation and parallelism profiles than we initially expected for a multi-tenant platform.
We regularly see sub-second p50 query performance for interactive use cases, with p90 performance coming in under 10 seconds for Looker, Data Studio, and AtScale — meeting the threshold we set to avoid analysts losing focus during a business investigation. The chart below shows p50, p90, and p95 timing for core workloads, as well as the number of queries in each bucket and the number of unique users. [Looker and Atscale will use small numbers of service accounts for a large number of users].

This has enabled two important shifts in the way our customers experience analytics services:
- Delivering better user productivity. People no longer have long wait times to get results for a basic query delivering an improved overall user experience.
- Scaling our data transformation. BigQuery has proven, effective data transformation that allows us to embrace the industry shift away towards ELT (extract, load, transform) to transform raw data right within the database.
We no longer have to ask ourselves, “Can we meet the SLA for this data processing task?” The new conversation is, “Of course, we can meet it. What’s the associated cost based on how many resources we assign?” We can make cost and resource trade-offs clear to our users and say “yes” more often to requirements that have measurable business value.
Supporting cost vs. performance decisions
Democratized access to internal analytics is a powerful decision-making tool. With BigQuery’s robust tooling, the decision about how to best allocate computational resources is in the hands of the analytics groups closest to the business decision being made. If they want to spend a sprint optimizing a dashboard, they can show exactly how much money it will save. If they choose not to optimize a report, they can offset the decision with concrete cost savings and other realized value.
Wayfair teams also benefit from visibility into their committed costs by abstracting away the details of the underlying services, including BigQuery slots, the virtual CPUs used to execute SQL queries.
Take a look at this example view consumed by our teams (the metrics for these dashboards are from the BigQuery INFORMATION_SCHEMA (jobs and reservations tables):
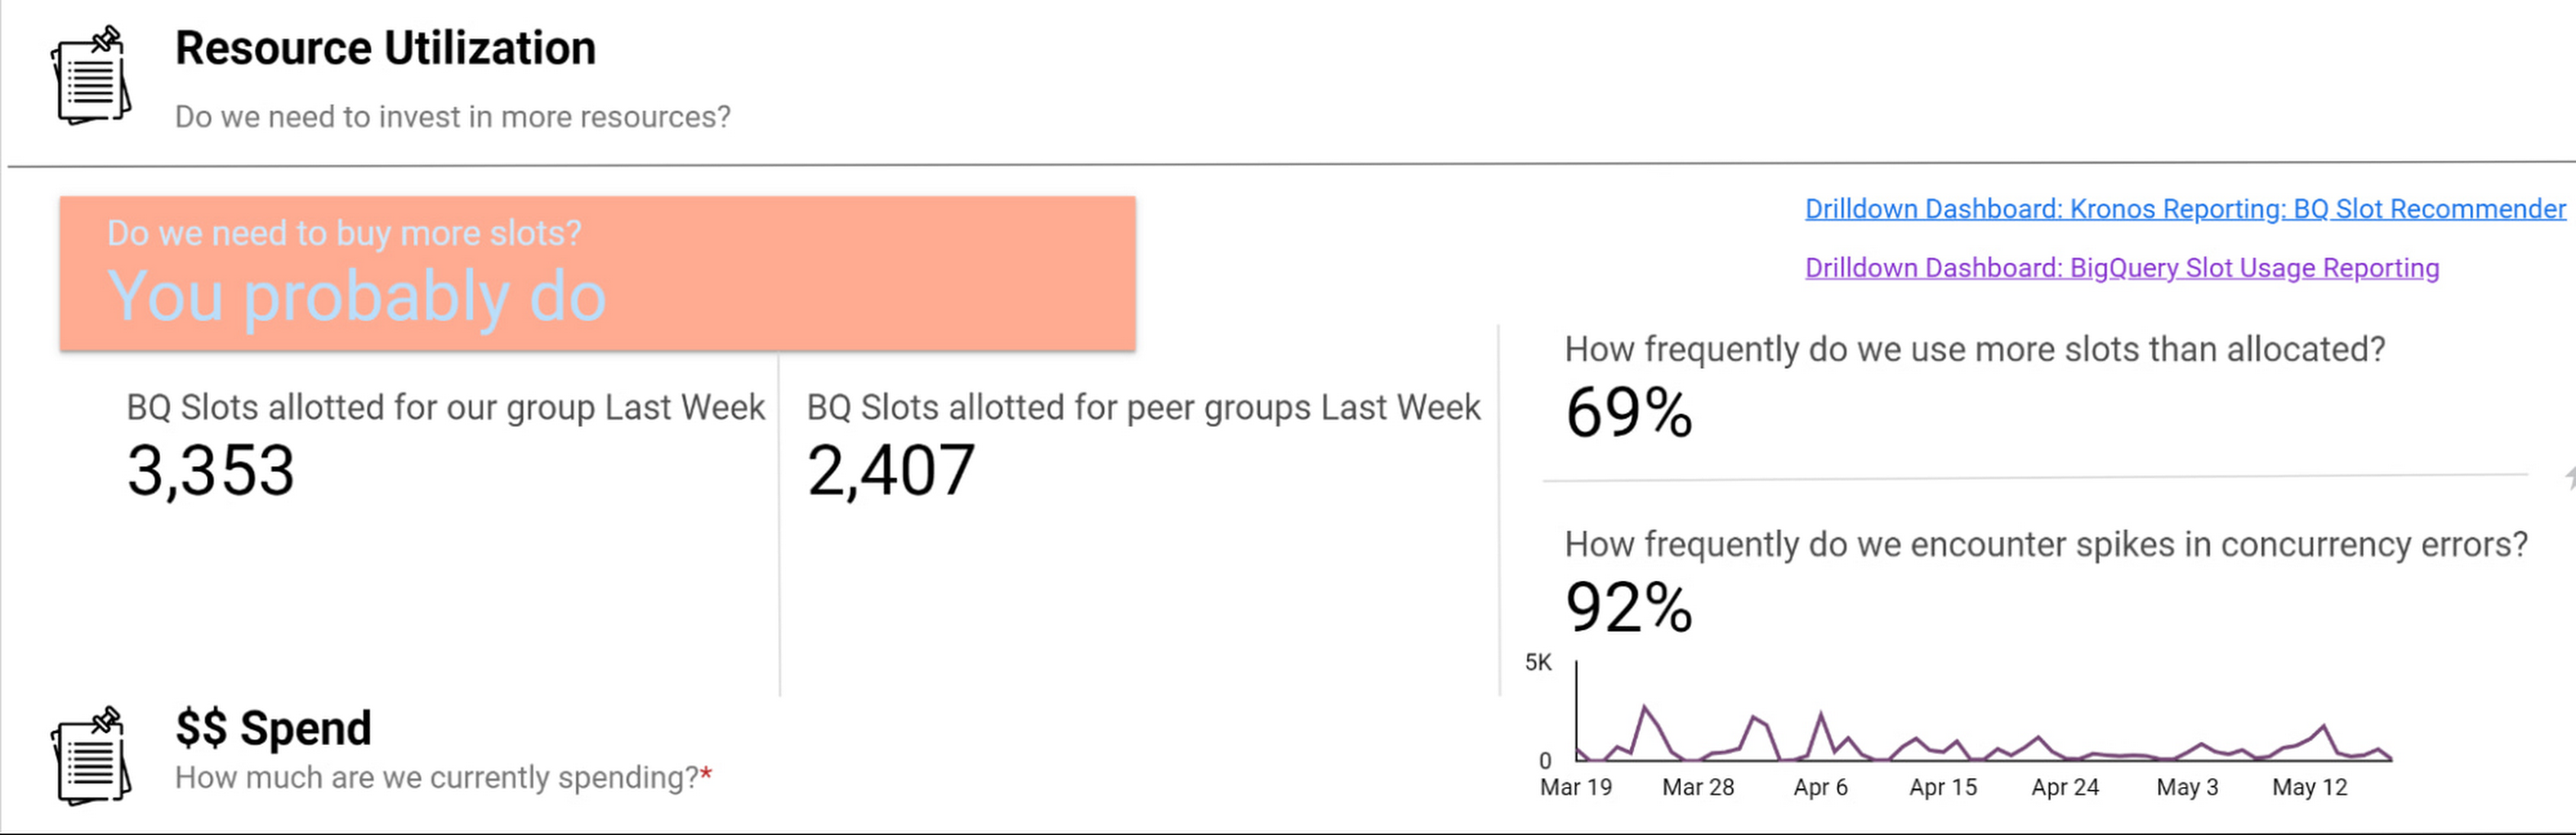
Suppose an organization wants to purchase capacity for a period of time. In that case, we provide an average cost for a slot during that time and charge them based on their slot usage for queries, multiplied by the average price.
Teams can see whether their consumption matches their reservations with a consistent, high-level number. We apply the same approach to tools like Dataproc by aggregating up the costs of component services and providing an organizational cost for those services.
How we use performance signals to improve user efficiency
Instead of overcorrecting for occasional performance fluctuations by allocating excessive resources, we try to align incentives so that people make the right choices for the business. Showback doesn’t work in a vacuum — it requires context and integrated insights. Teams need to show the cost of running a dashboard as well as the ROI is in terms of end user engagement and what peer dashboards with equivalent source datasets might cost.
We want to give users the freedom to do things the way they want and need to while also educating them on achieving their goals and using best practices to reduce their costs and improve their performance. The goal is never for all dashboards to load “less than x seconds” — we believe that any dashboard can load in x seconds when it is properly designed and resourced.
For instance, BigQuery allocates slots for a new workload quickly and efficiently, and queries that are optimized and have dedicated resources consistently complete quickly. When users experience a slowdown, it’s typically because they are sharing resources or inefficiently using their resources. Variable performance is a useful signal to help users discover opportunities to optimize queries and work more productively. We value these signals as we like to focus on the aggregate experience of all users interacting with the tool, not individual interaction.
A natural way to improve user efficiency is to reward ideal behaviors and discourage those that do not align with our analytics strategy. Some examples include splitting out high-demand reporting from ad-hoc exploration to reduce concurrency errors or encouraging people to use materialized tables instead of writing complex custom SQL. For instance, a dedicated reporting project might only include an organization’s Data Studio dashboard if it directly references a table or meets other optimization requirements. Using this approach, we give our users a high degree of freedom and experimentation at the entry-level while providing a well-documented path to scale.
Visibility into query performance improves business performance
The detailed tracking information we get from Google Cloud products is critical — Google’s robust analytics performance has enabled us to scale Data Studio to over 15,000 Wayfarians. Of course, a larger user base always comes with concerns that less sophisticated users may not appropriately optimize their queries or make the best use of the infrastructure.
Evaluating the different Data Studio dashboards helps us identify opportunities to use better query optimization practices, such as reducing custom queries, connecting directly to permanent tables, or using the BI Engine to improve dashboard performance. Recently, our team built new billing projects specific for Data Studio reporting. We can scale up a reservation dedicated to reporting about a major sales event in minutes.
Beyond everyday reporting, holidays and sales events may require higher, guaranteed performance. BigQuery’s flexible capacity commitments allow us to decide at a business level whether an urgent need requires us to reprioritize resources immediately or whether we have the time to optimize queries and rebuild dashboards to be performant. These new billing projects let us evaluate if teams need to scale up resourcing, what areas they can optimize in BigQuery, or if a new reservation is needed to resource that team separately.
Recommendations for achieving high performance at low cost
Are you wondering how to allocate BigQuery slots? Teams must see direct, immediate return on their investment in performance and optimization.
Our first rule of thumb is to align resource utilization with ownership as closely as possible. This makes it easier for teams to secure dedicated resources, even if they start out small. We’re comfortable doing this because BigQuery dynamically reassigns capacity between the targeted reservation and other consumers in milliseconds. We always get the total usage of our slots — there is no wasted capacity even when we break assignments down granularly.
Once a team has a reservation, we provide reporting that consumes various BigQuery information schema views, such as query logs and reservation information, and processes it into aggregated reporting. We look for metrics like the average slots available to a query at a point in time, overall query performance, and how long queries took to execute to pinpoint the overall health of a reservation against our business objectives. Flex slots also let us experiment easily with additional capacity, and BigQuery’s performance is so consistent that we can use straightforward models to estimate return on additional slot investment.
Other key cost optimization tips we have found helpful at Wayfair include:
- Optimize for worst-case performance. Given BigQuery’s ability to share slots, we expect teams will often see much better performance, but we find that thinking it’s more effective when teams think about the most pessimistic case when resourcing their jobs.
- Take advantage of BI Engine reservations. We like to think critically about the data and workload. BI Engine reservations are excellent for workloads that query lots of small dimension tables or a few larger tables loaded into memory. In cases like that, such as with OLAP tools using pre-computed aggregates, we’ve seen BI engine investments drive a 25% reduction in average query time—excellent ROI.
- Leverage Looker for large, longitudinal datasets. Since Looker supports a wide range of use cases, we see a broader range of performance — p50 is still under a second, but p95 can get as high as a minute. For these cases, we recommend modeling user patterns [first of month, first day of week] and dynamically allocating more slots for these periods while deprioritizing batch workloads in the key windows.
- Lean in heavily on the BQ cache for broad-based reporting. To avoid a Monday morning reporting lag, We use the BigQuery cache to avoid Monday morning report loading lags. Up to 30% of our Data Studio queries hit the BQ cache, ensuring our Data Studio p95 consistently stays under 10 seconds.
- Use slots-per-job to improve experience. In our reporting, we find that the most valuable view is slots-per-job. We look for dips in slots available for jobs as this situation often correlates strongly with poor user experiences. For example, our reporting showed us that Looker has the highest volumes of queries and users on Mondays and during each month’s first two business days. We used this information to scale up slots to support these periods of highest demand, delivering on performance SLAs to support business users.

- Get a global picture of usage. We manage slots in a central tool. Teams input their requirements into a calendar to indicate when they want higher or lower capacity to inform our flex slot purchases and annual commitments. It might seem like dozens of relatively inconsistent workloads at the team level, but the picture changes when you look at demand across a week (or our entire business). Understanding global usage makes it easy for us to model baseline capacity recommendations for serving year slots versus flexible demands.
Reaping the rewards of BigQuery
From our first initial undertaking with Google Cloud to transform our storefront, we had a lot of confidence in the underlying technology offerings and the teams that ran them and their ability to meet our unique requirements. But our experience using BigQuery for internal analytics at Wayfair has exceeded our already high expectations.
BigQuery’s fast, dynamic allocation of resources and ability to transform data in place are important to our mission of maintaining consistently high performance for our users while closely managing costs. Moreover, our visibility into query and dashboard performance through BigQuery’s DSP views and other performance metrics have helped us make clearer connections between performance goals and the costs required to meet them — and guide our analysts across the company towards attaining high performance on every project.
NVIDIA and Google Cloud Pave the Way for Single-cell Genomic Analysis

3003
Of your peers have already read this article.
2:00 Minutes
The most insightful time you'll spend today!
In the past decade, the Healthcare and Life Sciences industry has enjoyed a boon in technological and scientific advancement. New insights and possibilities are revealed almost daily. At Google Cloud, driving innovation in cloud computing is in our DNA. Our team is dedicated to sharing ways Google Cloud can be used to accelerate scientific discovery. For example, the recent announcement of AlphaFold2 showcases a scientific breakthrough, powered by Google Cloud, that will promote a quantum leap in the field of proteomics. In this blog, we’ll review another omics use case, single-cell analysis, and how Google Cloud’s Dataproc and NVIDIA GPUs can help accelerate that analysis.
The Need for Performance in Scientific Analysis
The ability to understand the causal relationship between genotypes and phenotypes is one of the long-standing challenges in biology and medicine. Understanding and drawing insights from the complexity of biological systems abounds from the actual code of life (DNA) through to expression of genes (RNA) to translation of gene transcripts into proteins that function in different pathways, cells, and tissues within an organism. Even the smallest of changes in our DNA can have large impacts on protein expression, structure, and function, which ultimately drives development and response – at both cellular and organism levels. And, as the omics space becomes increasingly data- and compute-intensive, research requires an adequate informatics infrastructure. An infrastructure that scales with growing data demands, enables a diverse range of resource-intensive computational activities, and is affordable and efficient – reducing data bottlenecks and enabling researchers to maximize insight.
But where do all these data and compute challenges come from and what makes scientific study so arduous? The layers of biological complexity begin to be made apparent immediately when looking at not just the genes themselves, but their expression. Although all the cells in our body share nearly identical genotypes, our many diverse cell types (e.g. hepatocytes versus melanocytes) express a unique subset of genes necessary for specific functions, making transcriptomics a more powerful method of analysis by allowing researchers to map gene expression to observable traits. Studies have shown that gene expression is heterogeneous, even in similar cell types. Yet, conventional sequencing methods require DNA or RNA extracted from a cell population. The development of single-cell sequencing was pivotal to the omics field. Single-cell RNA sequencing has been critical in allowing scientists to study transcriptomes across large numbers of individual cells.
Despite its potential, and the increasing availability of single-cell sequencing technology, there are several obstacles: an ever increasing volume of high-dimensionality data, the need to integrate data across different types of measurements (e.g. genetic variants, transcript and protein expression, epigenetics) and across samples or conditions, as well as varying levels of resolution and the granularity needed to map specific cell types or states. These challenges present themselves in a number of ways including background noise, signal dropouts requiring imputation, and limited bioinformatics pipelines that lack statistical flexibility. These and other challenges result in analysis workflows that are very slow, prohibiting the iterative, visual, and interactive analysis required to detect differential gene activity.
Accelerating Performance
Cloud computing can help not only with data challenges, but with some of the biggest obstacles: scalability, performance, and automation of analysis. To address several of the data and infrastructure challenges facing single-cell analysis, NVIDIA developed end-to-end accelerated single-cell RNA sequencing workflows that can be paired with Google Cloud Dataproc, a fully-managed service for running open source frameworks like Spark, Hadoop, and RAPIDS. The Jupyter notebooks that power these workflows include examples using samples like human lung cells and mouse brains cells and demonstrate acceleration between CPU-based processing compared to GPU-based workflows.
Google Cloud Dataproc powers the NVIDIA GPU-based approach and demonstrates data processing capabilities and acceleration, which in turn have the potential of delivering considerable performance gains. When paired with RAPIDS, practitioners can accelerate data science pipelines on NVIDIA GPUs, reducing operations like data loading, processing, and training from hours to seconds. RAPIDS abstracts the complexities of accelerated data science by building upon popular Python and Java libraries effortlessly. When applying RAPIDS and NVIDIA accelerated compute to single-cell genomics use cases, practitioners can churn through analysis of a million cells in only a few minutes.
Give it a Try
The journey to realizing the full potential of omics is long; but through collaboration with industry experts, customers, and partners like NVIDIA, Google Cloud is here to help shine a light on the road ahead. To learn more about the notebook provided for single-cell genomic analysis, please take a look at NVIDIA’s walkthrough. To give this pattern a try on Dataproc, please visit our technical reference guide.
This Diagnostic Company is Revolutionising Healthcare Delivery with AI
5403
Of your peers have already read this article.
5:30 Minutes
The most insightful time you'll spend today!
Dr. Elliot Smith cannot be accused of lacking ambition. A high achiever with a Ph.D. in Electrical Engineering and a specialist in magnetic resonance imaging (MRI) systems, Smith aims to deliver top quality healthcare to anyone in the world — regardless of their location or wealth.
Dr. Smith has already made strides on this journey with his Brisbane, Queensland-headquartered business, Maxwell MRI. “I saw there was a big gap in the market around automating the diagnosis of health conditions,” he says. “Existing processes were typically manual and involved a lot of people.”
Artificial intelligence (AI) and machine learning can remove a key obstacle to scaling out medicine and improve the efficiency and accuracy of diagnosing conditions, the healthcare entrepreneur believes.
“Our grand vision is to build an AI doctor that anyone can receive affordable support from and connect to in order to obtain results,” explains Dr. Smith.
Maxwell MRI presently enables clinicians to submit anonymised MRI scans to a machine learning enabled AI platform to help diagnose prostate cancer. The service is sold to clinicians who can then charge a per-session fee to clients. As well as obtaining results for individual cases, the MRI scans and associated information is used to ‘train’ the platform to deliver accurate diagnoses faster and in a more affordable way than existing systems do.
Dr. Smith and his team started by running a number of functions and processes on a single server with graphics processing units (GPUs) and sizable hard disk capacity. However, this infrastructure could not scale to support the planned growth of the business. Each case Maxwell MRI processes involves about 200MB of data in MRI scans alone. Once supplementary data, blood test result, pathology results and genetic information is included, this load can reach more than 1GB of data per patient.
The business aimed to process 150,000 cases by the end of 2018. This required a service that could deliver massive scale in data storage and compute, and could easily be accessed from any location. “We wanted to move from three GPUs to 30 GPUs without having to buy more servers or other associated equipment, so the cloud was the natural next step,” says Dr. Smith.
Maxwell MRI evaluated Google Cloud Platform (GCP) and determined that the managed services component of GCP would remove the burden of infrastructure deployment and administration. In addition, Google Cloud Machine Learning Engine would enable the business to scale to as many GPUs as needed to meet demand.
Maxwell MRI started with some small experiments to determine that GCP met all its requirements and completed its migration to the platform in February 2017. “We really started to scale up the data we had and consequently our computing requirements at that time,” Dr. Smith says.
The Maxwell MRI platform features an upload service that enables clinicians to upload imaging and associated data. This service triggers several different upload pipelines that clean and standardise data. They then write imaging data to Google Cloud Storage, and more structured data to a combination of Google Cloud Datastore and Google Cloud Spanner.
The platform then converts the information into records that can be used to ‘train’ new machine learning configurations or run evaluations through existing machine learning pipelines.
“The tasks we perform including segmenting various anatomical regions for analysis and sending those results back into Google Cloud Storage,” says Dr. Smith. “This then commences that repeated process of running Google Cloud Dataflow pipelines and machine learning algorithms, and presenting those outcomes back to the clinicians.”
Existing Literature Validated
The data processed and analysed to date has, Dr Smith says, enabled Maxwell MRI to help validate existing literature that indicates clinicians lack confidence in existing early-stage testing procedures for prostate cancer. This prompts them to move quickly to the biopsy stage to assure themselves their diagnosis is valid. “New technologies have a lot of potential to rectify this situation and guide treatment to be more accurate, specific and cost-effective,” he says.
Results Delivered in 10-15 Minutes
More specifically, using GCP has enabled Maxwell MRI to guarantee to clinicians that results will be delivered within minutes. “Clinicians are used to getting results back in two days to a week,” says Dr. Smith. “We’re saying that with our platform running on GCP we’ll deliver you results in 10 to 15 minutes, regardless of the number of patients coming in.”
Running on GCP has enabled the business to accelerate its development cycles, test new ideas easily on a subset of data, test in parallel and deliver new services considerably faster than in another environment. In addition, the flexible GCP charging model aligned with the ability to scale compute capabilities quickly and easily has enabled the fledgling business to control its costs.
Google technologies are poised to play an integral role in the business’s future. “With Google available, it doesn’t make sense for us to use our own infrastructure,” Dr. Smith says. “Our expertise in AI, machine learning and clinical engagement complements cloud platform specialties of infrastructure, managed services and ease of use. We see a bright future ahead in helping to transform healthcare globally.”

Customer Voices: How Firms from Across Industries Leverage Google Cloud
DOWNLOAD CASE STUDY14109
Of your peers have already downloaded this article
1:30 Minutes
The most insightful time you'll spend today!
From powering everyday operations and accelerating application innovation, to providing tools for specific business needs and executing on big ideas, to advancing the security of technology solutions, companies from across industries have leveraged Google Cloud for business benefits.
Companies from across industries have turned to Google Cloud for transforming their business, modernizing their infrastructure, and gleaning intelligence from data. For instance:
- Johnson & Johnson achieved a 41% increase in search results from high-quality job applicants, significantly improving the company’s ability to quickly hire top talent.
- Sony Network Communications now processes 10 billion monthly queries faster, which advances data analysis.
- University College Dublin saw significant 6-figure savings by eliminating legacy hardware, software, and maintenance.
And there are many such examples. Read the collection of case studies to find out how companies from across industries and geographies leveraged Google Cloud for measurable business benefits and for solving complex problems.
How AI and ML Helps Interpret Baseball Fandom during this MLB Season

4552
Of your peers have already read this article.
1:30 Minutes
The most insightful time you'll spend today!
The game of baseball has no shortage of statistics — from batting average to exit velocity, strikeouts to wins above replacement. Among all sports, Major League Baseball (MLB) arguably contains the most analytical and data-driven participants and fan base. Subconsciously or viscerally, players and managers on the field and those following from anywhere are constantly assessing and making decisions based off of game play trends and expectations — whether a batter will come through with a hit in an important situation, when a pitcher should be pulled. Less analyzed, however, is what leads fans to become engaged with certain players or teams, and what factors drive their love of the game. This is the motivation behind the problem being posed by Major League Baseball in their Kaggle competition for Player Digital Engagement Forecasting. Can you use machine learning to deconstruct baseball fandom?
This competition asks you to predict measures of digital engagement for each active player on a daily basis during the MLB season. So, how large was the surge in fan interest after Joe Musgrove threw the first no-hitter in Padres history? Is Shohei Ohtani’s engagement higher when he pitches well, when he hits a monster home run…or when he does both? You’re provided a wealth of game, team and player information – detailed stats, awards, rosters, and transaction information – as well as social and digital engagement data as your inputs. Data scientists will recognize this as an exciting forecasting problem with both traditional regression and time series components, where having this input data just prior to the prediction date is critical to determining which players will receive the most engagement.
With so many variables in the game, there are an endless number of vectors which could possibly influence fan engagement. Eleven-time All-Star Miguel Cabrera delighted fans by hitting the first home run of the season – in the snow! Occasionally a lesser-known player like Musgrove or Carlos Rodón “wins the day” with an unlikely no-hitter. And sometimes just getting traded to an iconic franchise like the Yankees generates a ton of fan interest, like it did for Rougned Odor in early April.
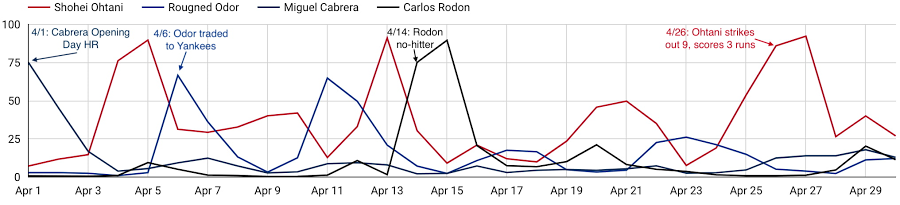
As these examples show, a player’s digital engagement can be pretty dynamic during the season, with many different potential contributors to who is “trending” on a given day. How can you use data to uncover which factors are the most influential of engagement with each player’s digital content?
Ready to play ball? Check out the competition on Kaggle for all the details. $50,000 in prizes is up for grabs in two prize categories. The code competition puts your machine learning skills to the test, to see who can build the most accurate forecasting models to predict daily digital engagement for every active player. You’ll have until July 31st to build your models and then be evaluated on a future time frame, which will determine the winners. For data visualization and exploration experts out there, the explainability prizes give you an opportunity to analyze more broadly which factors, even those outside of what we’re providing directly, most influence digital engagement. You’ll be evaluated on how well you can use what the data is telling you to support your findings.
And if you’re looking to get started, we’ve provided an introductory video and some notebook tutorials, including a starting point for harnessing the power of Vertex AI through tools including Cloud Notebooks, Explainable AI, and Vizier.
With the second half of the season upon us, it’s an exciting time to be an MLB fan. With this Kaggle competition, it’s also a perfect opportunity to use data science to help understand baseball fandom and potentially earn some of your own accolades in the process. Step up to the plate!
Major League Baseball trademarks and copyrights are used with permission of Major League Baseball. Visit MLB.com.
Google Cloud Data Heroes Series: Honoring Data Practitioner’s Journey and Learning with GCP

4966
Of your peers have already read this article.
4:00 Minutes
The most insightful time you'll spend today!
Google Cloud Data Heroes is a series where we share stories of the everyday heroes who use our data analytics tools to do amazing things. Like any good superhero tale, we explore our Google Cloud Data Heroes’ origin stories, how they moved from data chaos to a data-driven environment, what projects and challenges they are overcoming now, and how they give back to the community.
For our first issue, we couldn’t be more excited to introduce Google Cloud Data Heroine Lynn Langit. Lynn is a seasoned business woman in Minnesota beginning her eleventh year as the Founder of her own consulting business, Lynn Langit Consulting LLC. Lynn wears many data professional hats including Cloud Architect, Developer, and Educator. If that wasn’t already a handful, she also loves riding her bike at any given season of the year (pictured on the right), which you might imagine gets a bit challenging when you have to invest in bike studded snow tires!

Tell us how you got to be a data practitioner. What was that experience like and how did this journey bring you to GCP?
I worked on the business side of tech for many years. While I enjoyed my work, I found I was intrigued by the nuanced questions practitioners could ask – and the sophisticated decisions they could make – once they unlocked value from their data. This initial intrigue developed into a strong curiosity and I ultimately made the switch from business worker to data practitioner over 15 years ago. This was a huge change in career considering I got my bachelor’s degree in Linguistics and German. And so I started small. I taught myself most everything both at the beginning and even now through online resources, courses, and materials. I began with database and data warehousing, specifically building and tuning many enterprise databases. It wasn’t until Hadoop/NoSQL became available that I pivoted to Big Data…
Back then, I supplemented my self-paced learning with Microsoft technologies, even earning all Microsoft certifications in just one year. When I noticed the industry shifting from on premise to cloud, I shifted my learning from programming to cloud, too. I have been working in the public cloud for over ten years already!
“I started with AWS, but recently I have been doing most everything in GCP. I particularly love implementing data pipelining, data ops, and machine learning.”
How did you supplement your self teachings with Google Cloud data upskilling opportunities like product deep dives and documentation, courses, skills, and certificates?
One of the first Google Cloud data analytics products I fell in love with was BigQuery. BigQuery was my gateway product into a much larger open, intelligent, and unified data platform full of products that combined data analytics, databases, AI/ML, and business intelligence.
I’ve achieved Skills Badges in BigQuery, Data Analysis, and more. I’ve also achieved Google’s Professional Data Engineer Certification, and have been a Google Developer Expert since 2012.
Most recently, I was named one of few Data Analysis Innovator Champions within the Google Cloud Innovators Program, which I’m particularly excited about because I’ve heard it’s a coveted spot for data practitioners and necessitates a Googler nomination to move from the Innovator membership to Champion title!
You’re undoubtedly a data analytics thought leader in the community. When did you know you moved from data student to data master and what data project are you most excited about?
I knew I had graduated, if you will, to the data architect realm once I was able to confidently do data work that matters, even if that work was outside of my usual domains: adTech and finTech..
For example, my work over the past few years has been around human health outcomes, including combatting the COVID-19 pandemic. I do this by supporting scientists and bioinformatic researchers with genomic-scale data pipelines. Did I know anything about genomics before I started? Not at all! I self-studied bioinformatics and recorded my learnings on GitHub. Along the way I adopted my learnings into an open source GCP course on GitHub aimed at researchers who are new to working with GCP. What’s cool about the course is that I begin from the true basics of how to set up a GCP account. Then I gradually work up to mapping out genomic-scale data workflows, pipelines, analyses, batch jobs, and more using BigQuery and a host of other Google Cloud data products.
Now, I’ve received feedback that this repository has made a positive impact on researchers’ ability to process and synthesize enormous amounts of data quickly. Plus, it achieves the greater goal of broadening accessibility to a public cloud like GCP.
In what ways do you think you uniquely bring value back to the data community? Why is it important to you to give back to the data community?
I stay busy always sharing my learnings back to the community. I record Cloud and Big data technical screencasts (demos) on Youtube, I’ve authored 25 data and cloud courses on LinkedIn Learning, and I occasionally write Medium articles on cloud technology and random thoughts I have about everyday life. I’m also the cofounder of Teaching Kids Programming, with a mission to help equip middle and high school teachers with a great programming curriculum on Java.
Begin your own hero’s journey
Ready to embark on your Google Cloud data adventure? Begin your own hero’s journey with GCP’s recommended learning path where you can achieve badges and certifications along the way. Join the Cloud Innovators program today to stay up to date on more data practitioner tips, tricks, and events.
Connect with Google’s data community at our upcoming virtual event “Latest Google Cloud data analytics innovations”. Register and save your spot now to get your data questions answered live by GCP’s top data leaders and watch demos from our latest products and features including BigQuery, Dataproc, Dataplex, Dataflow, and more. Lynn will take the main stage as an emcee for this event – you won’t want to miss!
Finally, if you think you have a good Data Hero story worth sharing, please let us know! We’d love to feature you in our series as well.
More Relevant Stories for Your Company




Video: How AI is Helping Biologists Protect Wildlife
According to the World Wildlife Fund, vertebrate populations have shrunk an average of 60 percent since the 1970s. And a recent UN global assessment found that we’re at risk of losing one million species to extinction, many of which may become extinct within the next decade. To better protect wildlife, seven organizations, led

Candidate360: Google Cloud and Deloitte Product Improves Universities’ Enrollment and Admission Processes
Given the May 1 deadline for students to enroll, colleges and universities have been carefully watching the numbers of students who put down deposits and commit to a school. Like nearly every other sector in the U.S., colleges and universities have been hit hard by the pandemic and economic downturn,

How TeamSnap Improved Return on Ad Spend Significantly
Anyone who has ever coached or played on a sports team, or had a child involved in sports, knows how difficult scheduling and logistics can be. From game and practice schedules, to uniforms and who’s bringing the snacks, it can be a lot for coaches, administrators, parents, and players to

This Chart, from Home Depot, Dramatically Demonstrates the Power of a Cloud Data Warehouse
The Home Depot (THD) is the world’s largest home-improvement chain, growing to more than 2,200 stores and 700,000 products in four decades. Much of that success was driven through the analysis of data. This included developing sales forecasts, replenishing inventory through the supply chain network, and providing timely performance scorecards. However,
