





BigQuery Helps Insurance Firms Leverage Previous Storm Data for Better Pricing Insights

8546
Of your peers have already read this article.
2:00 Minutes
The most insightful time you'll spend today!
It may be surprising to know that U.S. natural catastrophe economic losses totaled $119 billion in 2020, and 75% (or $89.4B) of those economic losses were caused by severe storms and cyclones. In the insurance industry, data is everything. Insurers use data to influence underwriting, rating, pricing, forms, marketing, and even claims handling. When fueled by good data, risk assessments become more accurate and produce better business results. To make this possible, the industry is increasingly turning to predictive analytics, which uses data, statistical algorithms, and machine learning (ML) techniques to predict future outcomes based on historical data. Insurance firms also integrate external data sources with their own existing data to generate more insight into claimants and damages. Google Cloud Public Datasets offers more than 100 high-demand public datasets through BigQuery that helps insurers in these sorts of data “mashups.”
One particular dataset that insurers find very useful is Severe Storm Event Details from the U.S. National Oceanic and Atmospheric Administration (NOAA). As part of the Google Cloud Public Datasets program and NOAA’s Public Data Program, this severe storm data contains various types of storm reports by state, county, and event type—from 1950 to the present—with regular updates. Similar NOAA datasets within the Google Cloud Public Datasets program include the Significant Earthquake Database, Global Hurricane Tracks, and the Global Historical Tsunami Database.
In this post, we’ll explore how to apply storm event data for insurance pricing purposes using a few common data science tools—Python Notebook and BigQuery—to drive better insights for insurers.
Predicting outcomes with severe storm datasets
For property insurers, common determinants of insurance pricing include home condition, assessor and neighborhood data, and cost-to-replace. But macro forces such as natural disasters—like regional hurricanes, flash floods, and thunderstorms—can also significantly contribute to the risk profile of the insured. Insurance companies can leverage severe weather data for dynamic pricing of premiums by analyzing the severity of those events in terms of past damage done to property and crops, for example.
It’s important to set the premium correctly, however, considering the risks involved. Insurance companies now run sophisticated statistical models, taking into account various factors—many of which can change over time. After all, without accurate data, poor predictions can lead to business losses, particularly at scale.
The Severe Storm Event Details database includes information about a storm event’s location, azimuth (an angle measurement used in celestial coordination), distance, impact, and severity, including the cost of damages to property and crops. It documents:
- The occurrence of storms and other significant weather events of sufficient intensity to cause loss of life, injuries, significant property damage, and/or disruption to commerce.
- Rare, unusual weather events that generate media attention, such as snow flurries in South Florida or the San Diego coastal area.
- Other significant weather events, such as record maximum or minimum temperatures or precipitation that occur in connection with another event.
Data about a specific event is added to the dataset within 120 days to allow time for damage assessments and other analysis.
Driving business insights with BigQuery and notebooks
Google Cloud’s BigQuery provides easy access to this data in multiple ways. For example, you can query directly within BigQuery and perform analysis using SQL.
Another popular option in the data science and analyst community is to access BigQuery from within the Notebook environment to intersperse Python code and SQL text, and then perform ad hoc experimentation. This uses the powerful BigQuery compute to query and process huge amounts of data without having to perform the complex transformations within the memory in Pandas, for example.
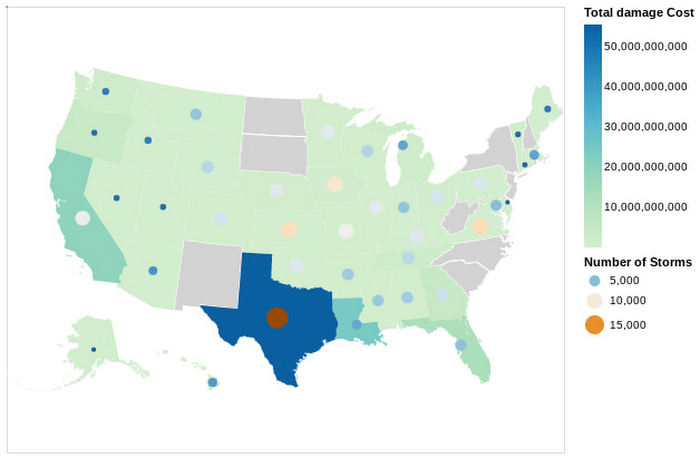
In this Python notebook, we have shown how the severe storm data can be used to generate risk profiles of various zip codes based on the severity of those events as measured by the damage incurred. The severe storm dataset is queried to retrieve a smaller dataset into the notebook, which is then explored and visualized using Python. Here’s a look at the risk profiles of the zip codes:
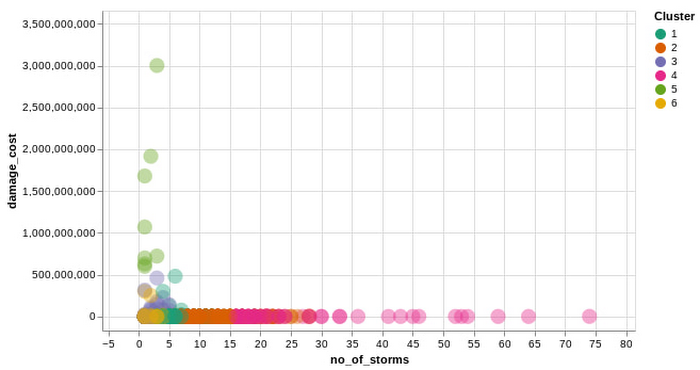
Another Google Cloud resource for insurers is BigQuery ML, which allows them to create and execute machine learning models on their data using standard SQL queries. In this notebook, with a K-Means Clustering algorithm, we have used BigQuery ML to generate different clusters of zip codes in the top five states impacted by severe storms. These clusters show different levels of impact by the storms, indicating different risk groups.
The example notebook is a reference guide to enable analysts to easily incorporate and leverage public datasets to augment their analysis and streamline the journey to business insights. Instead of having to figure out how to access and use this data yourself, the public datasets, coupled with BigQuery and other solutions, provide a well-lit path to insights, leaving you more time to focus on your own business solutions.
Making an impact with big data
Google Cloud’s Public Datasets is just one resource within the broader Google Cloud ecosystem that provides data science teams within the financial services with flexible tools to gather deeper insights for growth. The severe storm dataset is a part of our environmental, social, and governance (ESG) efforts to organize information about our planet and make it actionable through technology, helping people make a positive impact together.
To learn more about this public dataset collaboration between Google Cloud and NOAA, attend the Dynamic Pricing in Insurance: Leveraging Datasets To Predict Risk and Price session at the Google Cloud Financial Services Summit on May 27. You can also check out our recent blog and explore more about BigQuery and BigQuery ML.
Why and How to Migrate to Google BigQuery

5363
Of your peers have already read this article.
6:30 Minutes
The most insightful time you'll spend today!
Over the past few decades, organizations have mastered the science of data warehousing. They have increasingly applied descriptive analytics to large quantities of stored data, gaining insight into their core business operations. Conventional Business Intelligence (BI), which focuses on querying, reporting, and Online Analytical Processing, might have been a differentiating factor in the past, either making or breaking a company, but it’s no longer sufficient.
Today, not only do organizations need to understand past events using descriptive analytics, they need predictive analytics, which often uses machine learning (ML) to extract data patterns and make probabilistic claims about the future. The ultimate goal is to develop prescriptive analytics that combine lessons from the past with predictions about the future to automatically guide real-time actions.
Traditional data warehouse practices capture raw data from various sources, which are often Online Transactional Processing (OLTP) systems. Then, a subset of data is extracted in batches, transformed based on a defined schema, and loaded into the data warehouse. Because traditional data warehouses capture a subset of data in batches and store data based on rigid schemas, they are unsuitable for handling real-time analysis or responding to spontaneous queries. Google designed BigQuery in part in response to these inherent limitations.
Innovative ideas are often slowed by the size and complexity of the IT organization that implements and maintains these traditional data warehouses. It can take years and substantial investment to build a scalable, highly available, and secure data warehouse architecture. BigQuery offers sophisticated software as a service (SaaS) technology that can be used for serverless data warehouse operations. This lets you focus on advancing your core business while delegating infrastructure maintenance and platform development to Google Cloud.
BigQuery offers access to structured data storage, processing, and analytics that’s scalable, flexible, and cost effective. These characteristics are essential when your data volumes are growing exponentially—to make storage and processing resources available as needed, as well as to get value from that data. Furthermore, for organizations that are just starting with big data analytics and machine learning, and that want to avoid the potential complexities of on-premises big data systems, BigQuery offers a pay-as-you-go way to experiment with managed services.
With BigQuery, you can find answers to previously intractable problems, apply machine learning to discover emerging data patterns, and test new hypotheses. As a result, you have timely insight into how your business is performing, which enables you to modify processes for better results. In addition, the end user’s experience is often enriched with relevant insights gleaned from big data analysis, as we explain later in this series.
The migration framework
Undertaking a migration can be a complex and lengthy endeavor. Therefore, we recommend adhering to a framework to organize and structure the migration work in phases:
- Prepare and discover: Prepare for your migration with workload and use case discovery.
- Assess and plan: Assess and prioritize use cases, define measures of success, and plan your migration.
- Execute: Iterate the following steps for each use case:
- Migrate (offload): Migrate only your data, schema, and downstream business applications.
- Migrate (full): Alternatively, migrate the use case fully end-to-end. The same as Migrate (offload), with the addition of the upstream data pipelines.
- Verify and validate: Test and validate the migration to assess return on investment.
The following diagram illustrates the recommended framework and shows how the different phases are connected:

For a deeper understanding, read Migrating data warehouses to BigQuery: Introduction and overview
6181
Of your peers have already watched this video.
13:00 Minutes
The most insightful time you'll spend today!
Google Cloud’s 2021 Data Analytics Launches
Google Cloud announced closed to 15 services and programs spanning database, analytics, business intelligence and AI to help businesses gain value out of their data. Here’s a rundown of announcements throughout 2021 on analytics solutions and services such as Dataplex, an intelligent data fabric solution, Datastream, a serverless change data capture and replication service and Google Cloud analytics hub. Watch the video to get started with Google Cloud’s Data Analytics offerings.
Transform ‘Dark Data’ from Documents with Document AI, Cloud Functions and Workflows

8182
Of your peers have already read this article.
2:00 Minutes
The most insightful time you'll spend today!
At enterprises across industries, documents are at the center of core business processes. Documents store a treasure trove of valuable information whether it’s a company’s invoices, HR documents, tax forms and much more. However, the unstructured nature of documents make them difficult to work with as a data source. We call this “dark data” or unstructured data that businesses collect, process and store but do not utilize for purposes such as analytics, monetization, etc. These documents in pdf or image formats, often trigger complex processes that have historically relied on fragmented technology and manual steps. With compute solutions on Google Cloud and Document AI, you can create seamless integrations and easy to use applications for your users. Document AI is a platform and a family of solutions that help businesses to transform documents into structured data backed by machine learning. In this blog post we’ll walk you through how to use Serverless technology to process documents with Cloud Functions, and with workflows of business processes orchestrating microservices, API calls, and functions, thanks to Workflows.
At Cloud Next 2021, we presented how to build easy AI-powered applications with Google Cloud. We introduced a sample application for handling incoming expense reports, analyzing expense receipts with Procurement Document AI, a DocAI solution for automating procurement data capture from forms including invoices, utility statements and more. Then organizing the logic of a report approval process with Workflows, and used Cloud Functions as glue to invoke the workflow, and do analysis of the parsed document.
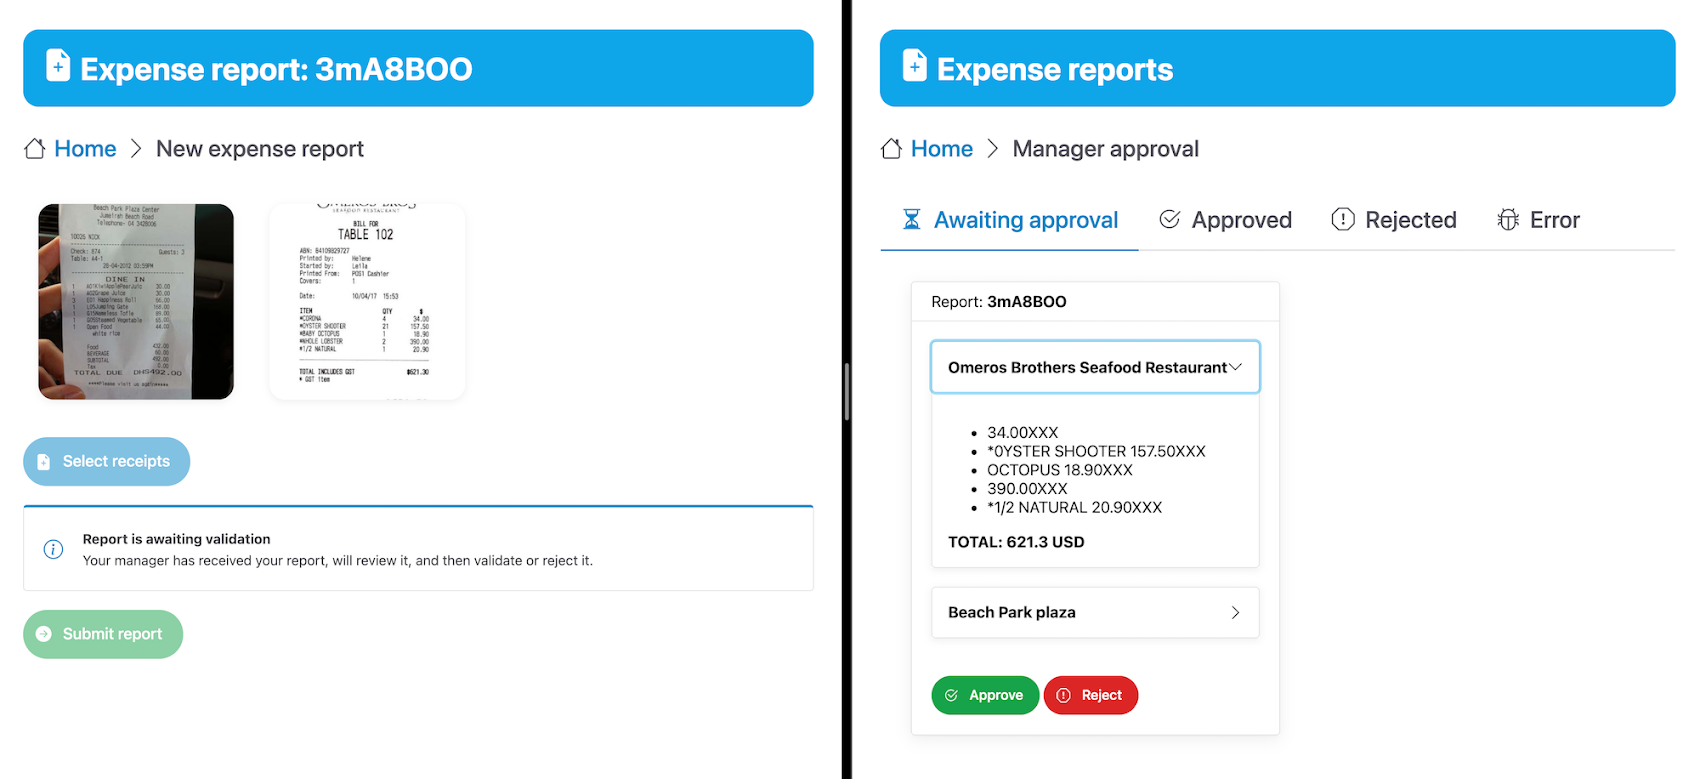
We also open sourced the code on this Github repository, if you’re interested in learning more about this application.
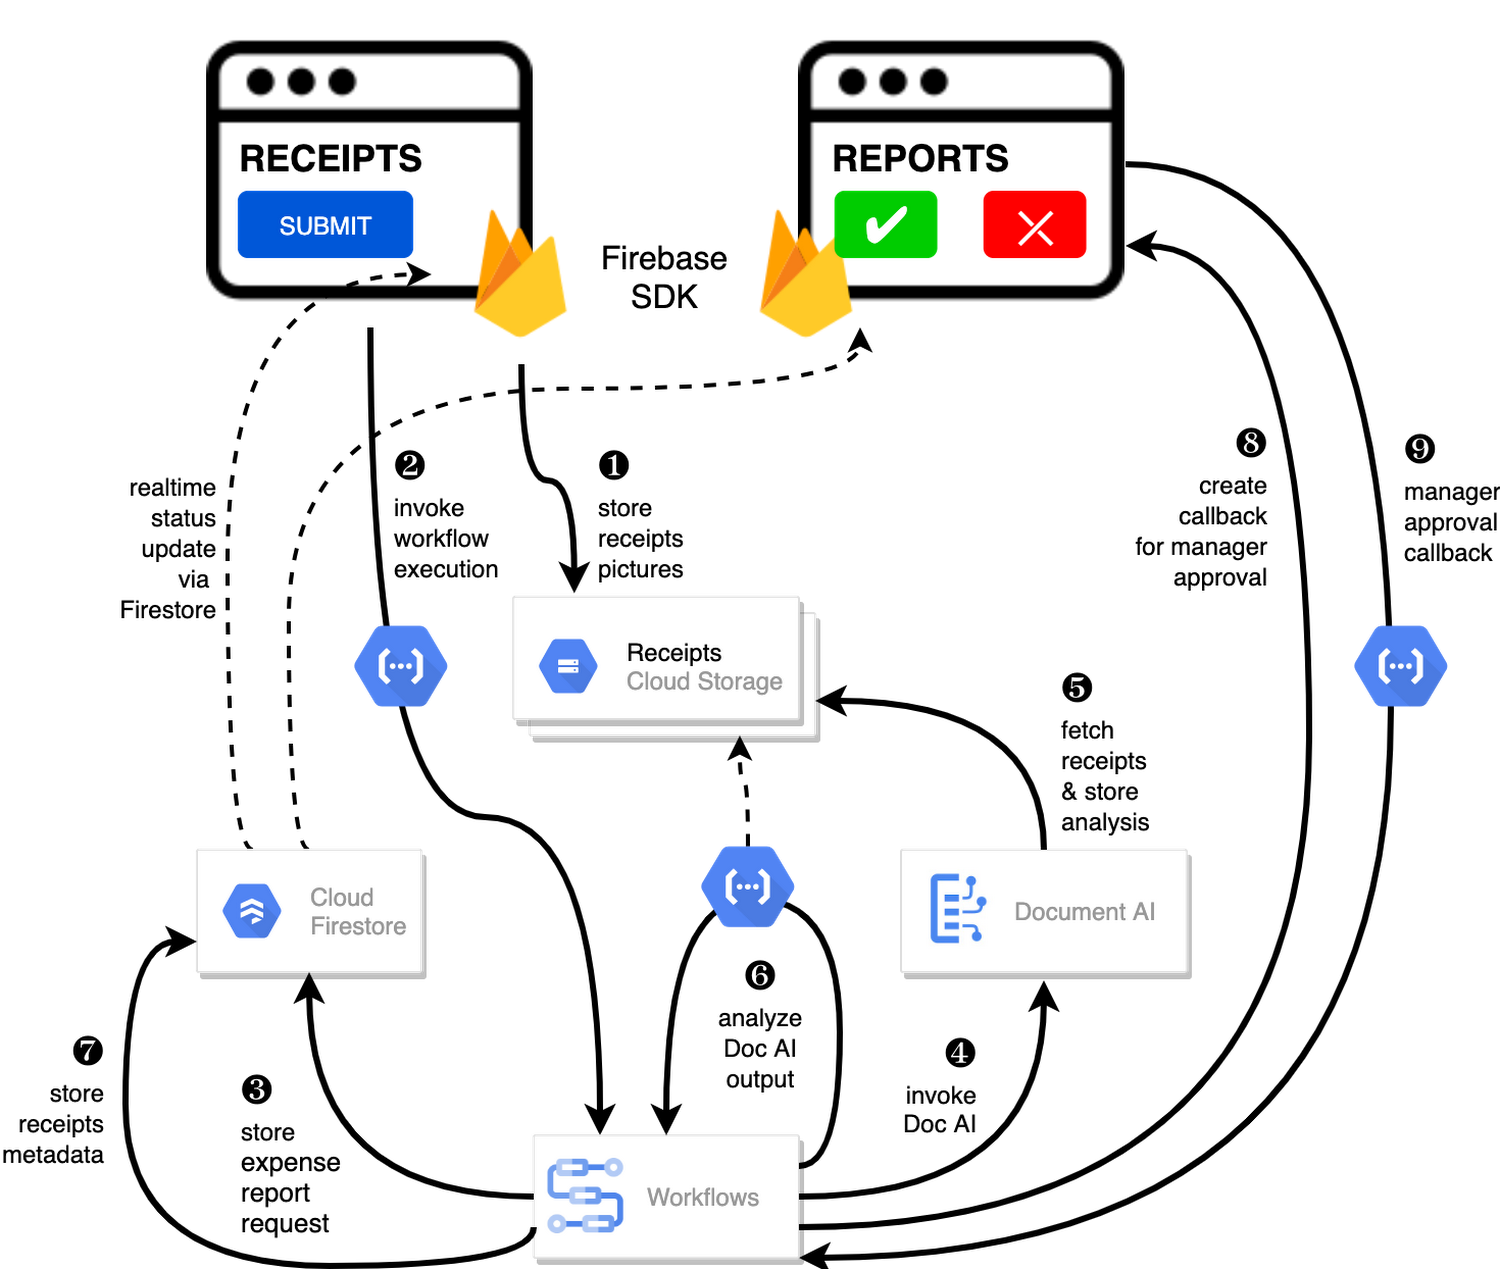
In the above diagram, there are two user journeys: the employee submitting an expense report where multiple receipts are processed at once, and the manager validating or rejecting the expense report.
First, the employee goes to the website, powered by Vue.js for the frontend progressive JavaScript framework and Shoelace for the library of web components. The website is hosted via Firebase Hosting. The frontend invokes an HTTP function that triggers the execution of our business workflow, defined using the Workflows YAML syntax.
Workflows is able to handle long-running operations without any additional code required, in our case we are asynchronously processing a set receipt files. Here, the Document AI connector directly calls the batch processing endpoint for service. This API returns a long-running operation: if you poll the API, the operation state will be “RUNNING” until it has reached a “SUCCEEDED” or “FAILED” state. You would have to wait for its completion. However, Workflows’ connectors handle such long-running operations, without you having to poll the API multiple times till the state changes. Here’s how we call the batch processing operation of the Document AI connector:
- invoke_document_ai:call: googleapis.documentai.v1.projects.locations.processors.batchProcessargs:name: ${"projects/" + project + "/locations/eu/processors/" + processorId}location: "eu"body:inputDocuments:gcsPrefix:gcsUriPrefix: ${bucket_input + report_id}documentOutputConfig:gcsOutputConfig:gcsUri: ${bucket_output + report_id}skipHumanReview: trueresult: document_ai_response
Machine learning uses state of the art Vision and Natural Language Processing models to intelligently extract schematized data from documents with Document AI. As a developer, you don’t have to figure out how to fine tune or reframe the receipt pictures, or how to find the relevant field and information in the receipt. It’s Document AI’s job to help you here: it will return a JSON document whose fields are: line_item, currency, supplier_name, total_amount, etc. Document AI is capable of understanding standardized papers and forms, including invoices, lending documents, pay slips, driver licenses, and more.
A cloud function retrieves all the relevant fields of the receipts, and makes its own tallies, before submitting the expense report for approval to the manager. Another useful feature of Workflows is put to good use: Callbacks, that we introduced last year. In the workflow definition we create a callback endpoint, and the workflow execution will wait for the callback to be called to continue its flow, thanks to those two instructions:
- create_callback:call: events.create_callback_endpointargs:http_callback_method: "POST"result: callback_details...- await_callback:try:call: events.await_callbackargs:callback: ${callback_details}timeout: 3600result: callback_requestexcept:as: esteps:- update_status_to_error:...
In this example application, we combined the intelligent capabilities of Document AI to transform complex image documents into usable structured data, with Cloud Functions for data transformation, process triggering, and callback handling logic, and Workflows enabled us to orchestrate the underlying business process and its service call logic.
Going further
If you’re looking to make sense of your documents, turning dark data into structured information, be sure to check out what Document AI offers. You can also get your hands on a codelab to get started quickly, in which you’ll get a chance at processing handwritten forms. If you want to explore Workflows, quickstarts are available to guide you through your first steps, and likewise, another codelab explores the basics of Workflows. As mentioned earlier, for a concrete example, the source code of our smart expense application is available on Github. Don’t hesitate to reach out to us at @glaforge and @asrivas_dev to discuss smart scalable apps with us.

4452
Of your peers have already downloaded this article
3:00 Minutes
The most insightful time you'll spend today!
Contact centers can transform customer experience using AI-driven speech analytics to evaluate every customer interaction and use it as a ‘data point’ to identify key patterns, enquiries, pain points, reviews and feedback to enhance customer experience with real-time, personalized recommendations. Knowlarity’s AI-based cloud telephony solutions for businesses built with Google Cloud takes speech analytics to another level!
Download the article to empower your contact centers with AI-powered speech analytics to make predictive analysis, reduce call handling time and volume as well as train contact center agents to provide customers with quick and real-time feedback.

How Domino’s Increased Monthly Revenue By 6% with Google Marketing Platform
DOWNLOAD CASE STUDY5755
Of your peers have already downloaded this article
1:30 Minutes
The most insightful time you'll spend today!
Pizza purveyor Domino’s is dominating delivery sales around the world. Today, Domino’s is the most popular pizza delivery chain operating in the U.K., the Republic of Ireland, Germany, and Switzerland — and sales just keep growing.
In these regions in 2014, Domino’s sold 76 million pizzas and generated £766.6 million (1.02 billion USD) in revenue — a 14.6% increase from the previous year.
In the U.K. and Ireland, online sales are increasing 30% year over year and currently account for almost 70% of all sales. Notably, 44% of those online sales are now made via mobile devices.
Multi-Device Purchasing Means Fresh Opportunities
Domino’s is a consistent digital innovator. Much of the company’s success stems from early investments in ecommerce and mobile commerce platforms that help people easily purchase pizzas from different devices.
Domino’s sold its first pizza online in 1999. It then launched an iPhone app in 2010, quickly followed by apps for Android and iPad in 2011, and a Windows app in 2012. By late 2014, Domino’s customers could even order pizzas from Xboxes.
The Domino’s marketing team had assembled a variety of tools to measure marketing performance, keeping pace with the company’s rapid innovations. Unfortunately, measuring siloed analytics and channel-focused tools restricted the team’s ability to fully understand all of the different paths to purchase.
Find out how they worked around this challenge with Google Marketing Platform. Download the case study!
More Relevant Stories for Your Company
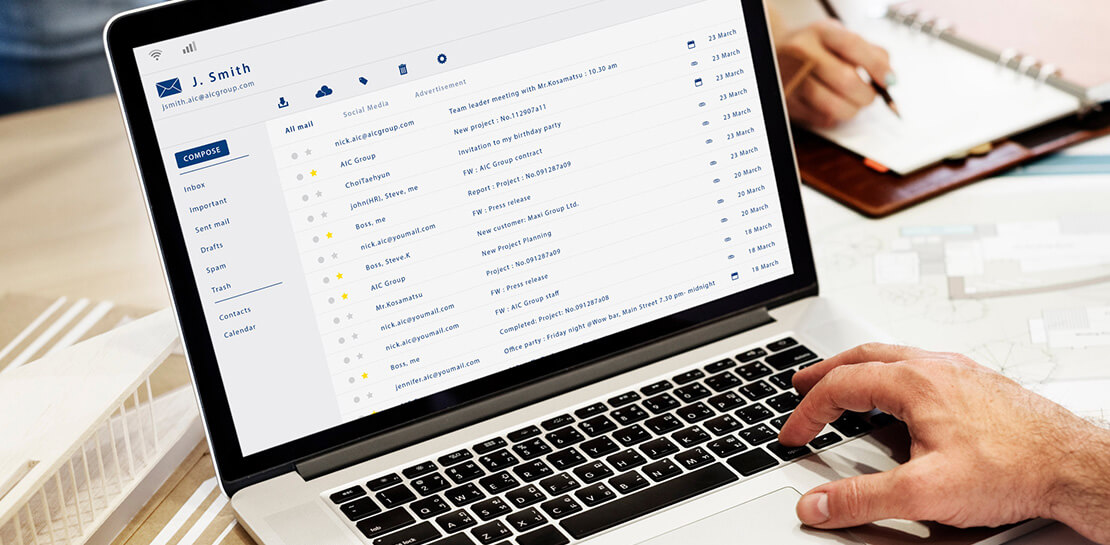
Google Cloud Helped Digitec Galaxus Personalize Over 2 Million Newsletters in a Week
Digitec Galaxus AG is the biggest online retailer in Switzerland, operating two online stores: Digitec, Switzerland's online market leader for consumer electronics and media products, and Galaxus, the largest Swiss online shop with a steadily growing range of consistently low-priced products for almost all daily needs. Known for its efficient, personalized shopping experiences,

How Eventrac and Workflows Integration Helps Implement Hybrid Architecture in Google Cloud
I previously talked about Eventarc for choreographed (event-driven) Cloud Run services and introduced Workflows for orchestrated services. Eventarc and Workflows are very useful in strictly choreographed or orchestrated architectures. However, you sometimes need a hybrid architecture that combines choreography and orchestration. For example, imagine a use case where a message to a Pub/Sub topic
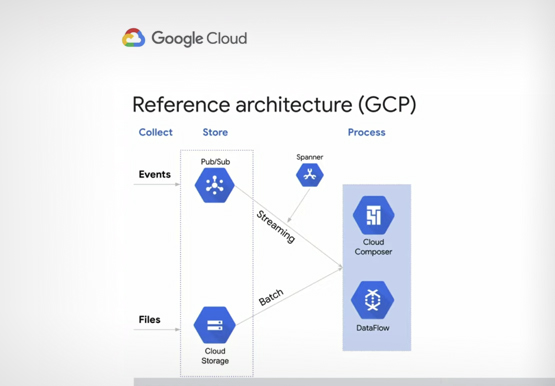
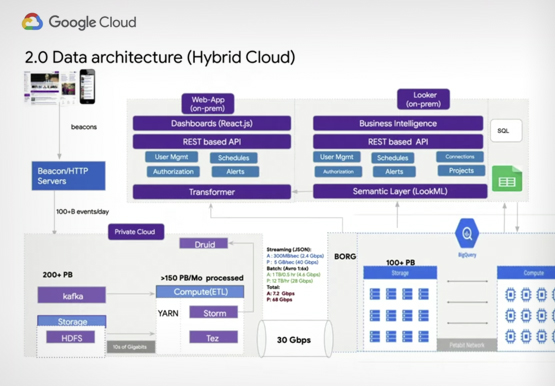

Verizon Media Shows the Solution Architecture it Uses for a 100+ PB Analytics Platform
Verizon Media owns and operates more than a dozen brands including Yahoo Mail, Yahoo News, AOL, Huffington Post, TechCrunch, and Engadget among others. These web properties are visited by millions of users on a daily basis. In this session, Shakil Memon, Customer Engineer, Google Cloud and Nikhil Mishra, Sr Director,

How Constellation Brands’ Direct-to-Customer Tech Delivers Economic Impact across Business Portfolio
Editor’s note: Today we’re hearing from Ryan Mason, Director, Head of DTC Growth & Strategy, at alcoholic beverage firm, Constellation Brands on the company’s shift to Direct-to-Consumer (DTC) sales and how Google Cloud’s powerful technology stack helped with this transformation. It’s no secret that consumer businesses have been up-ended in
