





Google Dataflow Named Leader in The 2021 Forrester Wave™: Streaming Analytics

6663
Of your peers have already read this article.
2:00 Minutes
The most insightful time you'll spend today!
We are excited to announce that Google has been named a Leader in The Forrester Wave™: Streaming Analytics, Q2 2021 report. Thank you to our strong community of customers and partners for working with us to deliver a customer focused product. We believe Forrester’s recognition is an acknowledgement of our leadership across an integrated set of capabilities that rely on data to drive transformation. We were also honored to be named a leader in The Forrester Wave™: Cloud Data Warehouse, Q1 2021.
Forrester gave Dataflow a score of 5 out of 5 across 12 different criteria and according to the report: “Google Cloud Dataflow has strengths in data sequencing, advanced analytics, performance, and high-availability. Google Dataflow’s sweet spot is for enterprises that have a preponderance of real-time data generated on Google Cloud Platform or wish to simplify all data processing by using a single platform that unifies both streaming and batch jobs.”
Harnessing the power of real-time data
The speed with which businesses are able to respond to change is the difference between those that successfully navigate the future and those that get left behind. In order to accelerate their digital transformation, reimagine their business and leverage the power of real-time data, today’s data leaders require a streaming analytics platform that provides both depth and breadth.
Cloud Pub/Sub and Cloud Dataflow, based on more than a decade of experience in internet scale systems for Google’s own needs, provide customers with a reliable, scalable, performant platform. In addition, we’ve designed these products for ease of use to make streaming analytics accessible to more users, which is why customers such as Sky and others from across all industries use Dataflow to run streaming analytics workloads.
5 out of 5 across key streaming analytics criteria
While Forrester gave Dataflow a score of 5 out of 5 in 12 criteria, the product achieved the highest possible scores in areas that are top of mind for our customers.
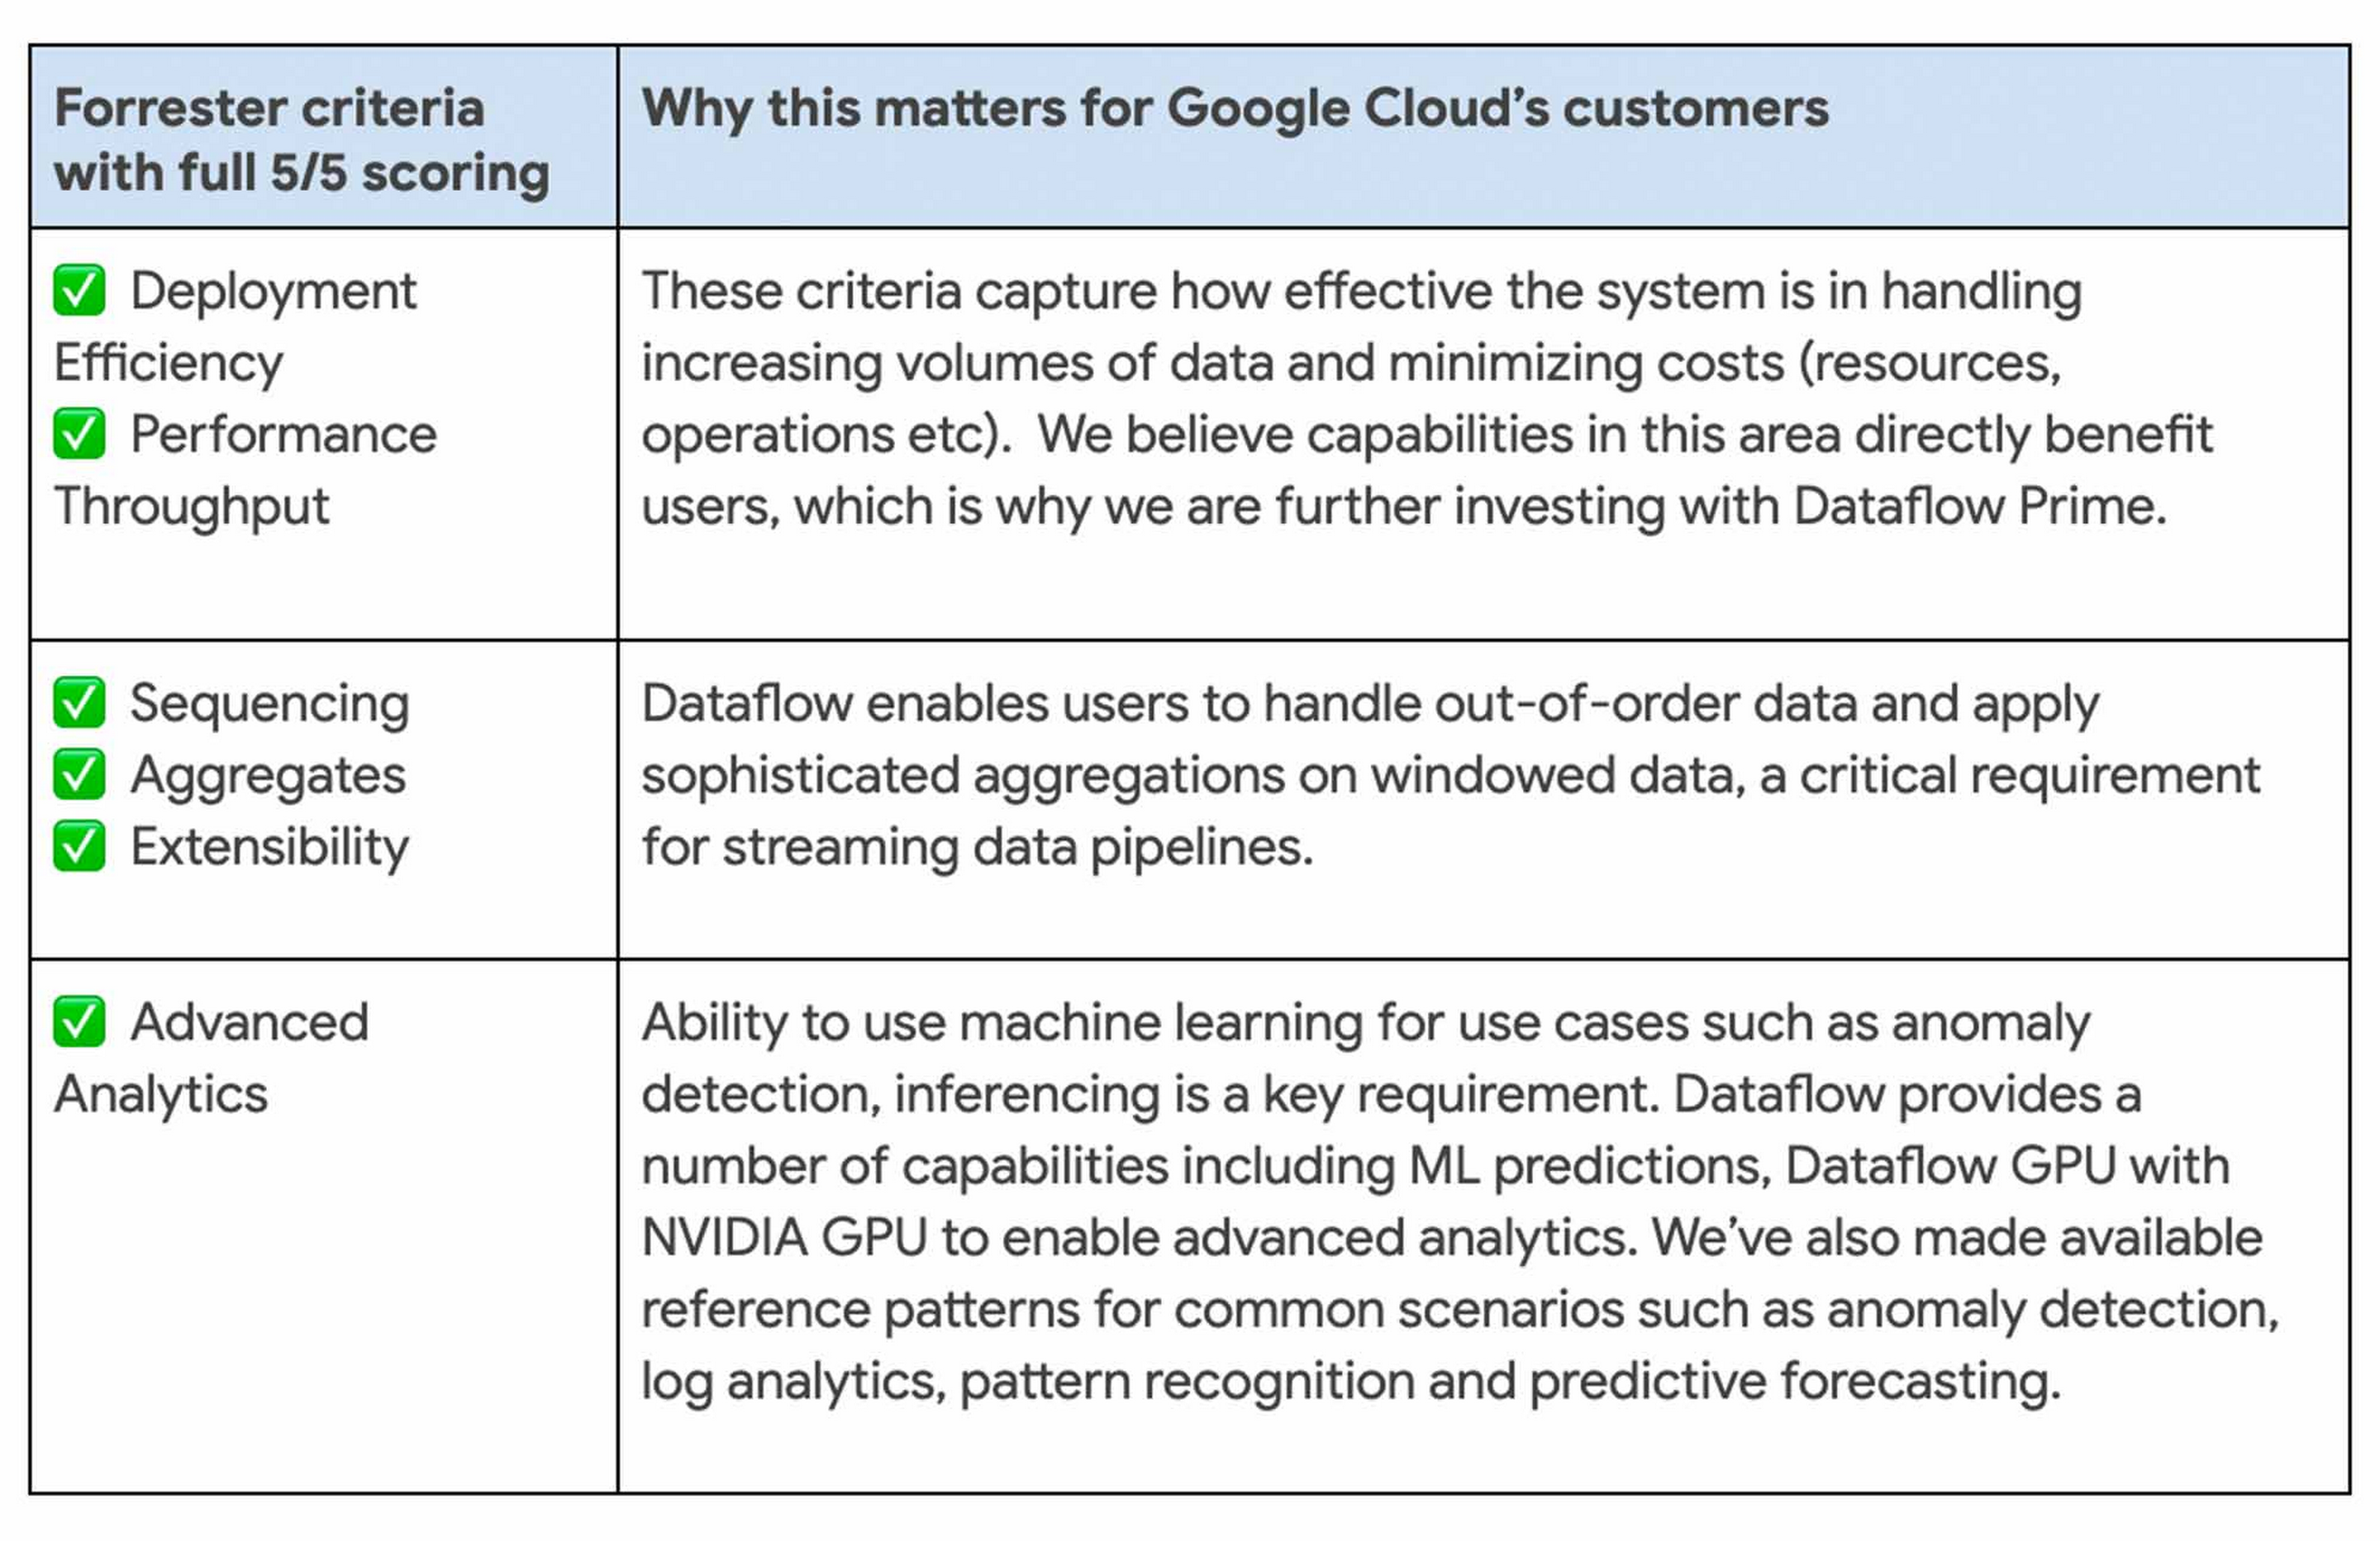
We continue to be focused on solving problems that matter to you. For example, just in the last month we announced Dataflow Prime and Auto Sharding for BigQuery – two new auto tuning capabilities that bring efficiency and simplicity to your streaming pipelines.
Dataflow achieves highest score possible in strategy
With Google, organizations gain an industry leading product and a partner that has the vision and strategy to help you tackle new business challenges and provide delightful experiences to your customers.

In summary, we are honored to be a Leader in The Forrester Wave™, Streaming Analytics, and look forward to continuing to innovate and partner with you on your digital transformation journey.
Download the full report: The Forrester Wave™: Streaming Analytics, Q2 2021 and check out these smart analytics reference patterns. To learn more about Dataflow, visit our website and get to know the product by taking an interactive tutorial. You can also watch recordings from the Data Cloud Summit event (May 2021), where we provided an in-depth view of new product innovations in Dataflow and other data analytics products.
Migrating Hadoop to Dataproc by LiveRamp: Best Practices
2885
Of your peers have already read this article.
3:30 Minutes
The most insightful time you'll spend today!
Abstract
In this blog, we describe our journey to the cloud and share some lessons we learned along the way. Our hope is that you’ll find this information helpful as you go through the decision, execution, and completion of your own migration to the cloud.
Introduction
LiveRamp is a data enablement platform powered by identity, centered on privacy, integrated everywhere. Everything we do centers on making data safe and easy for businesses to use. Our Safe Haven platform powers customer intelligence, engages customers at scale, and creates breakthrough opportunities for business growth.
Businesses safely and securely bring us their data for enrichment and use the insights gained to deliver better customer experiences and generate more valuable business outcomes. Our fully interoperable and neutral infrastructure delivers end-to-end addressability for the world’s top brands, agencies, and publishers. Our platforms are designed to handle the variability and surge of the workload and guarantee service-level agreements (SLAs) to businesses.
We process petabytes of batch and streaming data daily. We ingest, process (join and enhance), and distribute this data. We receive and distribute data from thousands of partners and customers on a daily basis. We maintain the world’s largest and most accurate identity graph and work with more than 50 leading demand-side and supply-side platforms.
Our decision to migrate to Google Cloud and Dataproc
As an early adopter of Apache Hadoop, we had a single on-prem production managed Hadoop cluster that was used to store all of LiveRamp’s persistent data (HDFS) and run the Hadoop jobs that make up our data pipeline (YARN). The cluster consisted of around 2500 physical machines with a total of 30PB or raw storage, ~90,000 vcores, and ~300TB of memory. Engineering teams managed and ran multiple MapReduce jobs on these clusters.
The sheer volume of applications that LiveRamp ran on this cluster caused frequent resource contention issues, not to mention potentially widespread outages if an application was tuned improperly. Our business was scaling and we were running into constraints related to data center space and power in our on-premises environment. These constraints restricted our ability to meet our business objectives so a strategic decision was made to leverage elastic environments and migrate to the cloud. The decision required financial analysis and a detailed understanding of the available options, from do-it-yourself and vendor-managed distributions to leveraging cloud-managed services.
LiveRamp’s target architecture
We ultimately chose Google Cloud and Dataproc, a managed service for Hadoop, Spark, and other big data frameworks. During the migration we made a few fundamental changes to our Hadoop infrastructure:
Instead of 1 large persistent cluster managed by a central team, we have decentralized the cluster ownership to individual teams. This gave the teams flexibility to recreate, perform upgrades or change configurations as they see fit. This also gives us better cost attribution, less blast radius for errors, and less chance that – a rogue job from one team will impact the rest of the workloads.
Persistent data is no longer stored in HDFS on the clusters, it is in Google Cloud Storage, which, conveniently, served as a drop in replacement, as GCS is compatible with all the same APIs as HDFS. This means we can delete all the virtual machines that are part of the cluster without losing any data.
Introduced autoscaling clusters to control compute cost, and to dramatically decrease request latency. On premise you’re paying for the machines so you might as well use them. Cloud compute is elastic so you want to burst when there is demand and scale down when you can.
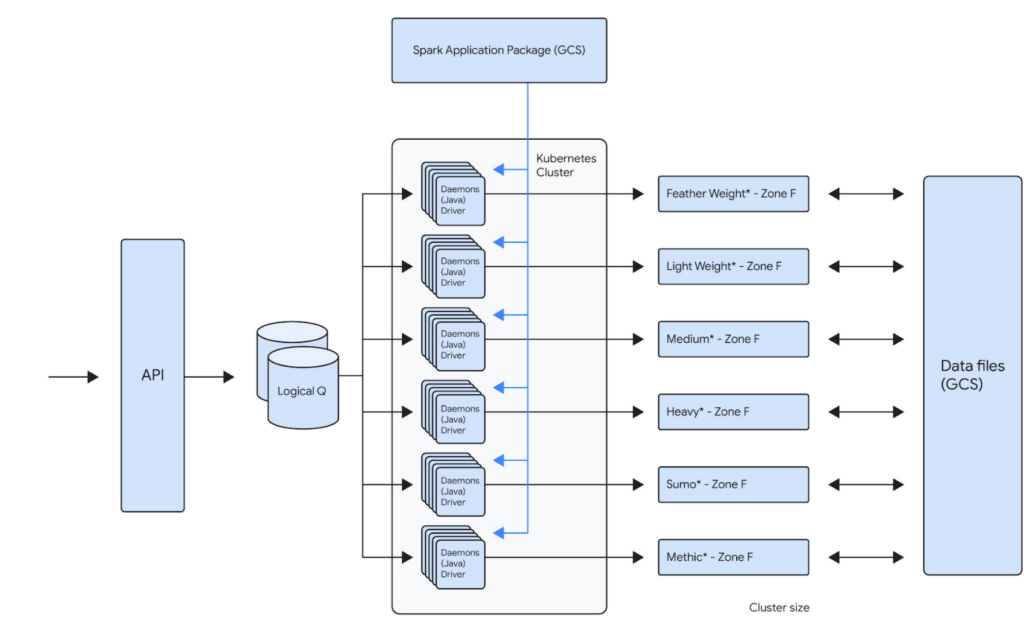
For example, one of our teams runs about 100,000 daily Spark jobs on 12 Dataproc clusters that each independently scale up to 1000 VMs. This gives that team a current peak capacity of about 256,000 cores. Because the team is bound to its own GCP Project inside of a GCP Organization, the cost attributed to that team is now very easy to report. The team uses architecture represented below to distribute the jobs across the clusters. This architecture allows them to bin similar workloads together so that they can be optimized together. Below is the logical architecture of the above workload:
Our approach
Overall migration and post migration stabilization/optimization of the largest of our workloads took us about several years to complete. We broadly broke down the migration into multiple phases.
Initial Proof-Of-Concept
When analyzing solutions for cloud-hosted big data services, any product had to meet our clear acceptance criteria:
- Cost: Dataproc is not particularly expensive compared to similar alternatives, but our discount with the existing managed Hadoop partner made it expensive. We have initially accepted that the cost would remain the same. We did see cost benefits post migration, after several rounds of optimizations.
- Features: Some key features (compared to current state) that we were looking for are built-in autoscaler, ease of creating/updating/deleting clusters, managed big data technologies etc.
- Integration with GCP: As we had already decided to move other LiveRamp-owned services to GCP, a big data platform with robust integration with GCP was a must. Basically, we’d like to be able to leverage GCP features without a lot of effort on our end (custom vms, preemptible vms, etc).
- Performance: Cluster creation, deletion, scale up, and scale down should be fast. This will allow teams to iterate and react quickly. These are some rough estimates of how fast the cluster operations should be:
- Cluster creation: <15 minutes
- Cluster Deletion: <15 minutes
- Adding 50 nodes: <20 minutes
- Removing 200 nodes: <10 minutes
- Reliability: Bug free and low downtime software that has concrete SLAs on clusters and a strong commitment to the correct functioning of all of its features.
An initial prototype to better understand Dataproc and Google Cloud helped us prove that target technologies and architecture will give us reliability and cost improvements. This also fed into our decisions around target architecture. This was then reviewed by the Google team before we embarked on the migration journey.
Overall migration
Terraform module
Our ultimate goal is to create self-service tooling that allows our data engineers to deploy infrastructure as easily and safely as possible. After defining some best practices around cluster creation and configuration, the central team’s first step was to build a terraform module that can be used by all the teams to create their own clusters. This module will create a dataproc cluster along with all supporting buckets, pods and datadog monitors:
- A dataproc cluster autoscaling policy that can be customized
- A dataproc cluster with LiveRamp defaults preconfigured
- Sidecar applications for recording job metrics from the job history server and for monitoring the cluster health
- Pre configured datadog cluster health monitors for alerting
This Terraform module is also composed of multiple supporting modules underneath. This allows users to call the supporting modules directly in your project terraform as well if such a need arises. The module can be used to create a cluster by just setting the parameters like project id, path to application source (Spark or Map/Reduce), subnet, VM instance type, auto scaling policy etc.
Workload migration
Based on our analysis of Dataproc, discussions with GCP team and the POC, we used following criteria:
- We prioritized applications that can use preemptibles to achieve cost parity to our existing workloads
- We prioritized some of our smaller workloads initially to build momentum within the organization. For example, we left the single workload that accounted for ~40% of our overall batch volume to the end, after we had gained enough experience as an organization.
- We combined the migration to Spark along with the migration to Dataproc. This has initially resulted in some extra dev work but helped reduce the effort for testing and other activities.
Our initial approach was to lift and shift from existing managed providers and Map/Reduce to Dataproc and Spark. We then later focused on optimizing the workloads for cost and reliability.
What’s working well
Cost Attribution
As is true with any business, it’s important to know where your cost centers are. Moving from a single cluster, made opaque by the number of teams loading work onto it, to GCP’s Organization/Project structure has made cost reporting very simple. The tool breaks down cost by project, but also allows us to attribute cost to a single cluster via tagging. As we sometimes deploy a single application to a cluster, this helps us to make strategic decisions on cost optimizations at an application level very easily.
Flexibility
The programmatic nature of deploying Hadoop clusters in a cloud like GCP dramatically reduces the time and effort involved in making infrastructure changes. LiveRamp’s use of a self-service Terraform module means that a data engineering team can very quickly iterate on cluster configurations. This allows a team to create a cluster that is best for their application while also adhering to our security and health monitoring standards. We also get all the benefits of infrastructure as code: highly complicated infrastructure state is version controlled and can be easily recreated and modified in a safe way.
Support
When our teams face issues with services that run on Dataproc, the GCP team is always quick to respond. They work very closely with LiveRamp to develop new features for our needs. They proactively provide LiveRamp with preview access to new features that help LiveRamp to stay ahead of the curve in the Data Industry.
Cost Savings
We have achieved around 30% cost savings in certain clusters by achieving the right balance between on-demand and PVMs. The cost savings were a result of our engineers building efficient A/B testing frameworks that helped us run the clusters/jobs in several configurations to arrive at the most reliable, maintainable and cost efficient configuration. Also, one of the applications is now 10x + faster.
Five lessons learned
Migration was a successful exercise that took about six months to complete, across all our teams and applications. While many aspects went really well, we also learned a few things along the way that we hope will help you when planning your own migration journey.
- Benchmark, benchmark, benchmark
It’s always a good idea to benchmark the current platform against the future platform to compare costs and performance. On-premises environments have a fixed capacity, while cloud platforms can scale to meet workload needs. Therefore, it’s essential to ensure that the current behavior of the key workload is clearly understood before the migration.
- Focus on one thing at a time
We initially focused on reliability while remaining cost-neutral during the migration process, and then focused on cost optimization post-migration. Google teams were very helpful and instrumental in identifying cost optimization opportunities.
- Be aware of alpha and beta products
Although there usually aren’t any guarantees of a final feature set when it comes to pre-released products, you can still get a sense of their stability and create a partnership if you have a specific use case. In our specific use case, Enhanced Flexibility Mode was in alpha stage in April 2019, beta in August 2020, and released in July 2021. Therefore, it was helpful to check in on the product offering and understand its level of stability so we could carry out risk analysis and decide when we felt comfortable adopting it.
- Think about quotas
Our Dataproc clusters could support much higher node counts than was possible with our previous vendor. This meant we often had to increase IP space and change quotas, especially as we tried out new VM and disk configurations.
- Preemptable and committed use discounts (CUDs)
CUDs make compute less expensive while preemptables make compute significantly less expensive. However, preemptibles don’t count against your CUD purchases, so make sure you understand the impact on your CUD utilization when you start to migrate to preemptables.
We hope these lessons will help you in your Data Cloud journey.
Mid-Sized B2B Firm Achieves the Business Trifecta with a Single Strategy

6916
Of your peers have already read this article.
2:45 Minutes
The most insightful time you'll spend today!
Thirteen years’ experience in e-commerce has given Teddy Chan, Chief Executive Officer and Chief Technology Officer, AfterShip, a deep understanding of the challenges of shipping and tracking packages to customers worldwide.
“The key problem many merchants face is customers asking ‘where is my order?’ and ‘when I will get the package?’” Chan says. “When I considered this issue, I came up with the idea of AfterShip.” Chan helped found AfterShip in 2011 to enable merchants to keep track of packages sent to customers via a web portal or an API. AfterShip also allows merchants to notify customers of anticipated delivery times.
“Using AfterShip, merchants can provide the same experience to buyers regardless of which couriers they use,” Chan says. “Merchants can also improve their customer engagement by including up-selling or marketing content with their delivery notifications.”
Hong Kong-headquartered AfterShip continues to grow quickly and now has a 40-person team. Thirty members of this team are based on the China special administrative region and 10 are based in India.
“Google Cloud Platform has a network of global datacentres with deep connectivity that enables us to put our infrastructure close to our customers. In addition, the ability to horizontally scale our global database using tools such as Google Cloud Spanner eliminates any limits on our geographic expansion.”
—Teddy Chan, Chief Executive Officer and Chief Technology Officer, AfterShip
By October 2017, the business was tracking about 30 million packages per month and had expanded its services to include label and rate calculation and self-service return. Revenue, package transaction numbers and team size have doubled every year for the past three years, while more than 300,000 merchants and 426 couriers are signed up to the service. Key customers include Wish, Etsy and Groupon.
Close to half AfterShip’s customers are based in the United States, about one third in Europe and the remainder are located in Asia. AfterShip had initially delivered its applications and services from an incumbent public cloud service. However, the company wanted to continue its growth trajectory while automating key infrastructure processes, implementing a continuous deployment model and controlling costs.
The business needed to achieve these objectives while maintaining a global presence and high-quality service. AfterShip started reviewing its options and decided to migrate to Google Cloud Platform (GCP). “Google Cloud Platform has a network of global datacentres with deep connectivity that enables us to place our infrastructure close to our customers,” Chan says.
“In addition, the ability to horizontally scale our global database using tools such as Google Cloud Spanner eliminates any limits to our geographic expansion. Furthermore, the managed services provided through GCP would allow us to focus on building better features for online merchants.” The reliability provided by GCP would also enable AfterShip to meet the stringent service level requirements of large digital marketplaces in the United States, Asia and elsewhere.
“Google Cloud Platform could manage the high volumes and enable us to deliver the service levels that would realise our ambition of becoming the number one tracking API platform in the world,” Chan says. “For example, with Google Cloud Platform, we can provide a 99.95% monthly uptime service level to our customers.” Finally, GCP provided managed solutions, including Google Kubernetes Engine powered by open source container orchestrator Kubernetes, that would enable AfterShip to automate processes such as scaling and enable its team to focus on developing applications.
AfterShip has moved its websites into GCP infrastructure in three datacentres around the world and anticipates completing the migration in Q4 2017. “Google provided a lot of assistance, particularly early in the project when we needed it,” Chan says. “They briefed us on several services we hadn’t known about that could replace the equivalents in the public cloud we were using previously.” The business then completed the migration using its own skilled team members. As well as Google Kubernetes Engine and Google Cloud Spanner, AfterShip is using Google BigQuery to store and analyse transaction information.
“Google Cloud Platform could manage the high volumes and enable us to deliver the service levels that would realise our ambition of becoming the number one tracking API platform in the world.”
—Teddy Chan, Chief Executive Officer and Chief Technology Officer, AfterShip
Deployment times down from one hour to two minutes
With deployment times falling from up to one hour in its previous cloud environment to about two minutes in GCP, AfterShip has been able to adopt a continuous deployment model. “This has improved our service levels,” Chan says. “If there are any issues we can fix them quickly, while we can iterate faster to create new features in response to customer requests or changes in the market. “This enables us to continue to lead our competitors.”
Targeting a 30 percent reduction in costs
AfterShip is now targeting a 30% reduction in costs by optimising its use of Docker containerisation technology on GCP.
“By using Docker with Kubernetes, we have been able to fine-tune our use of compute resources and better control our costs,” Chan says. “We’re extremely pleased with Google Cloud Platform as it really is built for engineers,” he adds. “In addition, its documentation is extremely clear, allowing us to troubleshoot or carry out activities on the platform ourselves. “We look forward to continuing to grow and extend our package tracking and associated services with Google Cloud Platform.”
Google Cloud Migration Speeds Up The New York Times’ Journey to New Normal
5804
Of your peers have already read this article.
2:30 Minutes
The most insightful time you'll spend today!
Like virtually every business across the globe, The New York Times had to quickly adapt to the challenges of the coronavirus pandemic last year. Fortunately, our data system with Google Cloud positioned us to perform quickly and efficiently in the new normal.
How we use data
We have an end-to-end type of data platform; on one side we work very closely with our product teams to collect the right level of data that they’re interested in, such as which articles people are reading, and how long they’re staying onsite. We frequently measure our audience to understand our user segments, and how they come onsite or use our apps. We then provide that data to analysts for end-to-end analytics.
On the other side, the newsroom is also focused on audience, and we build tools to help them understand how Google Search or different social promotions play a role in a person’s decision to read The New York Times, and also to get a better sense of their behavior on our pages. With this data, the newsroom can make decisions about information that should be displayed on our homepage or in push notifications.
Ultimately, we’re interested in behavioral analytics—how people engage with our site and our apps. We want to understand different behavioral patterns, and which factors or features will encourage users to register and subscribe with us.
We also use data to create or curate preferences around personalization, to ensure we’re delivering to our users fresh content, or content that they may not have normally read. Likewise, our data also gets used in our targeting system, so that we can send out the right messaging about our various subscription packages to the right users.
Choosing to migrate to Google Cloud
When I came to The New York Times over five years ago, our data architecture was not working for us. Our infrastructure was gathering data that proved harder for analysts to crunch on a daily basis. We were also hitting hang ups with how that data was streaming into our system and environment. Back then we’d run a query and then go grab some coffee, hoping that the query would finish or give us the right data by the time we came back to our desks. Sometimes it would, sometimes it wouldn’t.
We realized that Hadoop was definitely not going to be the on-premises solution for us, and that’s when we started talking with the Google Cloud team. We began our digital transformation with a migration to BigQuery, their fully managed, serverless database warehouse. We were under a pretty aggressive migration timeline, focusing first on moving over analytics. We made sure our analysts got a top-of-the-line system that treated them the way that they themselves would want to treat the data.
One significant prominent requirement in our data architecture choice was to enable analysts to be able to work as quickly as they needed to provide high-quality deliverables for their business partners. For our analysts, the transition to BigQuery was night and day. I still remember when my manager ran his very first query on BigQuery and was ready to go grab his coffee, but the query finished by the time he got up from his chair. Our analysts talk about that to this day.
While we were doing the BigQuery transition, we did have concerns about our other systems not scaling correctly. Two years ago, we weren’t sure we’d be able to scale up to the audience we expected on that election day. We were able to band-aid a solution back then, but we knew we only had two more years to figure out a real, dependable solution.
During that time, we moved our streaming pipeline over to Google Cloud, primarily using App Engine, which has been a flexible environment that enabled quick scaling changes and requirements as needed. Dataflow and Pub/Sub also played significant roles in managing the data. In Q4 of 2020 we had our most significant traffic ever recorded, at 273 million global readers, and four straight days of the highest traffic we’ve had compared to other election weeks. We were proud to see that there was no data loss.
A couple of years ago, on our legacy system, I was up until three in the morning one night trying to keep data running for their needs. This year, for election night, I relaxed and ate a pint of ice cream because I was able to more easily manage our data environment, allowing us to set and meet higher expectations for data ingestion, analysis and insight among our partners in the newsroom.
How COVID-19 changed our 2020 roadmap
The coronavirus pandemic definitely wasn’t on my team’s roadmap for 2020, and it’s important to mention here that The New York Times is not fundamentally a data company. Our job is to get the news out to our users every single day in paper, on apps, and onsite. Our newsroom didn’t expect the need to build out a giant coronavirus database that would enrich the news they share every day.
Our newsroom moves quickly, and our engineers have built one of the most comprehensive datasets on COVID-19 in the U.S. With Google, The New York Times decided to make our data publicly available on BigQuery Google’s COVID-19 public dataset. Check out this webinar for more details on our evolution architecture:https://www.youtube.com/embed/mtNlrFpschU?enablejsapi=1&
Flexible approach
We have many different teams that work within Google Cloud, and they’ve been able to pick from the range of available services and tailor project requirements keeping those tools available in mind.
One challenge we think about with the data platform at The New York Times is determining the priorities of what we build. Our ability to engage with product teams at Google though the Data Analytics Customer Council allows us to see into the BigQuery roadmap, or the data analytics roadmap, and plays a significant role in determining where we focus our own development. For example, we’ve built tools like our Data Reporting API, which reads data directly from BigQuery, in order to take advantage of tools like BigQuery BI Engine. This approach encourages our analysts to be better managers of their domains around dimensions and metrics, but not have to focus on building caching mechanisms of their data. Getting that kind of clarity helps us plan how to build The New York Times in the new normal and beyond.
If you are interested to learn more about the data teams at the New York Times, take a look at our open tech roles here and you’ll find many interesting articles at NYT data blog.
Data Culture Integral for Building Data Platforms in EdTech Firms

5034
Of your peers have already read this article.
2:00 Minutes
The most insightful time you'll spend today!
With a data strategy and data warehouse in place, EdTechs are building a data culture that helps everyone – from educators and administrators, to employees in marketing and accounting – make more informed decisions with their data.
So how do you build a data culture in your organization? It starts by asking these questions:
- Are users able to find answers to their data questions from available data?
- Can they act based on available metrics?
- Can they tell a compelling story with the data at hand?
How well is your company using analytics? The matrix from Looker’s Analytical Maturity eBook, shows ranges from “vanity” (nice to see) metrics to “optimization.”

Adopting and rolling out your organization’s new data platform
As outlined in the previous blog in this series, From data chaos to data-driven: How dedicated data teams can help EdTechs influence the future of education, a comprehensive data team is essential for building a data warehouse. That data team should include a core education intelligence team. This team can align with analytically savvy members of each department they support. It’s critical that the Education Intelligence team understand each department’s reporting needs and can make adjustments based on user feedback.
Include these key components to ensure smooth adoption for internal teams:
- Share a roadmap: An effective rollout team always knows what’s next on their roadmap and communicates that to the entire organization. Launching analytics across an entire company at once usually leads to slow movement, miscommunication, and lack of adoption. A roadmap will ease this transition.
- Train everyone: This approach makes sure everyone is consistent during the data rollout. Show users how to make the most of the platform your data team has created, and be sure they know where they can go for help.
- Monitor and optimize: Monitor your organization’s analytics usage. Understand which individuals are using your education intelligence system to drive their day-to-day operations. These individuals can provide further insight into what is working. Identifying those who may need more guidance and support ensures they don’t miss out on benefits.
Guild Education: Creating a data culture
Guild Education started working with Google Cloud to build a data culture and implemented Looker as their data platform.
The company transformed their student success program—in which coaches work directly with connected employees throughout their educational journey—with Looker. “As enrollments increased, even spreadsheets were not able to accurately keep track of caseloads,” Sean McKeever, Senior Business Intelligence Analyst, recalls. “We needed a singular source of truth that could be updated in almost real-time.” In response, they created “Student Rosters” to manage a coach’s student outreach.
Users were thrilled with the new tools, and when the coaching team grew from 20 to 90, Sean created ambassador groups consisting of data specialists to support each department. This sparked Guild Education’s “data-driven evolution.”
“Unexpectedly, the Student Success task force also became an engine for new BI work,” Sean says. “They blew my highest expectations out of the water and started owning virtually the entire process: building requirements, prototyping, testing, and deploying new dashboards and panels—with hardly any help from the BI team.”
These successes have set Guild Education on its way to becoming a fully data-driven company. Unexpectedly, the Student Success task force also became an engine for new BI work…they blew my highest expectations out of the water and started owning virtually the entire process…with hardly any help from the BI team.
Sean McKeever
Senior Business Intelligence Analyst, Guild Education
Start your journey from data chaos to data-driven
We hope this three-part series has shown how data analytics has an important role to play in transforming the future of education. EdTech companies are unlocking the power of big data to serve their customers. “The education landscape is changing rapidly, and EdTech has a major role to play as institutions adapt to the massive shift in learners’ preferences and expectations,” says Jesus Trujillo Gomez, Strategic Business Executive, Education & Research, Google Cloud.
Feeling inspired? Let’s meet your EdTech challenges together and transform your data culture. Visit Google Cloud for education technology.
New Capabilities in BigQuery to Ease Anomalies Detection in the Absence of Labeled Data

6345
Of your peers have already read this article.
4:00 Minutes
The most insightful time you'll spend today!
When it comes to anomaly detection, one of the key challenges that many organizations face is that it can be difficult to know how to define what an anomaly is. How do you define and anticipate unusual network intrusions, manufacturing defects, or insurance fraud? If you have labeled data with known anomalies, then you can choose from a variety of supervised machine learning model types that are already supported in BigQuery ML. But what can you do if you don’t know what kind of anomaly to expect, and you don’t have labeled data? Unlike typical predictive techniques that leverage supervised learning, organizations may need to be able to detect anomalies in the absence of labeled data.
Today we are announcing the public preview of new anomaly detection capabilities in BigQuery ML that leverage unsupervised machine learning to help you detect anomalies without needing labeled data. Depending on whether or not the training data is time series, users can now detect anomalies in training data or on new input data using a new ML.DETECT_ANOMALIES function (documentation), with the following models:
- Autoencoder model, now in Public Preview (documentation)
- K-means model, already GA (documentation)
- ARIMA_PLUS time series model, already GA (documentation)
How does anomaly detection with ML.DETECT_ANOMALIES work?
To detect anomalies in non-time-series data, you can use:
- K-means clustering models: When you use
ML.DETECT_ANOMALIESwith a k-means model, anomalies are identified based on the value of each input data point’s normalized distance to its nearest cluster. If that distance exceeds a threshold determined by the contamination value provided by the user, the data point is identified as an anomaly. - Autoencoder models: When you use
ML.DETECT_ANOMALIESwith an autoencoder model, anomalies are identified based on the reconstruction error for each data point. If the error exceeds a threshold determined by the contamination value, it is identified as an anomaly.
To detect anomalies in time-series data, you can use:
- ARIMA_PLUS time series models: When you use
ML.DETECT_ANOMALIESwith an ARIMA_PLUS model, anomalies are identified based on the confidence interval for that timestamp. If the probability that the data point at that timestamp occurs outside of the prediction interval exceeds a probability threshold provided by the user, the datapoint is identified as an anomaly.
Below we show code examples of anomaly detection in BigQuery ML for each of the above scenarios.
Anomaly detection with a k-means clustering model
You can now detect anomalies using k-means clustering models, by running ML.DETECT_ANOMALIES to detect anomalies in the training data or in new input data. Begin by creating a k-means clustering model:
Language: SQL
CREATE MODEL `mydataset.my_kmeans_model`OPTIONS(MODEL_TYPE = 'kmeans',NUM_CLUSTERS = 8,KMEANS_INIT_METHOD = 'kmeans++') ASSELECT* EXCEPT(Time, Class)FROM`bigquery-public-data.ml_datasets.ulb_fraud_detection`;
With the k-means clustering model trained, you can now run ML.DETECT_ANOMALIES to detect anomalies in the training data or in new input data.
To detect anomalies in the training data, use ML.DETECT_ANOMALIES with the same data used during training:
Language: SQL
SELECT*FROMML.DETECT_ANOMALIES(MODEL `mydataset.my_kmeans_model`,STRUCT(0.02 AS contamination),TABLE `bigquery-public-data.ml_datasets.ulb_fraud_detection`);

To detect anomalies in new data, use ML.DETECT_ANOMALIES and provide new data as input:
Language: SQL
SELECT*FROMML.DETECT_ANOMALIES(MODEL `mydataset.my_kmeans_model`,STRUCT(0.02 AS contamination),(SELECT * FROM `mydataset.newdata`));

How does anomaly detection work for k-means clustering models?
Anomalies are identified based on the value of each input data point’s normalized distance to its nearest cluster, which, if exceeds a threshold determined by the contamination value, is identified as an anomaly. How does this work exactly? With a k-means model and data as inputs, ML.DETECT_ANOMALIES first computes the absolute distance for each input data point to all cluster centroids in the model, then normalizes each distance by the respective cluster radius (which is defined as the standard deviation of the absolute distances of all points in this cluster to the centroid). For each data point, ML.DETECT_ANOMALIES returns the nearest centroid_id based on normalized_distance, as seen in the screenshot above. The contamination value, specified by the user, determines the threshold of whether a data point is considered an anomaly. For example, a contamination value of 0.1 means that the top 10% of descending normalized distance from the training data will be used as the cut-off threshold. If the normalized distance for a datapoint exceeds the threshold, then it is identified as an anomaly. Setting an appropriate contamination will be highly dependent on the requirements of the user or business.
For more information on anomaly detection with k-means clustering, please see the documentation here.
Anomaly detection with an autoencoder model
You can now detect anomalies using autoencoder models, by running ML.DETECT_ANOMALIES to detect anomalies in the training data or in new input data.
Begin by creating an autoencoder model:
Language: SQL
CREATE MODEL `mydataset.my_autoencoder_model`OPTIONS(model_type='autoencoder',activation_fn='relu',batch_size=8,dropout=0.2,hidden_units=[32, 16, 4, 16, 32],learn_rate=0.001,l1_reg_activation=0.0001,max_iterations=10,optimizer='adam') ASSELECT* EXCEPT(Time, Class)FROM`bigquery-public-data.ml_datasets.ulb_fraud_detection`;
To detect anomalies in the training data, use ML.DETECT_ANOMALIES with the same data used during training:
Language: SQL
SELECT*FROMML.DETECT_ANOMALIES(MODEL `mydataset.my_autoencoder_model`,STRUCT(0.02 AS contamination),TABLE `bigquery-public-data.ml_datasets.ulb_fraud_detection`);

To detect anomalies in new data, use ML.DETECT_ANOMALIES and provide new data as input:
Language: SQL
SELECT*FROMML.DETECT_ANOMALIES(MODEL `mydataset.my_autoencoder_model`,STRUCT(0.02 AS contamination),(SELECT * FROM `mydataset.newdata`));

How does anomaly detection work for autoencoder models?
Anomalies are identified based on the value of each input data point’s reconstructed error, which, if exceeds a threshold determined by the contamination value, is identified as an anomaly. How does this work exactly? With an autoencoder model and data as inputs, ML.DETECT_ANOMALIES first computes the mean_squared_error for each data point between its original values and its reconstructed values. The contamination value, specified by the user, determines the threshold of whether a data point is considered an anomaly. For example, a contamination value of 0.1 means that the top 10% of descending error from the training data will be used as the cut-off threshold. Setting an appropriate contamination will be highly dependent on the requirements of the user or business.
For more information on anomaly detection with autoencoder models, please see the documentation here.
Anomaly detection with an ARIMA_PLUS time-series model

With ML.DETECT_ANOMALIES, you can now detect anomalies using ARIMA_PLUS time series models in the (historical) training data or in new input data. Here are some examples of when might you want to detect anomalies with time-series data:
Detecting anomalies in historical data:
- Cleaning up data for forecasting and modeling purposes, e.g. preprocessing historical time series before using them to train an ML model.
- When you have a large number of retail demand time series (thousands of products across hundreds of stores or zip codes), you may want to quickly identify which stores and product categories had anomalous sales patterns, and then perform a deeper analysis of why that was the case.
Forward looking anomaly detection:
- Detecting consumer behavior and pricing anomalies as early as possible: e.g. if traffic to a specific product page suddenly and unexpectedly spikes, it might be because of an error in the pricing process that leads to an unusually low price.
- When you have a large number of retail demand time series (thousands of products across hundreds of stores or zip codes), you would like to identify which stores and product categories had anomalous sales patterns based on your forecasts, so you can quickly respond to any unexpected spikes or dips.
How do you detect anomalies using ARIMA_PLUS? Begin by creating an ARIMA_PLUS time series model:
Language: SQL
CREATE OR REPLACE MODEL mydataset.my_arima_plus_modelOPTIONS(MODEL_TYPE='ARIMA_PLUS',TIME_SERIES_TIMESTAMP_COL='date',TIME_SERIES_DATA_COL='total_amount_sold',TIME_SERIES_ID_COL='item_name',HOLIDAY_REGION='US') ASSELECTdate,item_description AS item_name,SUM(bottles_sold) AS total_amount_soldFROM`bigquery-public-data.iowa_liquor_sales.sales`GROUP BYdate,item_nameHAVINGdate BETWEEN DATE('2016-01-04') AND DATE('2017-06-01')AND item_name IN ("Black Velvet", "Captain Morgan Spiced Rum","Hawkeye Vodka", "Five O'Clock Vodka", "Fireball Cinnamon Whiskey");
To detect anomalies in the training data, use ML.DETECT_ANOMALIES with the model obtained above:
Language: SQL
SELECT*FROMML.DETECT_ANOMALIES(MODEL `mydataset.my_arima_plus_model`,STRUCT(0.8 AS anomaly_prob_threshold));

To detect anomalies in new data, use ML.DETECT_ANOMALIES and provide new data as input:
Language: SQL
WITHnew_data AS (SELECTdate,item_description AS item_name,SUM(bottles_sold) AS total_amount_soldFROM`bigquery-public-data.iowa_liquor_sales.sales`GROUP BYdate,item_nameHAVINGdate BETWEEN DATE('2017-06-02')AND DATE('2017-10-01')AND item_name IN ('Black Velvet','Captain Morgan Spiced Rum','Hawkeye Vodka',"Five O'Clock Vodka",'Fireball Cinnamon Whiskey') )SELECT*FROMML.DETECT_ANOMALIES(MODEL `mydataset.my_arima_plus_model`,STRUCT(0.8 AS anomaly_prob_threshold),(SELECT*FROMnew_data));

For more information on anomaly detection with ARIMA_PLUS time series models, please see the documentation here.
Thanks to the BigQuery ML team, especially Abhinav Khushraj, Abhishek Kashyap, Amir Hormati, Jerry Ye, Xi Cheng, Skander Hannachi, Steve Walker, and Stephanie Wang.
More Relevant Stories for Your Company




Pega Systems Migrates SAP Servers to Google Cloud in Just 9 Weeks!
Pega Systems' financial data on SAP environs were on a hosting platform that lacked agility. By moving nearly 30 SAP servers to Google Cloud in just 9 weeks, Pega Systems was able to unlock data and integrate BigQuery into SAP HANA to deliver personalization for clients and embark on an

Over 700 SaaS Companies Trust Google’s Data Cloud to Build Intelligent Apps!
Today, a typical enterprise uses over 100 SaaS applications while large organizations commonly use over 400 apps. These applications contain valuable data on customers, suppliers, employees, products and more, offering the potential for valuable insights and powerful workflows. However, in the past, this data has often remained siloed and underutilized,


The True Story of How HotStar Broke a World-Record–Thanks to Firebase and Google BigQuery
Hotstar, India’s largest video streaming platform with 150 million monthly active users around the world, provides live-streaming of TV shows, movies, sports, and news on the go. By using a combination of Firebase products together, Hotstar safely rolled out new features to its watch screen during a major live-streaming event


An Overview of Google’s Data Cloud
Data access, management and privacy has been at the center of priorities for enterprises that are aiming to be more agile, reliable and data-driven. Google Cloud's technology innovations spanning products like BigQuery, Spanner, Looker and VertexAI help organizations navigate the complexities related to siloed data in large volumes sprawled across
