





Google Cloud’s Metric Scope Makes Multi-project Monitoring Simple

4749
Of your peers have already read this article.
2:00 Minutes
The most insightful time you'll spend today!
Customers need scale and flexibility from their cloud and this extends into supporting services such as monitoring and logging. Google Cloud’s Monitoring and Logging observability services are built on the same platforms used by all of Google that handle over 16 million metrics queries per second, 2.5 exabytes of logs per month, and over 14 quadrillion metric points on disk, as of 2020. However, you let us know through consistent feedback that the previous construct of Workspaces for Cloud Monitoring was not providing the flexibility needed for your larger scale projects.
Cloud Operation’s New Approach to Multi-Project Monitoring
We’re happy to announce a new model for multi-project monitoring, which replaces the concept of Workspaces. This overhaul is geared toward maximizing the flexibility you have to manage your monitoring environments by introducing Metrics Scopes. Starting today you can associate your Google Cloud projects with multiple Metrics Scopes! Like Workspaces, Metrics Scopes will still be used to store all of the configuration content for dashboards, alerting policies, uptime checks, notification channels, and group definitions. However there is no limit to the number of Metrics Scopes to which you can associate a project. Prior to this change, a project could only be scoped with a single Workspace. Now, there are virtually unlimited possibilities for how you can set up multi-project monitoring. This unlocks a large variety of options, from more granular permissions to mission-focused configurations. At its most simple implementation though: operators/SREs can now create org-wide Metrics Scopes with monitoring configurations focused on infrastructure health. And developers can leverage Metrics Scopes built on a subset of their organization’s projects that allow them to focus on their application’s performance.
How it works
- When you have a collection of projects, Metrics Scopes enable you to view each project’s metrics in isolation as well as in combination with metrics stored by other projects.
- The Metrics Scope is hosted by a scoping project. This scoping project is the Cloud project that is selected in the Cloud Console project picker.
Example
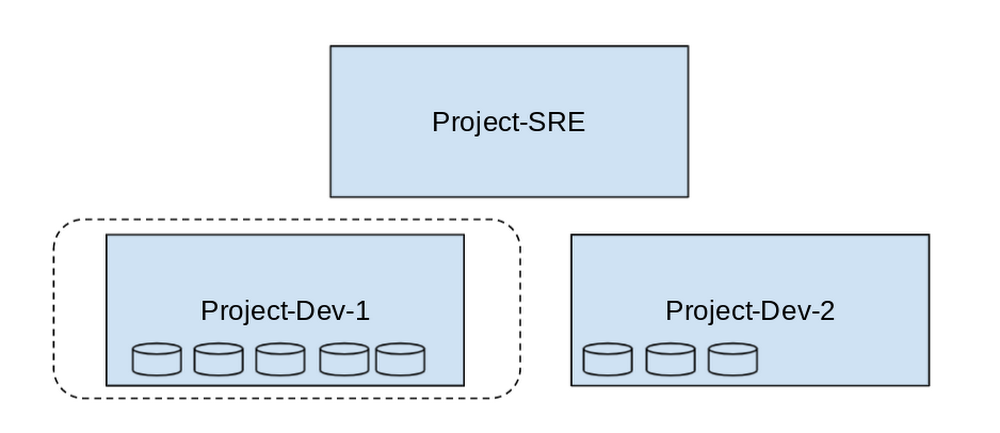
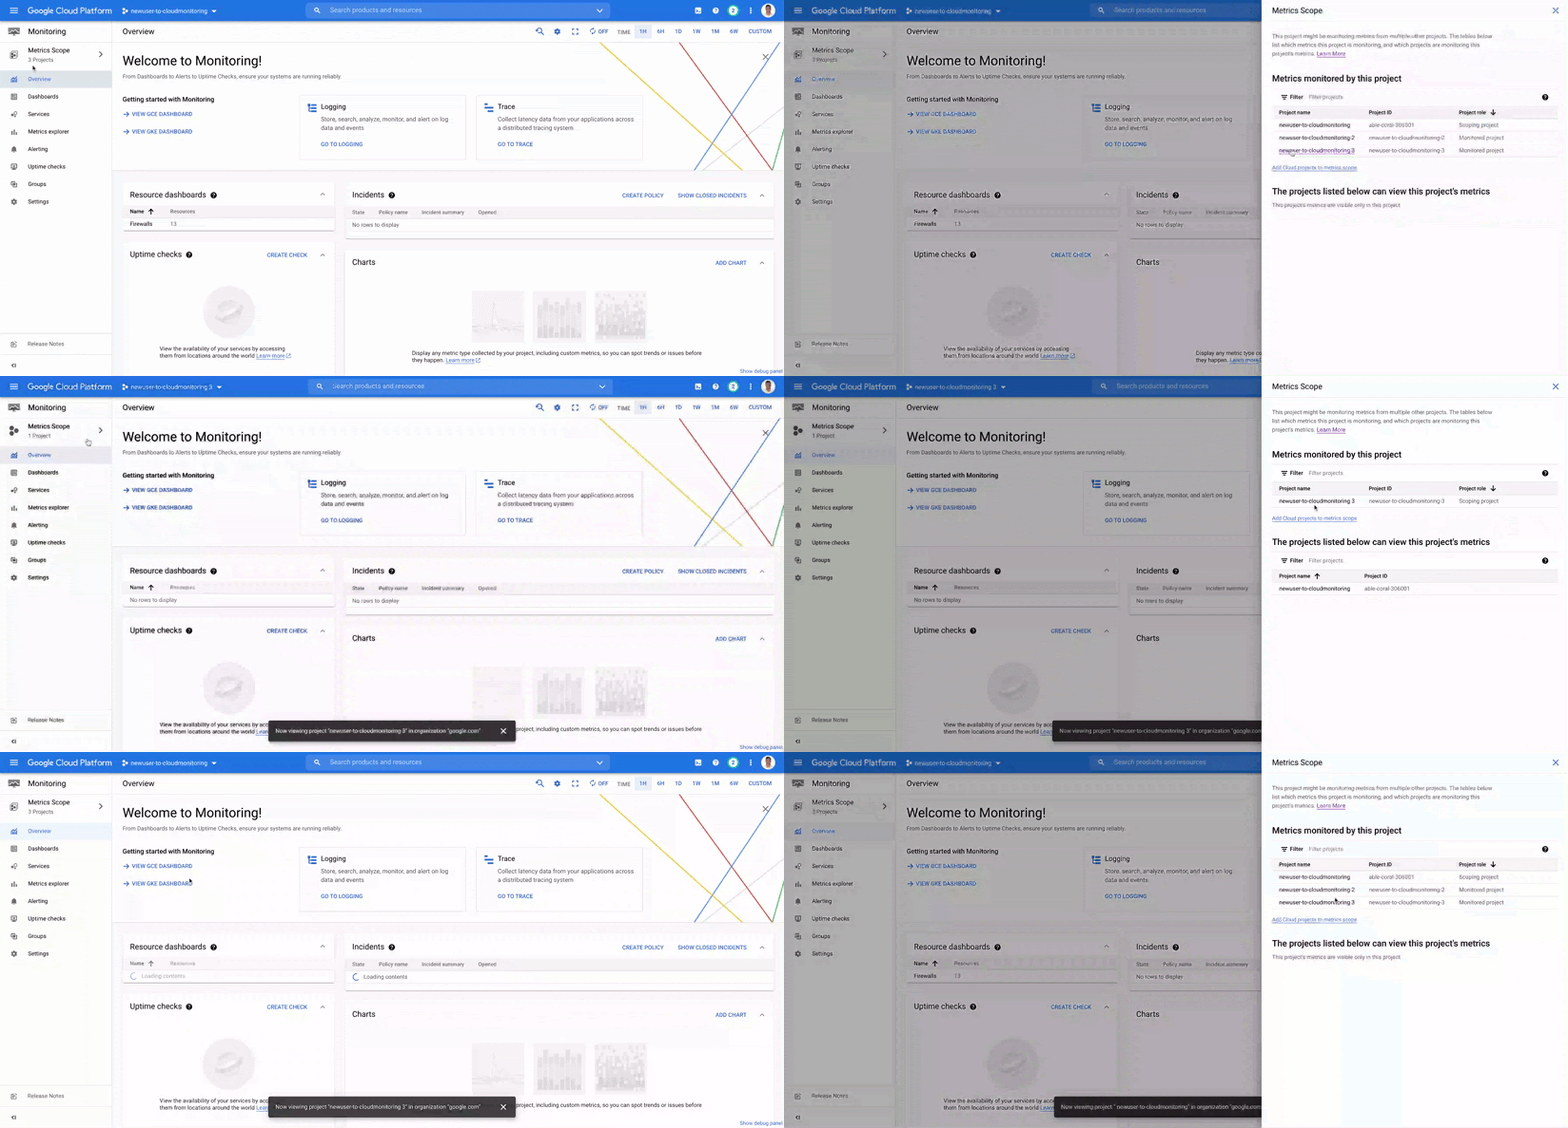
- In this example, Project-SRE is the name of a scoping project to monitor your fleet. You added two developer teams’ projects: Project-Dev-1 and Project-Dev-2, to Project-SRE’s Metrics Scope. If you select Project-SRE with the Cloud Console project picker and then go to the Monitoring page, you view the metrics for all three projects:

- If you select Project-Dev-1 with the Cloud Console project picker and then go to the Monitoring page, you view the Metrics Scope for Project-Dev-1 and you can only see the metrics for that project:
What else is new?
- Metrics Scopes can now monitor up to 375 projects (up from 100).
- New projects automatically start working in Cloud Monitoring without the previous 60-second Workspace creation process.
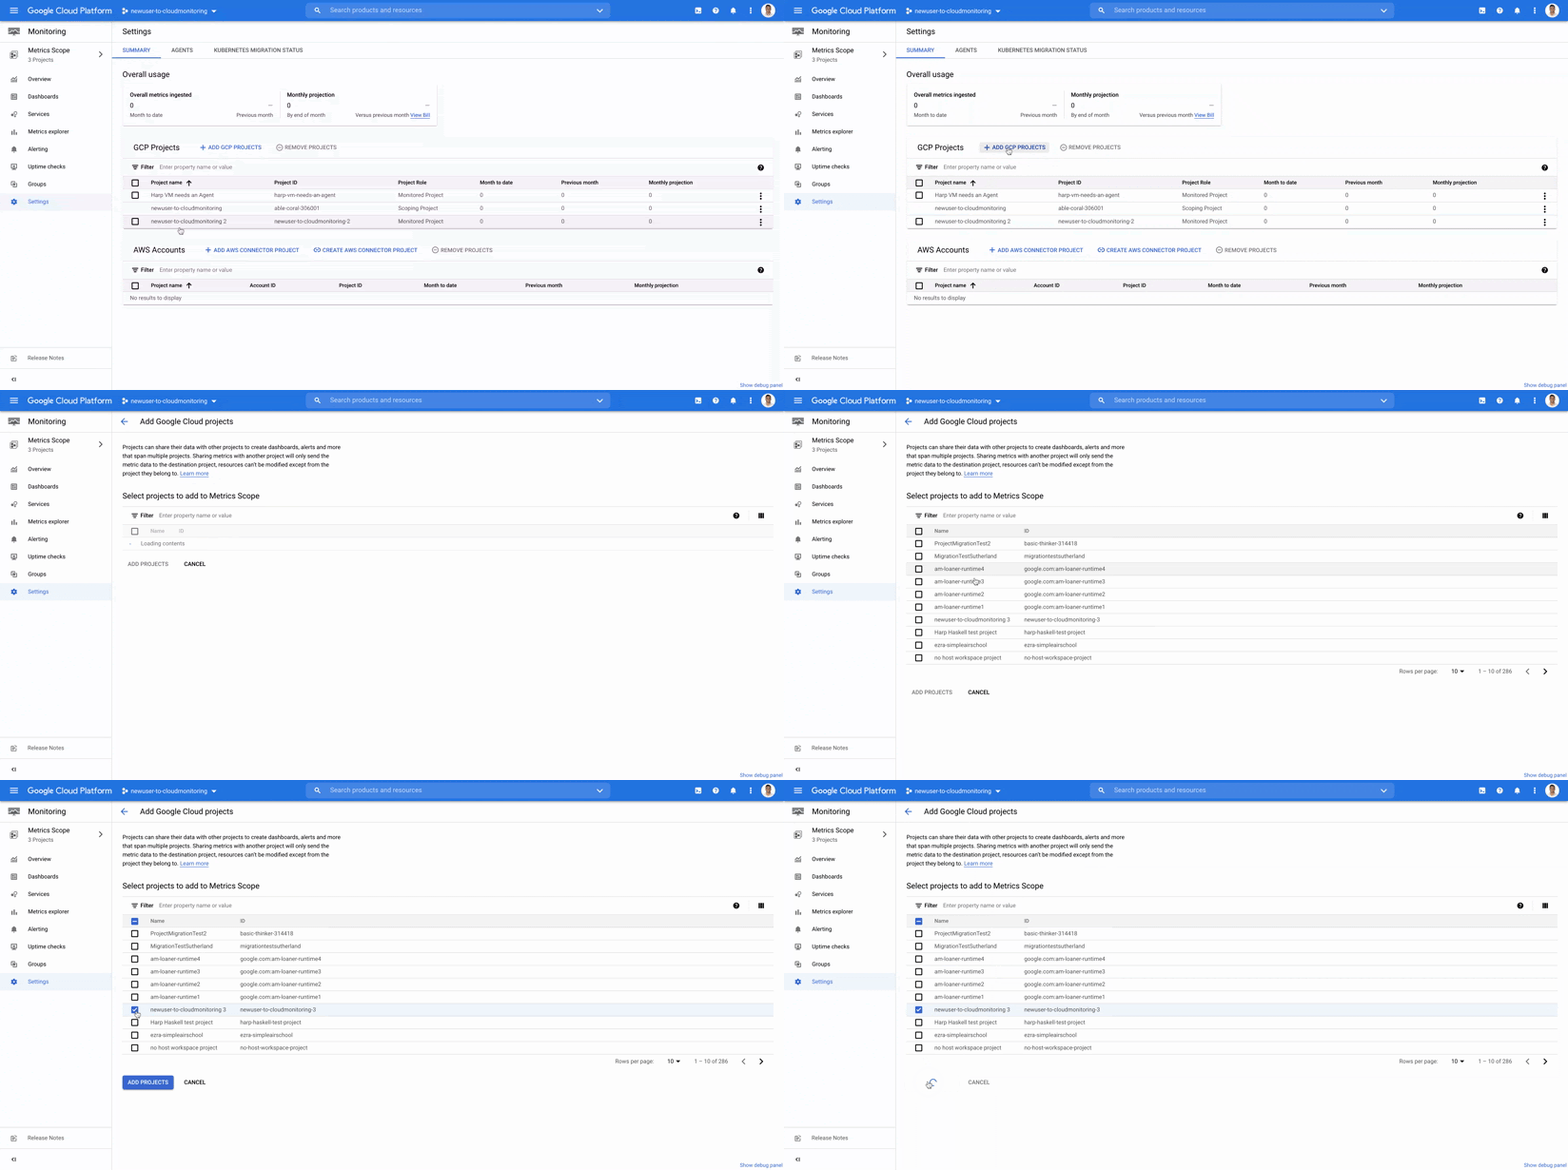
- If you want to monitor more than one project simply add it to your Metrics Scope:
Navigation
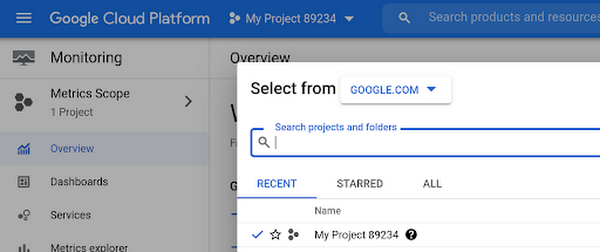
- Mentioned earlier, the Project Picker in the Cloud Console can be used to navigate between Metrics Scopes in Cloud Monitoring:
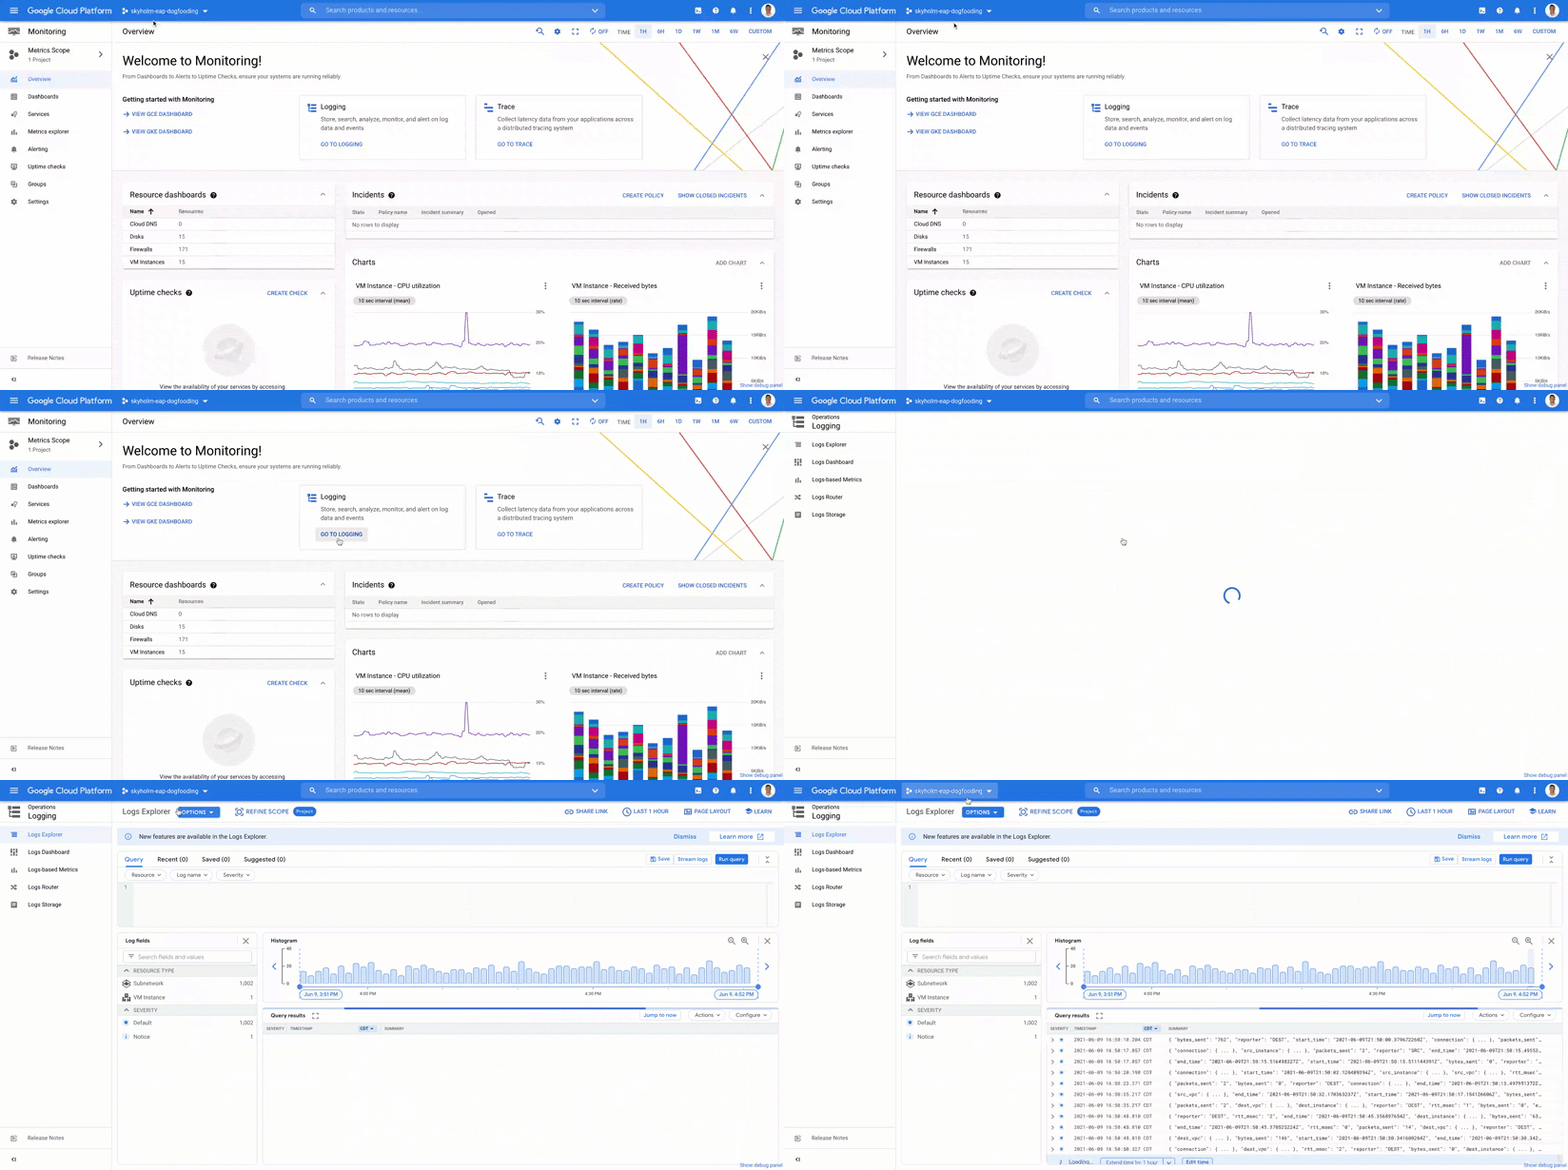
- This is now consistent with many other services across Google Cloud. Specifically, you can see how the project picker stays consistent when navigating from Cloud Monitoring to Cloud Logging:
- Additionally, to make your navigation between Metrics Scopes easy we’ve added the new Metrics Scope Tab and Panel in the UI:
Coming Soon
- The Metrics Scope API is coming within the next quarter! This API will enable you to programmatically manage your monitoring configurations and Metrics Scopes.
Current Workspaces users
If you are already using Workspaces in Cloud Monitoring you may have noticed that they converted to Metrics Scopes weeks ago. There is no additional action required and you can start taking advantage of the additional features of Metrics Scopes today.
Get Started
Companies that are digitally native or in the process of digital transformation have placed an increased operational role on developers and this often creates overlapping sets of responsibilities with Operations and SRE teams. Now multiple developer teams can focus on optimizing the performance of their applications while operators can take a fleet-wide view when maintaining and improving the performance of all of the infrastructure under their purview.For information on configuring a Metrics Scope to include metrics for multiple projects, see Viewing metrics for multiple projects.
A Record Breaking Calculation: 100 Trillion Digits of π on Google Cloud!

3570
Of your peers have already read this article.
4:00 Minutes
The most insightful time you'll spend today!
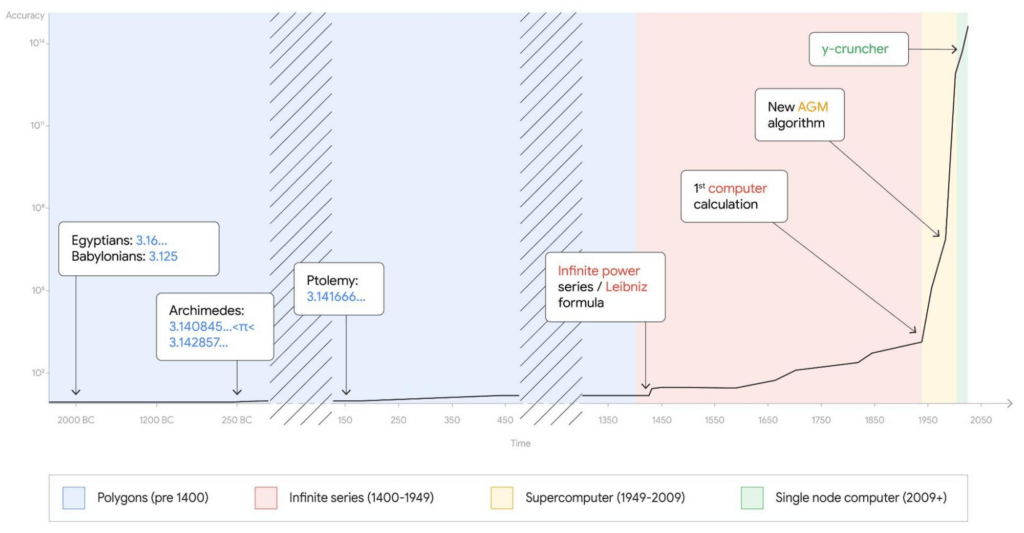
Records are made to be broken. In 2019, we calculated 31.4 trillion digits of π — a world record at the time. Then, in 2021, scientists at the University of Applied Sciences of the Grisons calculated another 31.4 trillion digits of the constant, bringing the total up to 62.8 trillion decimal places. Today we’re announcing yet another record: 100 trillion digits of π.
This is the second time we’ve used Google Cloud to calculate a record number1 of digits for the mathematical constant, tripling the number of digits in just three years.
This achievement is a testament to how much faster Google Cloud infrastructure gets, year in, year out. The underlying technology that made this possible is Compute Engine, Google Cloud’s secure and customizable compute service, and its several recent additions and improvements: the Compute Engine N2 machine family, 100 Gbps egress bandwidth, Google Virtual NIC, and balanced Persistent Disks. It’s a long list, but we’ll explain each feature one by one.
Before we dive into the tech, here’s an overview of the job we ran to calculate our 100 trillion digits of π.
- Program: y-cruncher v0.7.8, by Alexander J. Yee
- Algorithm: Chudnovsky algorithm
- Compute node: n2-highmem-128 with 128 vCPUs and 864 GB RAM
- Start time: Thu Oct 14 04:45:44 2021 UTC
- End time: Mon Mar 21 04:16:52 2022 UTC
- Total elapsed time: 157 days, 23 hours, 31 minutes and 7.651 seconds
- Total storage size: 663 TB available, 515 TB used
- Total I/O: 43.5 PB read, 38.5 PB written, 82 PB total
Architecture overview
Calculating π is compute-, storage-, and network-intensive. Here’s how we configured our Compute Engine environment for the challenge.
For storage, we estimated the size of the temporary storage required for the calculation to be around 554 TB. The maximum persistent disk capacity that you can attach to a single virtual machine is 257 TB, which is often enough for traditional single node applications, but not in this case. We designed a cluster of one computational node and 32 storage nodes, for a total of 64 iSCSI block storage targets.
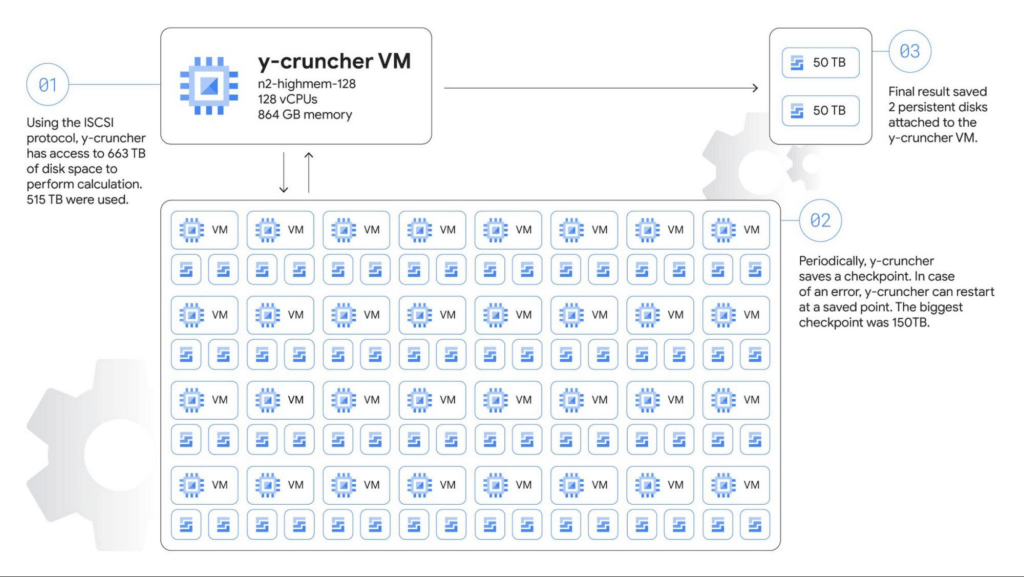
The main compute node is a n2-highmem-128 machine running Debian Linux 11, with 128 vCPUs and 864 GB of memory, and 100 Gbps egress bandwidth support. The higher bandwidth support is a critical requirement for the system as we adopted a network-based shared storage architecture.
Each storage server is a n2-highcpu-16 machine configured with two 10,359 GB zonal balanced persistent disks. The N2 machine series provides balanced price/performance, and when configured with 16 vCPUs it provides a network bandwidth of 32 Gbps, with an option to use the latest Intel Ice Lake CPU platform, which makes it a good choice for high-performance storage servers.
Automating the solution
We used Terraform to set up and manage the cluster. We also wrote a couple of shell scripts to automate critical tasks such as deleting old snapshots, and restarting from snapshots (we didn’t need to use this though). The Terraform scripts created OS guest policies to help ensure that the required software packages were automatically installed. Part of the guest OS setup process was handled by startup scripts. In this way, we were able to recreate the entire cluster with just a few commands.
We knew the calculation would run for several months and even a small performance difference could change the runtime by days or possibly weeks. There are also a number of combinations of parameters in the operating system, infrastructure, and application itself. Terraform helped us test dozens of different infrastructure options in a short time. We also developed a small program that runs y-cruncher with different parameters and automated a significant portion of the measurement. Overall, the final design for this calculation was about twice as fast as our first design. In other words, the calculation could’ve taken 300 days instead of 157 days!
The scripts we used are available on GitHub if you want to look at the actual code that we used to calculate the 100 trillion digits.
Choosing the right machine type for the job
Compute Engine offers machine types that support compute- and I/O-intensive workloads. The amount of available memory and network bandwidth were the two most important factors, so we selected n2-highmem-128 (Intel Xeon, 128 vCPUs and 864 GB RAM). It satisfied our requirements: high-performance CPU, large memory, and 100 Gbps egress bandwidth. This VM shape is part of the most popular general purpose VM family in Google Cloud.
100 Gbps networking
The n2-highmem-128 machine type’s support for up to 100 Gbps of egress throughput was also critical. Back in 2019 when we did our 31.4-trillion digit calculation, egress throughput was only 16 Gbps, meaning that bandwidth has increased by 600% in just three years. This increase was a big factor that made this 100-trillion experiment possible, allowing us to move 82.0 PB of data for the calculation, up from 19.1 PB in 2019.
We also changed the network driver from virtio to the new Google Virtual NIC (gVNIC). gVNIC is a new device driver and tightly integrates with Google’s Andromeda virtual network stack to help achieve higher throughput and lower latency. It is also a requirement for 100 Gbps egress bandwidth.
Storage design
Our choice of storage was crucial to the success of this cluster – in terms of capacity, performance, reliability, cost and more. Because the dataset doesn’t fit into main memory, the speed of the storage system was the bottleneck of the calculation. We needed a robust, durable storage system that could handle petabytes of data without any loss or corruption, while fully utilizing the 100 Gbps bandwidth.
Persistent Disk (PD) is a durable high-performance storage option for Compute Engine virtual machines. For this job we decided to use balanced PD, a new type of persistent disk that offers up to 1,200 MB/s read and write throughput and 15-80k IOPS, for about 60% of the cost of SSD PDs. This storage profile is a sweet spot for y-cruncher, which needs high throughput and medium IOPS.
Using Terraform, we tested different combinations of storage node counts, iSCSI targets per node, machine types, and disk size. From those tests, we determined that 32 nodes and 64 disks would likely achieve the best performance for this particular workload.
We scheduled backups automatically every two days using a shell script that checks the time since the last snapshots, runs the fstrim command to discard all unused blocks, and runs the gcloud compute disks snapshot command to create PD snapshots. The gcloud command returns and y-cruncher resumes calculations after a few seconds while the Compute Engine infrastructure copies the data blocks asynchronously in the background, minimizing downtime for the backups.
To store the final results, we attached two 50 TB disks directly to the compute node. Those disks weren’t used until the very last moment, so we didn’t allocate the full capacity until y-cruncher reached the final steps of the calculation, saving four months worth of storage costs for 100 TB.
Results
All this fine tuning and benchmarking got us to the one-hundred trillionth digit of π — 0. We verified the final numbers with another algorithm (Bailey–Borwein–Plouffe formula) when the calculation was completed. This verification was the scariest moment of the entire process because there is no sure way of knowing whether or not the calculation was successful until it finished, five months after it began. Happily, the Bailey-Borwein-Plouffe formula found that our results were valid. Woo-hoo! Here are the last 100 digits of the result:
4658718895 1242883556 4671544483 9873493812 1206904813
2656719174 5255431487 2142102057 7077336434 3095295560
You can also access the entire sequence of numbers on our demo site.
So what?
You may not need to calculate trillions of decimals of π, but this massive calculation demonstrates how Google Cloud’s flexible infrastructure lets teams around the world push the boundaries of scientific experimentation. It’s also an example of the reliability of our products – the program ran for more than five months without node failures, and handled every bit in the 82 PB of disk I/O correctly. The improvements to our infrastructure and products over the last three years made this calculation possible.
Running this calculation was great fun, and we hope that this blog post has given you some ideas about how to use Google Cloud’s scalable compute, networking, and storage infrastructure for your own high performance computing workloads. To get started, we’ve created a codelab where you can create and calculate pi on a Compute Engine virtual machine with step-by-step instructions. And for more on the history of calculating pi, check out this post on The Keyword. Here’s to breaking the next record!
- We are actively working with Guinness World Records to secure their official validation of this feat as a “World Record”, but we couldn’t wait to share it with the world. This record has been reviewed and validated by Alexander J. Yee, the author of y-cruncher.
Scope for Tech Adoption and Advancements in Healthcare are Still High: Google Cloud Research

5694
Of your peers have already read this article.
3:00 Minutes
The most insightful time you'll spend today!
Since the start of the COVID-19 pandemic, there’s been a rapid acceleration of digital transformation across the entire healthcare industry. Telehealth has become a more mainstream and safe way for patients and caregivers to connect. Machine learning modeling has helped speed up innovation and drug discovery. And new levels of integration and data portability have helped enable greater vaccine availability and equitable access to those who need it.
Data has been at the crux of this digital transformation — helping people stay healthy, accelerating life sciences research and delivering more personalized and equitable care. We recently unveiled partial results from our research with The Harris Poll, which revealed that nearly all physicians (95%) believe increased data interoperability will ultimately help improve patient outcomes. Today, we’re unveiling the second part of that research.
In February 2020, we commissioned The Harris Poll to survey 300 physicians in the U.S. about their biggest pain points — this was just before the COVID-19 pandemic strained the entire healthcare system and made us all hyper-aware of the risks we take in going to the hospital. In June 2021, we followed-up with those same questions and more. What it unveiled was just how much COVID-19 reshaped technology’s role in the healthcare field and how it’s changing day-to-day operations for physicians.
Here are some of the highlights:
Healthcare organizations accelerated technological upgrades over the course of the pandemic. After a year shaped primarily by the COVID-19 pandemic, use of telehealth saw substantial YOY growth, jumping nearly threefold from 32% in February 2020 to 90% this year. Forty-five percent of physicians say the COVID-19 pandemic accelerated the pace of their organization’s adoption of technology. In fact, more than 3 in 5 physicians (62%) say the pandemic has forced their healthcare organization to make technology upgrades that normally would have taken years. For example, 48% of physicians would like to have access to telehealth capabilities in the next five years. Before the COVID-19 pandemic, about half of physicians (53%) say their healthcare organization’s approach to the adoption of technology would best be described as “neutral” (i.e., willing to try new technologies only if they have been in the market for awhile or others have tried and recommended them).
Despite the technological leaps this year, most physicians still believe the industry lags behind in technology adoption but recognize the opportunity for technological support and advancement. The majority of physicians don’t view the healthcare industry as a leader when it comes to digital adoption. More than half of physicians describe the healthcare industry as lagging behind the gaming (64%), telecommunications (56%), and financial services industries (53%). However, the healthcare industry is not seen to be trailing as much as it was last year behind retail (54% in 2020; 44% in 2021); hospitality and travel (53% in 2020; 43% in 2021); and the public sector (39% in 2020; 26% in 2021).
Better interoperability alleviates physician burnout, improves health outcomes and speeds up diagnoses. The majority of physicians say increased data interoperability will cut the time to diagnosis for patients significantly (86%) and will ultimately help improve patient outcomes (95%.) In addition to better patient experiences and outcomes, more than half of physicians (54%) believe increased access to data via technology has had a positive impact on their healthcare organization overall. A majority believe that technology can alleviate the likelihood of physician “burn-out” (57%) and that efficient tools help decrease friction and stress (84%). And, as a result, 6 in 10 physicians say access to better technology and clinical data systems would allow them to have better work/life balance (60%) and that better access to/more complete patient data would reduce administrative burdens (61%). It is therefore not surprising that nearly 9 in 10 physicians (89%) say they are increasingly looking for ways to bring together all patient data into a single place for a more complete view of health.
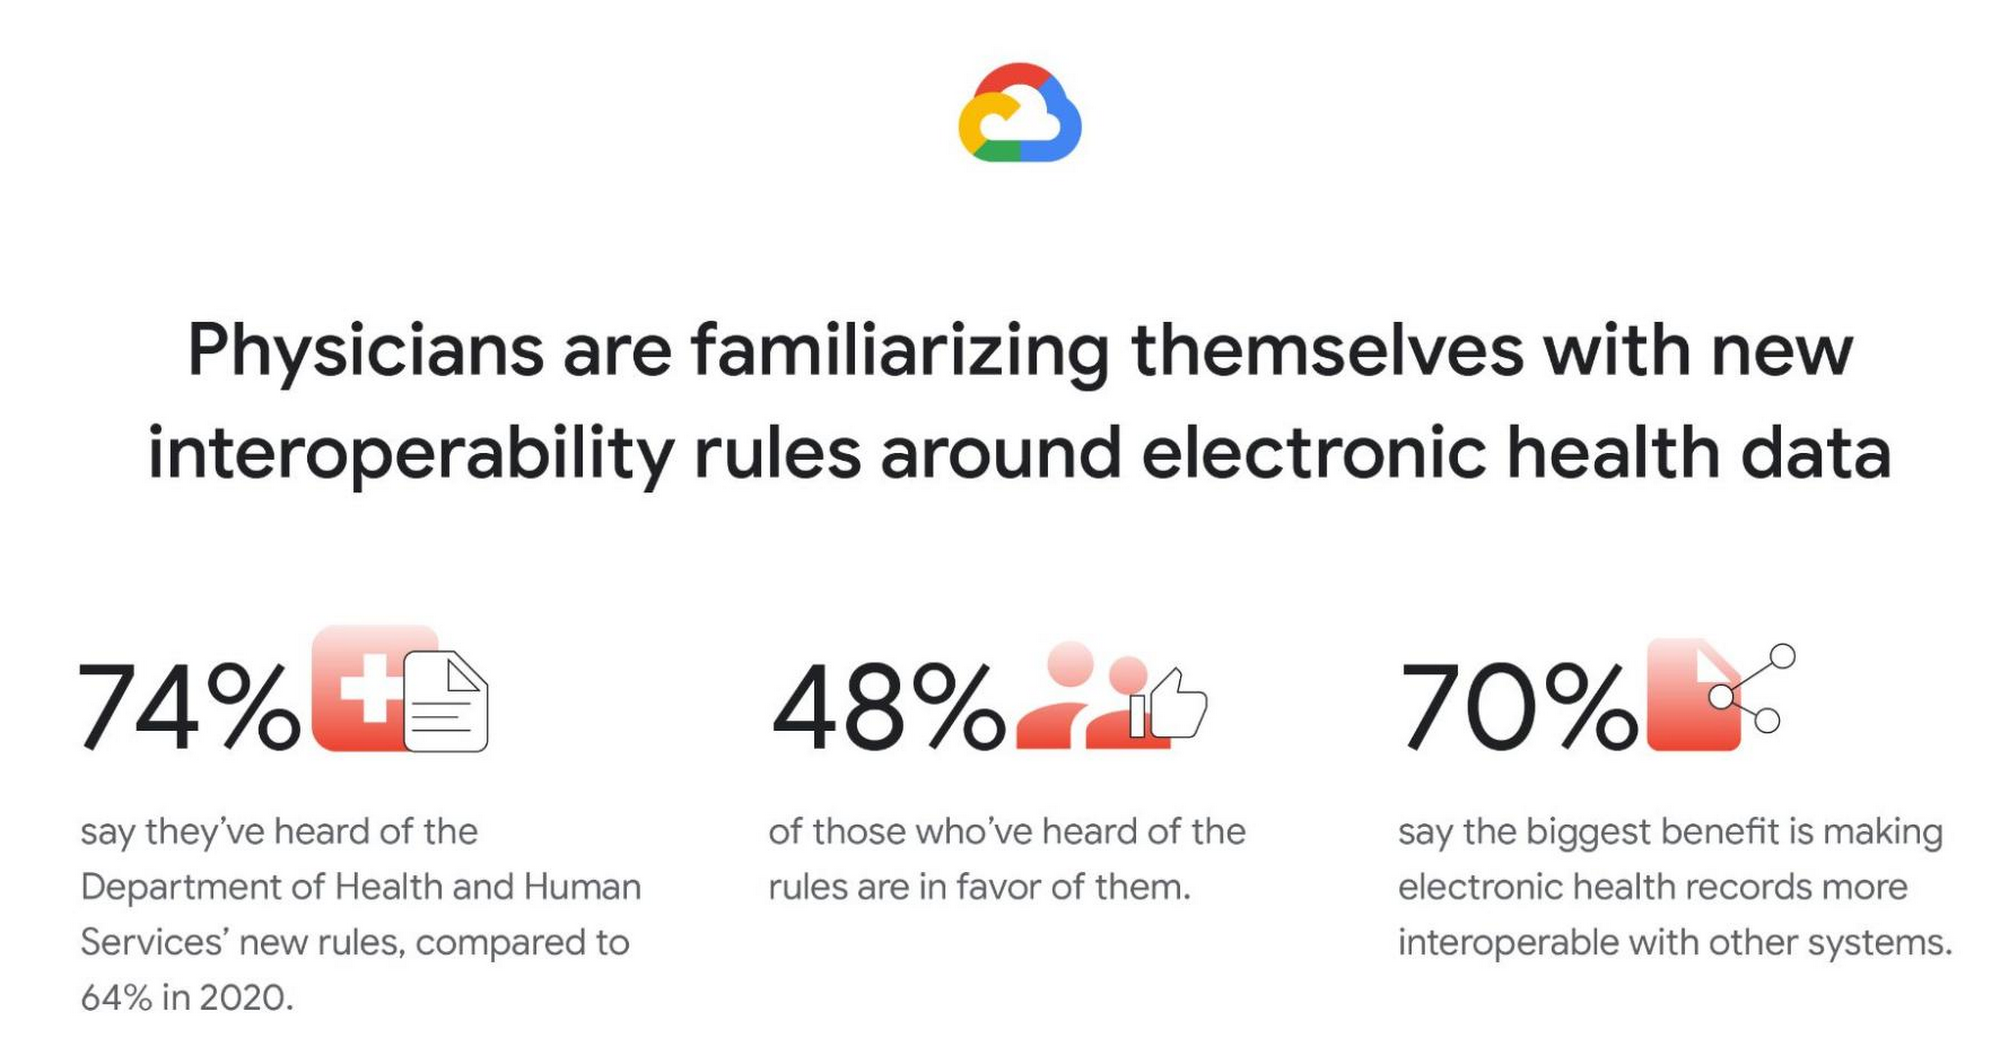
Familiarity with new Department of Health and Human Services (DHHS) interoperability rules grows, and many physicians are in favor. Most physicians (74%) say they have at least heard of the new DHHS rules (launched in 2019) to improve the interoperability of electronic health information. This is a clear rise from 2020 (64%), but deeper knowledge is fairly low. Only 30% of physicians say they are somewhat or very familiar with the new rules (though, again, this is a rise from 2020, when only 18% said they were very/somewhat familiar). Similar to in 2020, among those who have heard of the new rules, nearly half are in favor (48% in 2021; 45% in 2020) but a similar proportion remain unsure (46% in 2021; 50% in 2020). And like in 2020, by far the top potential benefit of the rules is thought to be forcing EHRs to be more interoperable with other systems (70%).
Google was founded on the idea that bringing more information to more people improves lives on a vast scale. In healthcare, that means creating tools and solutions that make data available in real time to help streamline operations and improve quality of care and patient outcomes. For example, our recently announced Healthcare Data Engine makes it easier for healthcare and life sciences leaders to make smart real-time decisions through clinical, operational, & groundbreaking scientific insights. To find out more about the Healthcare Data Engine, click here.
Survey methodology: The 2021 survey was conducted online within the United States by The Harris Poll on behalf of Google Cloud from June 9 – 29, 2021 among 303 physicians who specialize in Family Practice, General Practice, or Internal Medicine, who treat patients, and are duly licensed in the state they practice. The 2020 survey was conducted from February 18 – 25, 2020 among 300 physicians who specialize in Family Practice, General Practice, or Internal Medicine, who treat patients, and are duly licensed in the state they practice. Physicians practicing in Vermont were excluded from the research. This online survey is not based on a probability sample and therefore no estimate of theoretical sampling error can be calculated. For complete survey methodology, including weighting variables and subgroup sample sizes, please contact press@google.com.
Manipal Group: Delivering High-Quality Patient Care with Google Cloud

6480
Of your peers have already read this article.
4:30 Minutes
The most insightful time you'll spend today!
One of India’s best-known healthcare brands, Manipal Group prides itself on clinical excellence and a patient-centric approach. From humble beginnings in 1953 as a single teaching hospital—the Kasturba Medical College—in a university town in Karnataka, India, Manipal Group has grown to a presence in seven cities in India and operations in Malaysia and Nigeria. “Our founder, Dr T. M. A. Pai, established Kasturba Medical College just six years after India gained independence,” says C. G. Muthana, Chief Operating Officer, Teaching Hospitals, Manipal Health Enterprises Pvt. Ltd, part of Manipal Group.
Manipal Health Enterprises Pvt. Ltd operates 11 corporate, or for-profit, hospitals and five teaching hospitals. “We have about 7,000 beds India-wide, and on that measure, we are the third-largest private-sector healthcare provider in India today,” says Muthana. The organization now employs about 6,000 people in its corporate hospitals and 5,000 people in its teaching hospitals.
Manipal Health Enterprises Pvt. Ltd acquires and operates world-class medical technologies in its teaching and corporate hospitals. However, with 75% of corporate hospital wards allocated to fee-paying private patients—compared to just 25% of the wards in teaching hospitals—the differences in information technology budgets are significant. “In the general wards that comprise most of the wards in teaching hospitals, patients are typically treated for free or at heavily subsidized rates,” explains Muthana. “So revenues and costs of delivery vary between hospitals, while employee costs remain similar.”
Rostering nurses a critical task
Rostering nurses to work shifts is one of the most important tasks at Manipal Group corporate and teaching hospitals. As at all hospitals, nurses administer medications, monitor patients, maintain records, manage intravenous lines, and work with doctors to heal patients. They can also provide advice and support to patients and loved ones, including teaching them how to administer medication outside a hospital setting. If too few nurses are rostered for a particular shift, the quality of patient care may suffer.
Google Cloud results
- Enabled the hospital to correctly size its nursing workforce
- Lowers stress on nurses by delivering more equitable rostering
- Presents opportunity to better manage nurses’ leave and other administration tasks
However, rostering at the group’s hospitals was a time-consuming exercise. Senior nurses on each ward would have to spend up to 45 minutes per day manually amending paper-based rosters to accommodate requested changes to duty shifts for personal or other circumstances. The organization began receiving complaints from patients, doctors, and other hospital staff that, on occasion, too few nurses were rostered on for certain shifts—particularly at its flagship hospital in Bangalore. “We had based our rostering calculations on the number of beds occupied by patients and, when we investigated, we found at a macro level, we were rostering on the correct number of nurses,” says Muthana. “However, on some days, on wards optimally staffed by, say, 10 nurses per shift, we might have 14 nurses rostered on for one shift and seven rostered on for another shift. Those times we had seven, we had a clear shortage.”
In 2012, Muthana asked a consultant to develop algorithms to help automate the rostering. “Unfortunately, there were so many variables, the consultant failed to solve the problem,” he says. The Chief Operating Officer’s next step was to ask the founder and Chief Executive Officer of predictive analytics business Retigence Technologies—already working with the business on a materials management project—to develop an application to manage rostering.
Removing the daily drudgery
“Our plan with the automation project was to relieve our senior nurses of the daily drudgery of amending the rosters and to deliver rosters that were as fair as possible to all our staff,” says Muthana. “We also saw an opportunity to reduce our costs by reducing the overall number of nurses needed to look after our patients.”
Retigence Technologies’ team members then worked with the group’s nurses to capture the variables and requirements for the project. For example, a minimum number of nurses with one year experience or more needs to be rostered on for each shift. Retigence Technologies then started building an application using compute resources available through Compute Engine, a Google Cloud product. “We selected Google primarily because of its pioneering work in artificial intelligence (AI) and machine learning,” says Srinibas Behera, founder and Chief Executive Officer of Retigence Technologies.
With the nurses rostering application developed, Manipal Health Enterprises Pvt. Ltd undertook several pilots to build user acceptance. “Some of our senior nurses took time to accept the fact automation removed their control over rostering assignments, but were finally convinced by the better transparency the product offered,” says Muthana. The organization deployed the application to a smaller hospital and secured user support before rolling out the application to its Bangalore flagship.
Eliminating stress
Deploying the application has enabled Manipal Health Enterprises Pvt. Ltd to remove a buffer of about 100 nurses retained to accommodate the variations in number of nurses rostered for individual shifts. “The savings on those salaries more than paid for the cost of developing the application,” says Muthana.
The application also enabled the organization to reduce the stress on nurses—both the nurses in charge of the rosters and the nurses subject to the rosters. “Night shifts were more equitably distributed among the nurses, while we have been able to reduce the 45 minutes per day required to amend rosters to just 10 minutes,” says Muthana. “In Bangalore alone, we have 51 nurses in charge of rostering—so the combined saving there equates to nearly 30 hours per day.” This is freeing up these senior nurses to complete more important tasks.
The application was subsequently implemented at Kasturba Hospital, Manipal, again reducing the time needed to generate complete nursing rosters to less than 10 minutes.
Managing leave and training
The organization now plans to extend the application to manage leave and training for its nurses and other employees. “I would like to see every employee given an annual leave plan that is added to the roster at the start of the year,” says Muthana. “The flexibility and control afforded by the application would enable us to address challenges such as managing leave across a workforce with high attrition rates.” The organization would also be able to create a calendar to ensure nurses receive all their required training.
“We also plan to keep fine-tuning the application to deploy nurses more efficiently and continue to reduce their stress levels,” adds Muthana. “We also want to create a nursing load indicator tailored to patients’ specific circumstances. For example, a sedated patient may not require much nursing care, whereas a patient who comes in with a broken leg and may be on a ventilator may require assistance from three nurses at once.” The business plans to use Google’s AI and machine learning APIs in the future to improve the value and user experience of the product.
Digital Maturity in Higher Ed Tied to Improvements in Students’ Journey: Study

5116
Of your peers have already read this article.
3:00 Minutes
The most insightful time you'll spend today!
Why Higher Ed Needs to Go All-in on Digital
In the wake of the COVID-19 pandemic, the majority of students within the 18-24-year-old demographic now expect hybrid learning environments–even once we are beyond the pandemic. And a vast number of adult learners are seeking options that accommodate their work and family lives now that it’s clear that effective learning can indeed occur virtually. Implementing cloud technologies and achieving digital maturity within higher education will enable institutions to be innovative and responsive to evolving student preferences, while being prepared for future disruptions.
The state of digital maturity
In February and March 2021, Boston Consulting Group (BCG), in partnership with Google, surveyed U.S. higher education leaders on their views of the state of digital maturity in the higher education sector. This survey found that institutional and technology leaders strongly agreed that moving legacy IT systems to the cloud, centralizing and integrating data, and increasing the use of advanced analytics is necessary to make a successful digital transformation, and ultimately achieve digital maturity.
But what is digital maturity? Digital maturity—a measure of an organization’s ability to create value through digital delivery—focuses on three areas of technological advancement that drive large-scale innovation:
- Using cloud infrastructure
- Expanding access to data
- Using that data to improve processes through advanced analytics, such as Artificial Intelligence and Machine Learning (AI/ML)
Although university leaders agree on prioritizing digital maturity, more than 55% said they considered their schools to be “digital performers” or “digital leaders.” However, only 25% of tech leaders at these universities stated that their schools regularly use data analytics. As with corporations and governments, higher education institutions face barriers to technological innovation, such as:
- Competing priorities to meet step-change goals and decentralized decision making
- Budget constraints
- Cultural resistance to change
- Tech staff skillset gaps
Still, leaders understand that the way to overcome institutional inertia is with a strong, goal-oriented vision of what is best for the institution overall. Although only a handful of schools have reached digital maturity as we define it, others can learn a great deal from their examples. Here are the top takeaways from higher education leaders who successfully transformed their institutions:
Digital solutions can improve the student journey in many ways
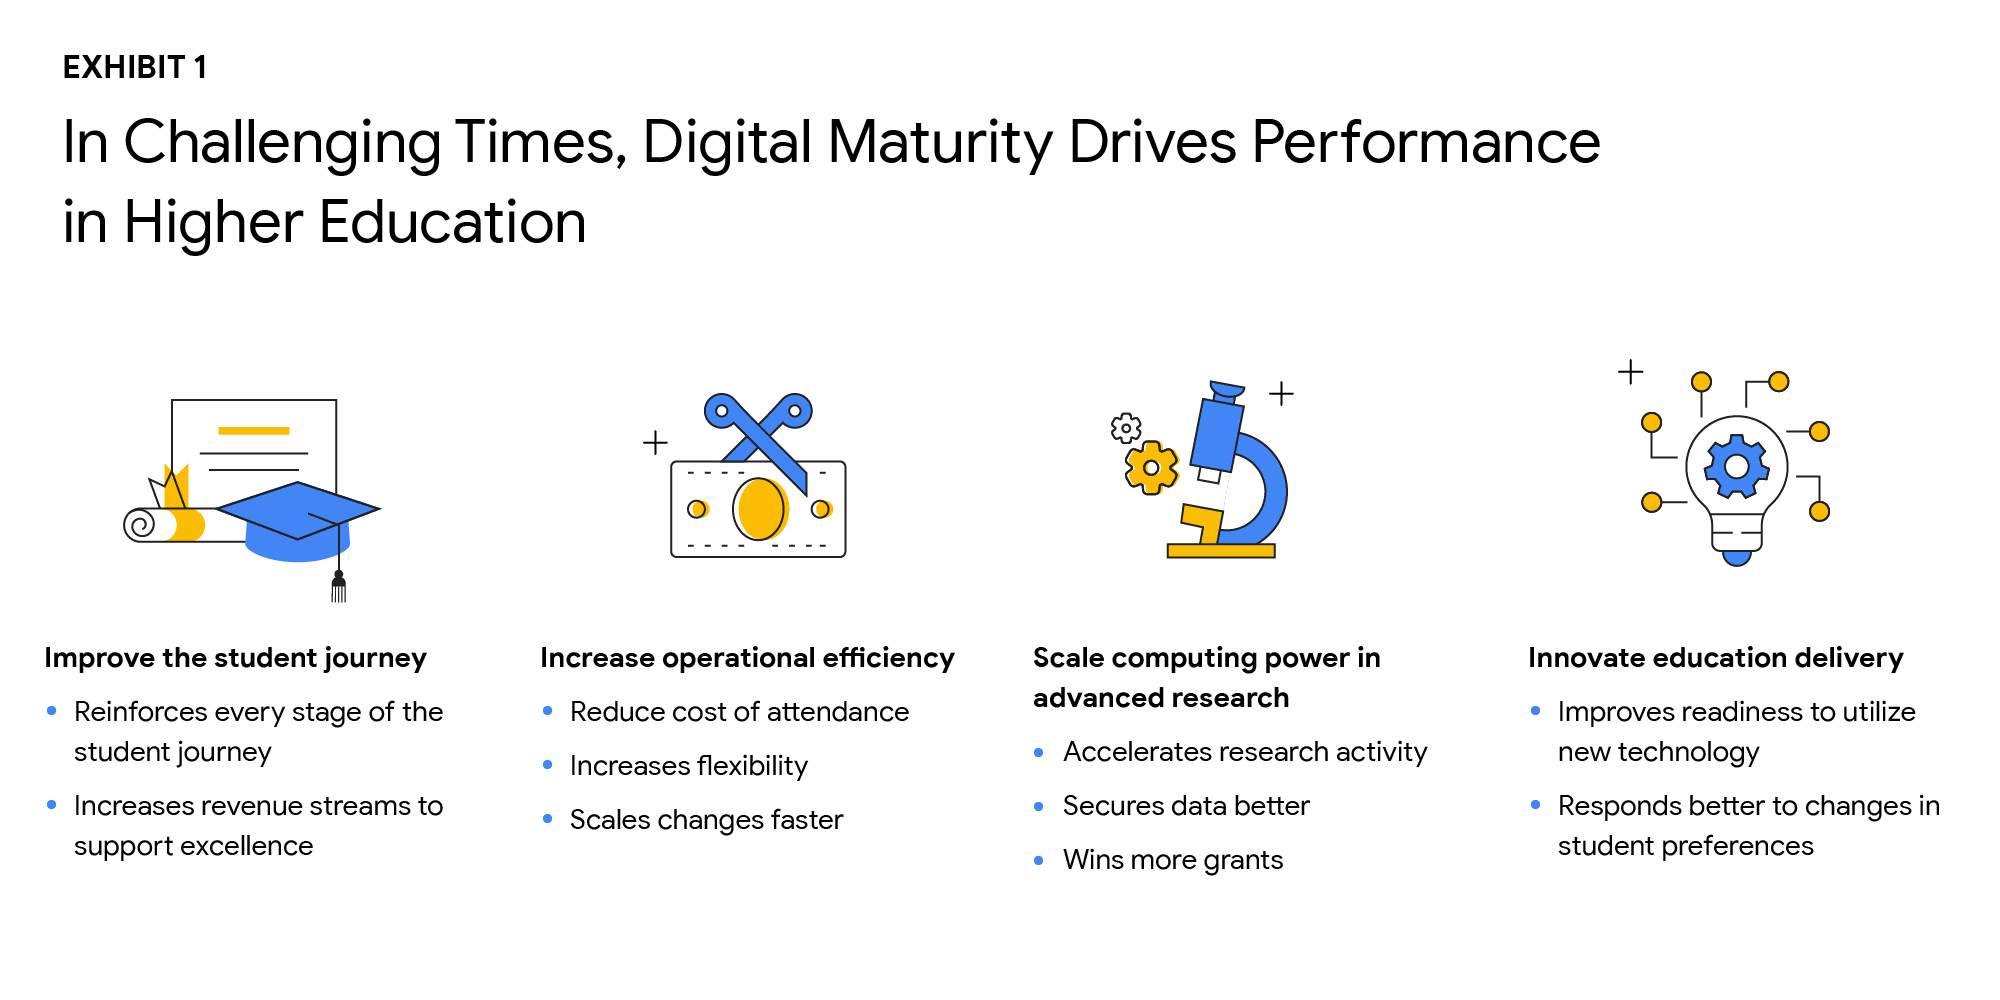
As digital capabilities hold the key to dealing effectively with declining enrollment and rising costs, higher ed leaders identified four goals that are critical to improving performance:
- Improve the student journey
- Increase operational efficiency
- Scale computing power in advanced research
- Innovate education delivery
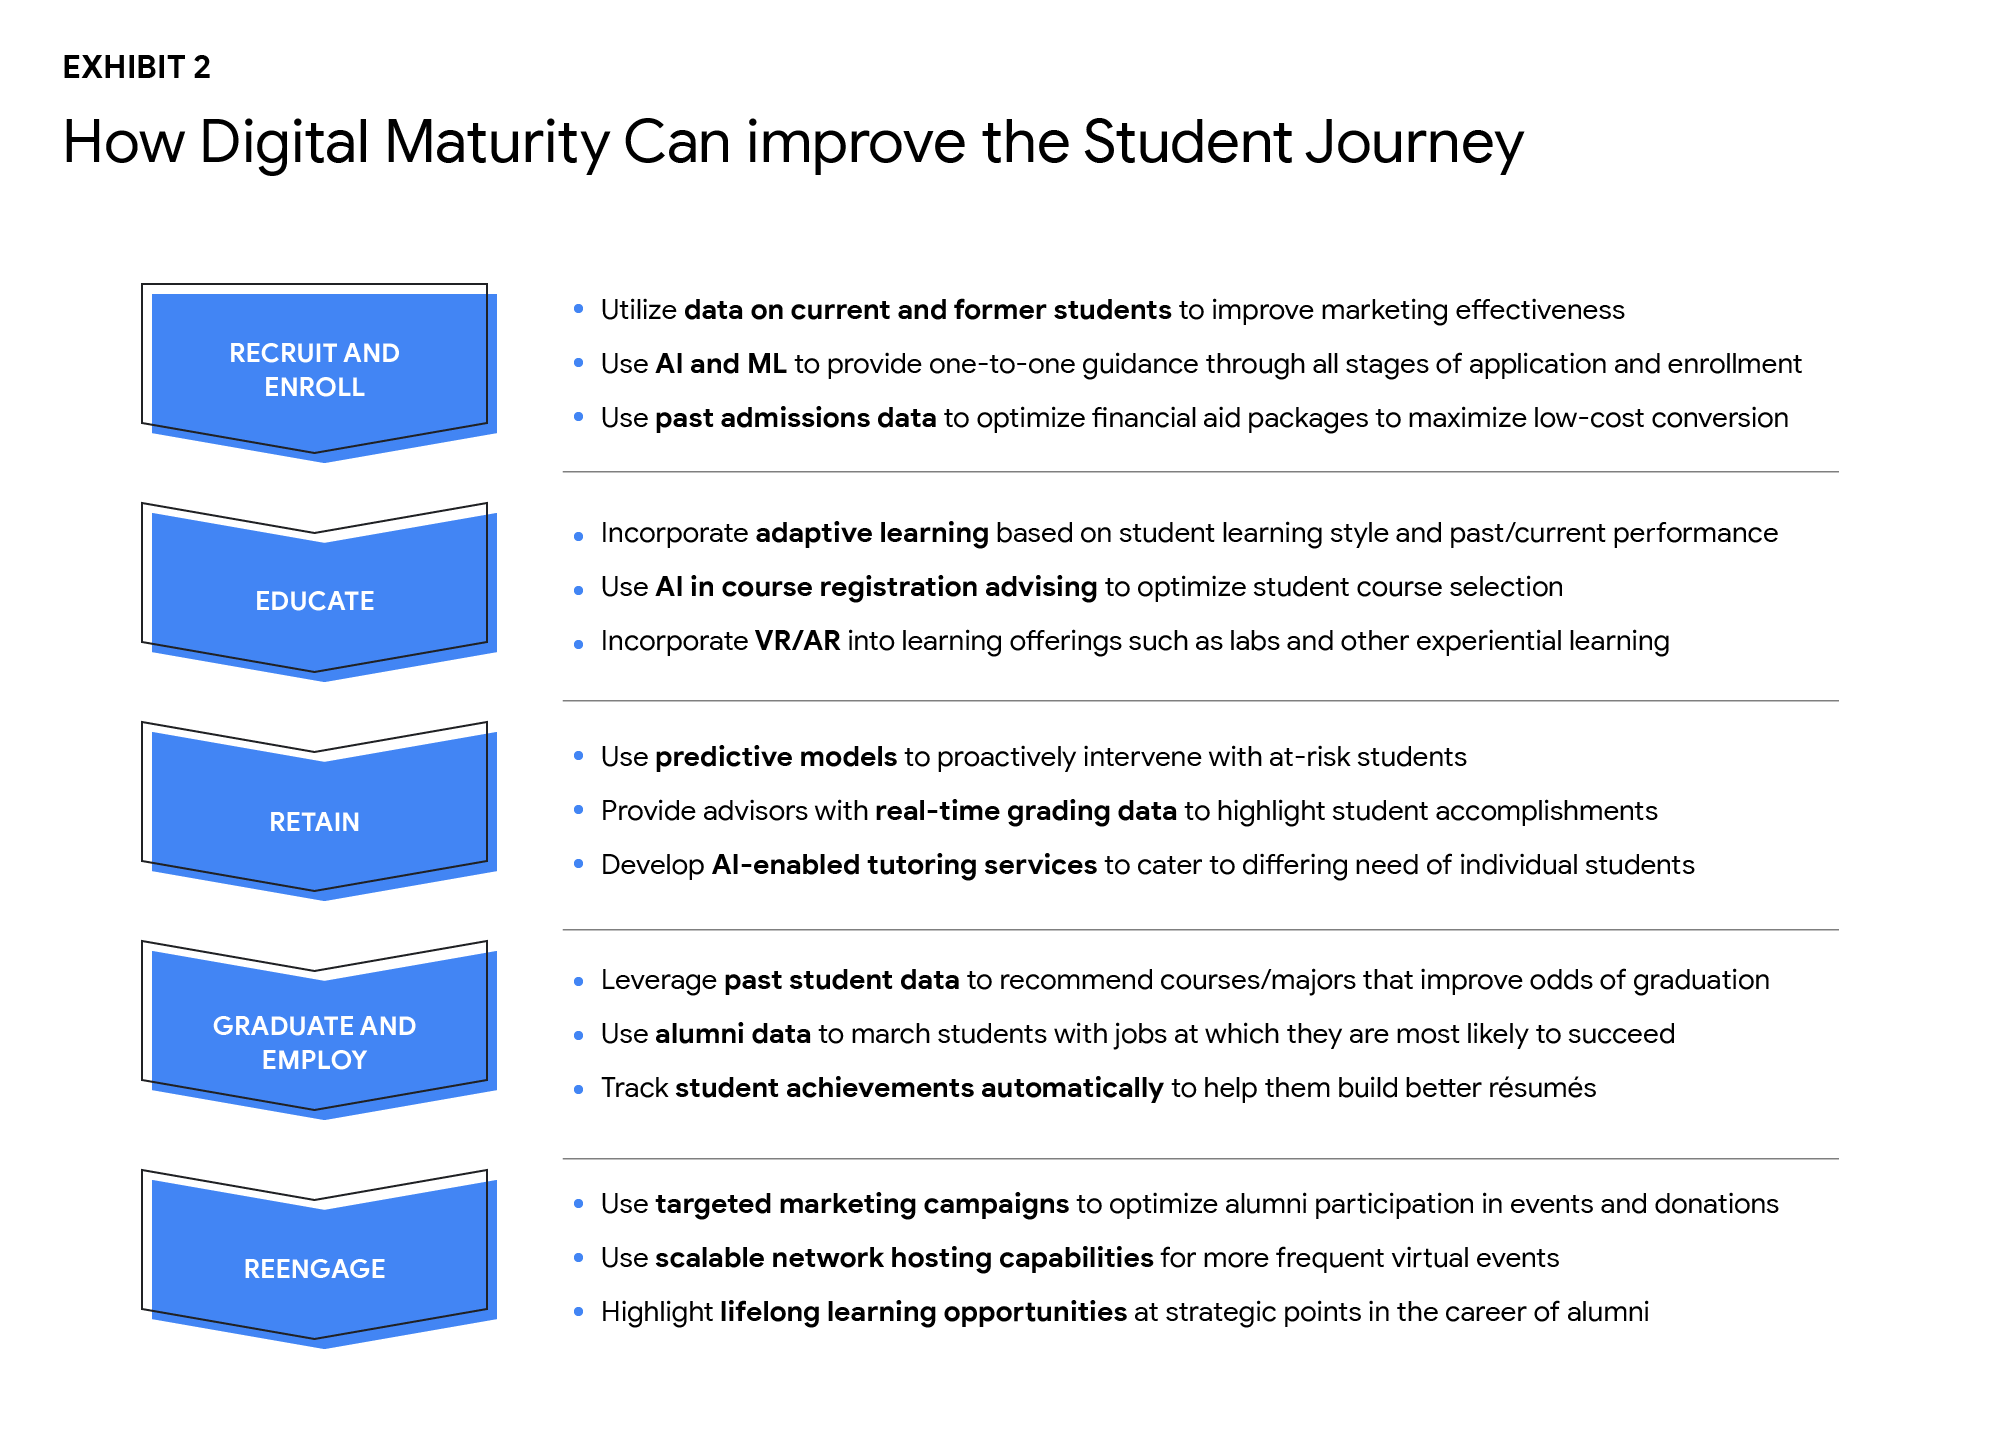
The research found that technology investments can help enhance the student journey in the recruiting and retention of students, improving digital education delivery, government funding, and donations from alumni. Digital maturity can make institutions more agile and efficient in delivering education that aligns with the changing societal norms, evolving student preferences, and future disruptions. Survey participants shared that they plan to increase the use of the cloud by more than 50% over the next three years. By shifting legacy IT systems to the cloud, institutions can increase scalability, lower the cost of ownership, and improve operational agility, while offering a more secure, long-term data storage solution.
Cloud-native software-as-a-service (SaaS) solutions provide an excellent platform for centralizing data. However, institutions that attempt to “lift and shift” their legacy systems to the cloud may encounter challenges to achieving measurable improvements in data integration and cost reduction. Higher ed leaders must realize that centralizing data and transitioning to the cloud do not happen simultaneously.
Leaders who are able to articulate a strong vision and commitment will experience a more successful technology transformation. By linking their vision to specific needs, such as more effective recruiting, leaders will find their technology investments will have a more substantial return. University presidents should base their decisions about which systems to move, when, and how on desired performance outcomes.
Big visions become a reality with small steps. Small pilot projects are an excellent way to start the journey toward digital maturity. Small steps toward a significant transformation can reduce resistance to change, build positive momentum, and produce better student outcomes. Read the full report here. If you’d like to talk to a Google Cloud expert, get in touch.
IndiaMART: Delivering a Compelling Experience for B2B Buyers and Suppliers with Google Cloud

3889
Of your peers have already read this article.
3:30 Minutes
The most insightful time you'll spend today!
B2B marketplace IndiaMART aims to help businesses escape the restrictions of traditional supply chains. By providing access to a digital platform optimized for access from desktops and mobile devices, businesses can improve their operations and generate more revenue. IndiaMART’s suite of services includes web storefront, enquiry support, priority listings, premium number services, a lead management system, and payment facilitation.
IndiaMART also provides “behavior-based matchmaking” that identifies the supplier best equipped to meet buyer needs by product or service, category and location. IndiaMART then matches the designated suppliers with the buyers. Finally, IndiaMART operates as a “horizontal marketplace”—enabling suppliers to market to a large number of potential buyers—presenting a compelling offering for both groups.
Amarinder S. Dhaliwal, Chief Product Officer of IndiaMART, says once IndiaMART grew to a certain size, it benefited from a network effect—as more buyers used the marketplace, more suppliers came on board, prompting yet more buyers to access the service and so on. Suppliers becoming buyers and using IndiaMART to purchase products is another growth driver. “There is not just a network effect, but a community effect as well, as a supplier becomes a buyer,” says Dhaliwal. “This increases affinity, and supplier and buyer ‘lock-in’ to the marketplace increases multifold.”
Positioned to address challenges
IndiaMART’s proactive approach positioned the business well to address the challenges presented by new trends and market conditions. Traffic from mobile devices to its business-to-business marketplace has grown from about 30% to 75% over the last four years.
“Mobile traffic has grown at a compound annual growth rate of almost 100% over the same period,” says Dhaliwal. “The proliferation of smartphones and other mobile devices has brought a considerable number of new users onto the internet and these users look for value—the right price from the right supplier,” he adds. “Furthermore, they can connect at any time and from any location they can access a network.”
The mobility revolution also challenged IndiaMART to provide a user interface and experience optimized for devices of various types and sizes—and that incorporated screens much smaller than the screens incorporated in desktops. The organization also had to help users overcome issues such as inconsistent network coverage and quality—particularly in remote areas.
Becoming a mobile-first organization
IndiaMART is responding by becoming, for buyers, a “mobile-first” organization that meets the group’s technical and user experience requirements.
IndiaMART is also adapting its marketplace to support two key trends:
• Buyers using long, conversational sentences to conduct online searches rather than simply typing in keywords
• Non English-users—the vast majority of people in India—stepping up their use of the marketplace
“We expect that, within a few years, we will have more non-English users than English users on IndiaMART,” says Dhaliwal.
IndiaMART is also benefiting from Indian government measures to reform taxation and stimulate the digital economy. “There has been a huge focus on areas such as digital payments and the digitization of identity,” says Dhaliwal. “We have embraced elements of this agenda by implementing a digital payment platform and are continuing to look at ways of providing new digital services to suppliers.
“Meanwhile, the Indian government’s recent implementation of GST allows us to validate suppliers’ businesses and bring more qualified, more verified suppliers on our platform—improving the experience for buyers and suppliers.”
Speed and reliability an issue
IndiaMART had started operations with servers, storage, networking, and associated systems co-located in a data center in the United States. However, as buyers and suppliers increasingly used mobile devices—over occasionally unreliable networks—to access the marketplace, access speeds and reliability became an issue. With most requests traveling between India and the United States, network latency was unacceptably high. Furthermore, business growth meant IndiaMART needed an environment that could scale to meet demand for the next five to 10 years.
IndiaMART opted for a multi-cloud architecture and established criteria for cloud providers to win its business. “We required an infrastructure that could scale and meet our demand for fast response time without putting our business at risk,” says Dhaliwal. “This meant taking a phased rather than one-shot approach to the migration. We also needed to minimize any wasteful duplication of infrastructure and reduce latency. In addition, as we scaled, we needed to protect our systems, transactions and information, including the details of buyers and suppliers.”
Google Cloud team’s high-quality support
The organization performed proof of concept with the three largest multinational cloud services providers and found Google Cloud was best positioned to act as the cornerstone of its multi-cloud architecture. “The Google Cloud team gave us considerable support in helping us run a proof of concept of its services,” says Dhaliwal.
“The proof of concept also illustrated that Google Cloud was superior to the other cloud services we looked at.
“We could run our marketplace across multiple geo-locations under a single IP address, avoiding duplication, and users in India could connect to Google Cloud via the closest access point, with their traffic passing quickly across the Google network.
“In addition, Google Cloud’s load balancing service would enable encryption between load balancing layers and back ends to ensure security, while all communication would move across Google’s own protected network.”
Being one of India’s early users of G Suite, the organization was also familiar with Google Cloud applications and services.
IndiaMART then opted to work with the Google Cloud team and a certified partner on a step-by-step implementation that minimized any risk of disruption.
Deep engagement from Google
“We engaged very deeply with both Google and the partner to complete this migration,” says Dhaliwal. “The Google team worked very hard to understand our requirements and provide a solution that catered to our needs and could be deployed in a phased manner.” The team ran workshops and technical sessions with IndiaMART and, at a Google Summit, connected the marketplace provider to Google experts in databases and infrastructure.
“These discussions really helped us formulate a strategy moving forward,” says Dhaliwal.
Based on input from Google and its own evaluation, IndiaMART developed an architecture comprising virtual machine instances delivered through Compute Engine, Google Cloud’s infrastructure-as-a-service offering; Cloud Load Balancing to support cloud resources distributed across multiple locations; Cloud Pub/Sub to provide enterprise messaging; and Cloud Dataflow to transform and enrich data.
Cloud Armor works with Cloud Load Balancing to defend against distributed denial of service (DDoS) attacks; and Geocoding API helps the organization convert geographic coordinates into readable addresses and vice versa. Cloud AutoML allows IndiaMART to train machine learning models to meet its requirements. With Geocoding API, IndiaMART can matchmake buyers and suppliers based on location—providing a high quality experience for both parties. Finally, AutoML Translation allows the organization to create a custom machine learning model that converts product names from English into Hindi and other languages, effectively opening up new markets for buyers and suppliers.
Phase one complete
IndiaMART has completed phase one of the migration that involved moving its web properties across to Google Cloud. The organization is now experimenting with moving its APIs and databases to the service and anticipates completing the exercise over the coming year.
Average page load time down
The initial phase of the project has already delivered considerable benefits to IndiaMART. The organization has cut average page loading time from five seconds to three seconds, and Dhaliwal attributes close to one second of that reduction to the move to Google Cloud. “With Google Cloud, buyers and suppliers can access our marketplace much faster than previously,” says Dhaliwal. “This impacts positively on engagement, time spent on our marketplace, and the user’s entire journey with us.”
DDoS attack repelled
Google Cloud’s security features have already passed their first test. As IndiaMART undertook stage one of the migration, the business experienced a DDoS attack that generated request loads more than 400 times greater than normal. “Because we were on Google Cloud infrastructure, we could develop a solution to combat this severe DDoS attack,” says Sunil Parolia, Sr. VP at IndiaMART. “From a security perspective, this really justified our decision to go with Google Cloud.”
Google Cloud is also helping deliver the availability required by IndiaMART and the scalability to support growing demand. “As the number of people in India who access the internet grows from about 500 million to 700-800 million over the next couple of years, we will continue to build our traffic and be the dominant business-to-business platform,” says Dhaliwal. “On the supplier side, we expect to see more and more businesses come onto our marketplace—ranging from small-to-medium businesses up to larger brands. Google Cloud will enable us to accommodate this traffic without compromising the experience we provide.”
More Relevant Stories for Your Company

Framework for a Unified Approach to the Cloud
Moving to the cloud offers enormous benefits for businesses. Yet there are risks as well. The challenge is multidimensional, with far reaching implications not just for the solutions that will run in the cloud, but also for the technologies that support them, the people who need to implement them, and


Value Realization with Google Cloud for Retail SAP Data
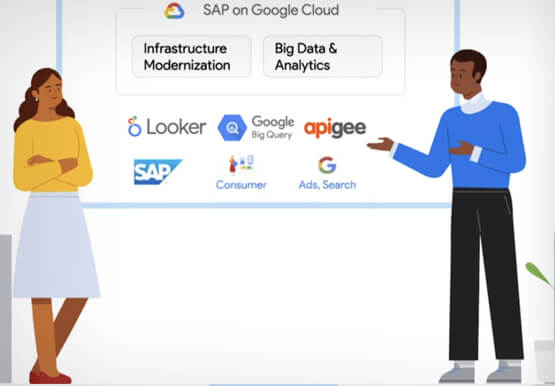
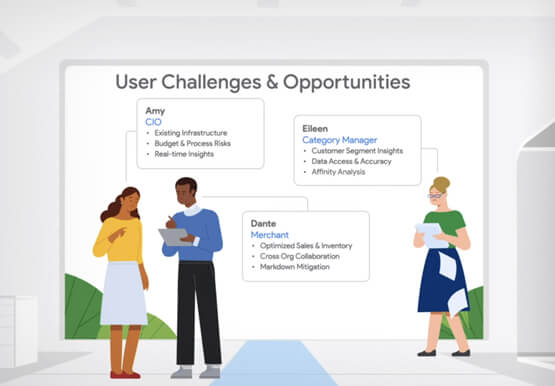
Retail engagements have changed drastically over the last few years, and by the virtue of COVID-19 pandemic, retail data and customers' expectations plummeted. To drive value and transformation across the entire value-chain retailers can make most of Google Cloud's secure, reliable IaaS by migrating their SAP systems and taking advantage

Largest Beauty Retailer in the US Powers Digital Transformation with Google Cloud Smart Analytics
Digital technology offers increasing flexibility and choice to consumers. As a result, the retail industry is dramatically shifting toward more tailored and personalized experiences for shoppers, and businesses are rethinking how they deliver value to customers. This couldn’t be more true for the beauty retailing industry where leading companies are

Security at Scale: A Peek into the Life of Google
Defending the world’s largest network against persistent and constantly evolving cyber threats has driven Google to architect, automate, and develop advanced tools to help keep it ahead. Understanding how Google has built and evolved it’s defenses can help you make smart architectural decisions of your own as you move forward.
