





Discover Latest Resources on Google Cloud’s Datasets Solution

6317
Of your peers have already read this article.
3:00 Minutes
The most insightful time you'll spend today!
Editor’s note: With Google Cloud’s datasets solution, you can access an ever-expanding resource of the newest datasets to support and empower your analyses and ML models, as well as frequently updated best practices on how to get the most out of any of our datasets. We will be regularly updating this blog with new datasets and announcements, so be sure to bookmark this link and check back often.
August 2021
New dataset: Google Cloud Release Notes
- Looking for a new way to access Google Cloud Release Notes besides the docs, the XML feed, and Cloud Console? Check out the Google Cloud Release Notes dataset. With up-to-date release notes for all generally available Google Cloud products, this dataset allows you to use BigQuery to programmatically analyze release notes across all products, exploring security bulletin updates, fixes, changes, and the latest feature releases.
- Access the dataset

July 2021
Best practice: Use Google Trends data for common business needs
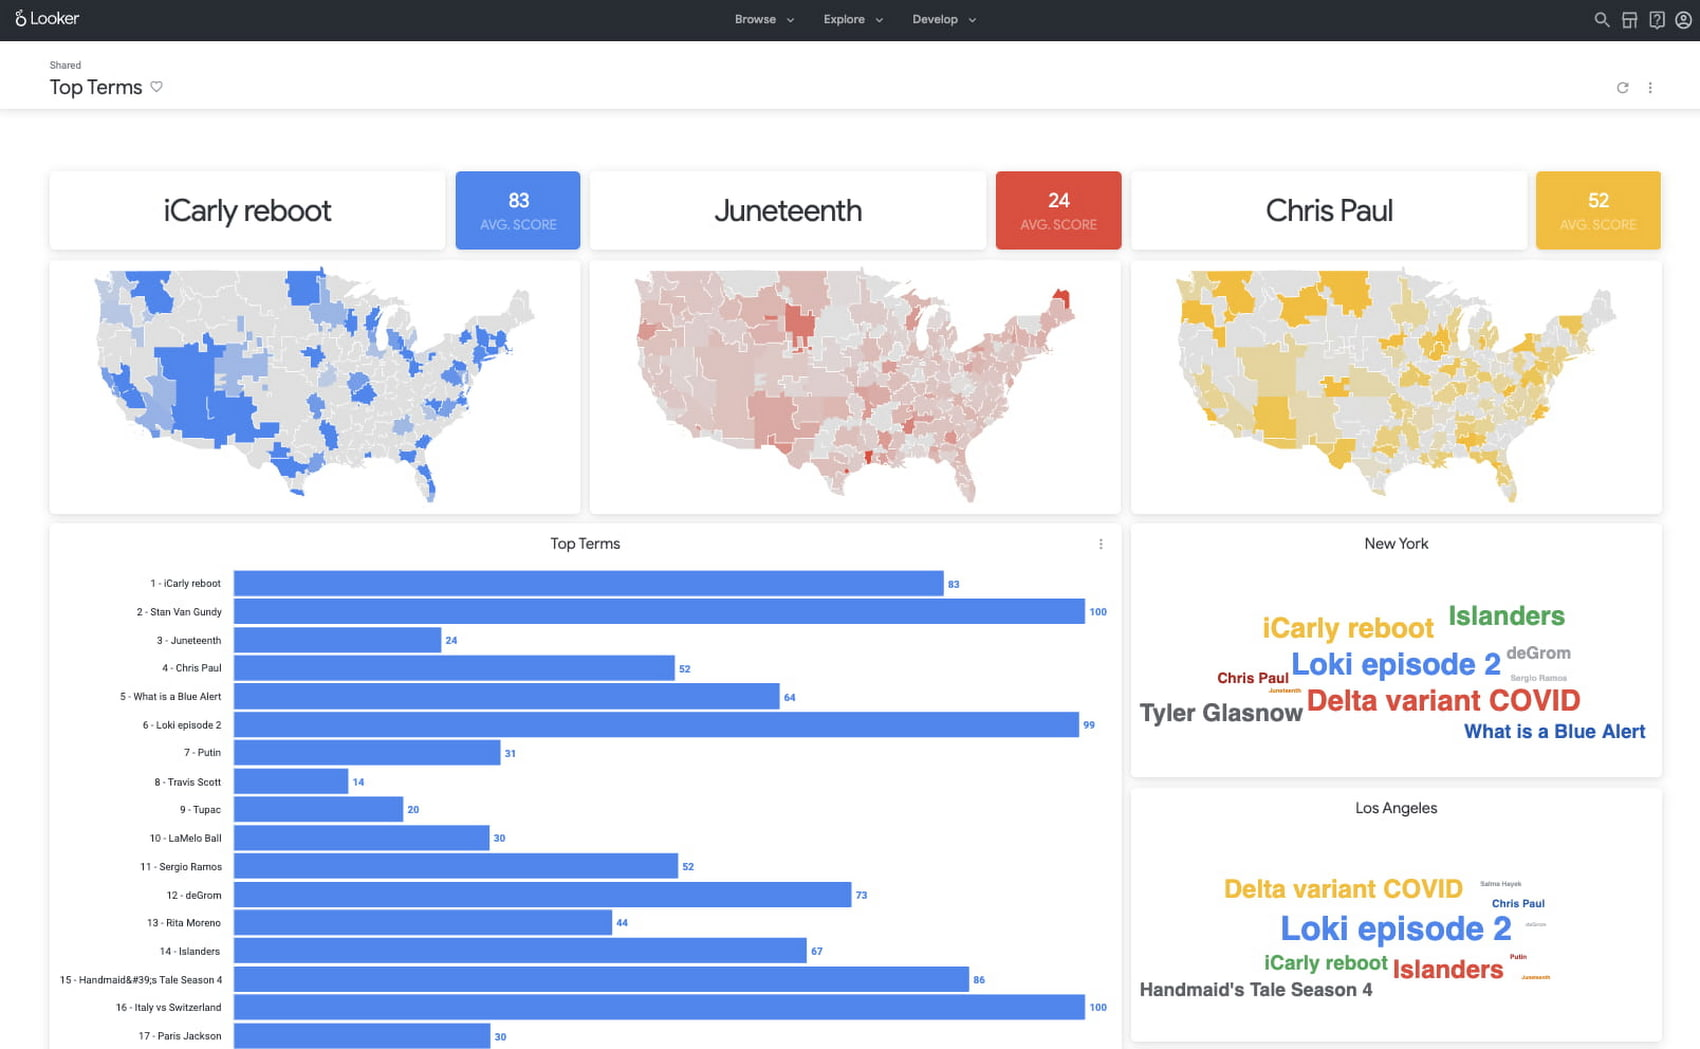
- The Google Trends dataset represents the first time we’re adding Google-owned Search data into Datasets for Google Cloud. The Trends data allows users to measure interest in a particular topic or search term across Google Search, from around the United States, down to the city-level. You can learn more about the dataset here, and check out the Looker dashboard here! These tables are super valuable in their own right, but when you blend them with other actionable data you can unlock whole new areas of opportunity for your team. To learn how to make informed decisions with Google Trends data, keep reading.
- Access the dataset
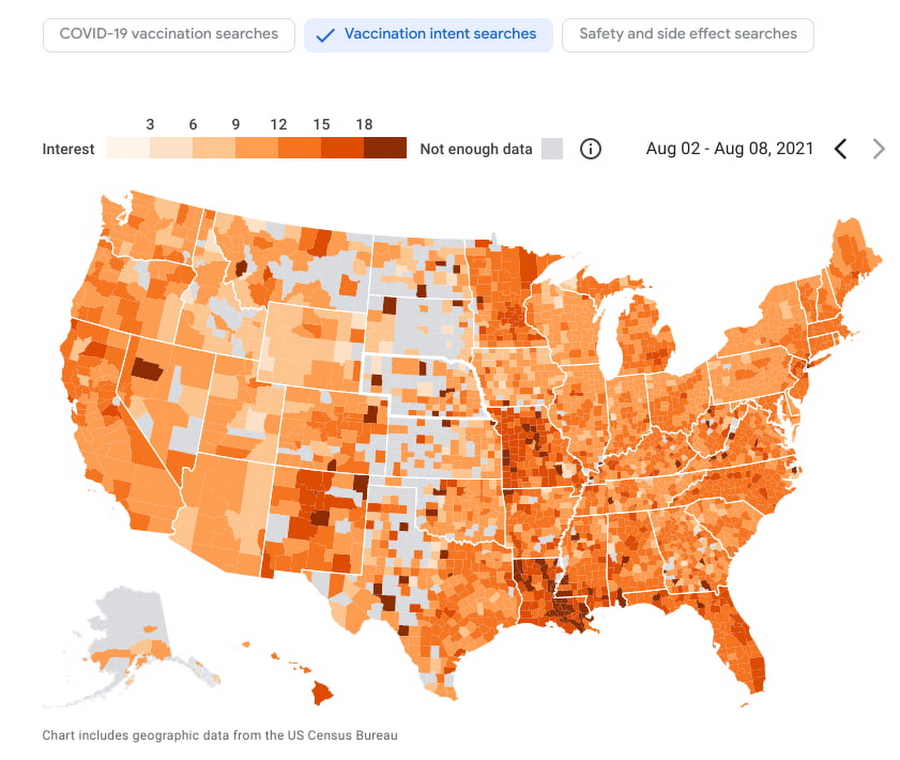
New dataset: COVID-19 Vaccination Search Insights
- With COVID-19 vaccinations being a topic of interest around the United States, this dataset shows aggregated, anonymized trends in searches related to COVID-19 vaccination and is intended to help public health officials design, target, and evaluate public education campaigns. Check out this interactive dashboard to explore searches for COVID-19 vaccination topics by region.
- Access the dataset
June 2021
New dataset: Google Diversity Annual Report 2021
- Since 2014, Google has disclosed data on the diversity of its workforce in an effort to bring candid transparency to the challenges technology companies like Google face in recruitment and retention of underrepresented communities. In an effort to make this data more accessible and useful, we’ve loaded it into BigQuery for the first time ever. To view Google’s Diversity Annual Report and learn more, check it out.
- Access the dataset
New dataset: Google Trends Top 25 Search terms
- The most popular and surging Google Search terms are now available in BigQuery as a public dataset. View the Top 25 and Top 25 rising queries from Google Trends from the past 30-days, including 5 years of historical data across the 210 Designated Market Areas (DMAs) in the US. Keep reading.
- Access the dataset
New dataset: COVID-19 Vaccination Access
- With metrics quantifying travel times to COVID-19 vaccination sites, this dataset is intended to help Public Health officials, researchers, and Healthcare Providers to identify areas with insufficient access, deploy interventions, and research these issues. Check out how this data is being used in a number of new tools.
- Access the dataset

Best practice: Leveraging BigQuery Public Boundaries datasets for geospatial analytics
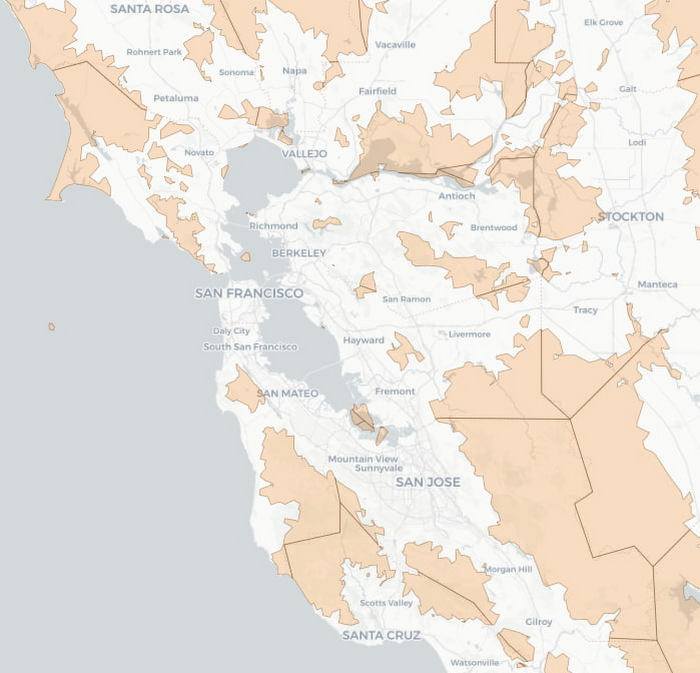
- Geospatial data is a critical component for a comprehensive analytics strategy. Whether you are trying to visualize data using geospatial parameters or do deeper analysis or modeling on customer distribution or proximity, most organizations have some type of geospatial data they would like to use – whether it be customer zipcodes, store locations, or shipping addresses. However, converting geographic data into the correct format for analysis and aggregation at different levels can be difficult. In this post, we’ll walk through some examples of how you can leverage the Google Cloud platform alongside Google Cloud Public Datasets to perform robust analytics on geographic data. Keep reading.
- Access the dataset

Get the metadata and try BigQuery sandbox
When you’ve learned about many of our datasets and pre-built solutions from across Google, you may be ready to start querying them. Check out the full dataset directory and read all the metadata at g.co/cloud/marketplace-datasets, then dig into the data with our free-to-use BigQuery sandbox account, or $300 in credits with our Google Cloud free trial.
Google is a Leader in the 2019 Gartner Magic Quadrant for Data Management Solutions for Analytics

5972
Of your peers have already read this article.
2:10 Minutes
The most insightful time you'll spend today!
As organizations continue to produce vast quantities of data, they increasingly need platforms that allow them to analyze, store, and extract meaningful insights from that data. And research from analyst firms like Gartner offer an important way for organizations to evaluate and compare cloud data warehouse providers.
Earlier this year, Gartner named Google a Leader in the 2019 Gartner Magic Quadrant for Data Management Solutions for Analytics (DMSA) (report available here). This evaluation covers Google Cloud’s core data analytics offerings, including BigQuery, a serverless, managed data warehouse, Cloud Dataproc, a managed Spark and Hadoop service, and Cloud Dataflow, which enables you to stream and batch-process your data. Here are a few takeaways:
Simplicity and speed
BigQuery’s performance permits complex queries on large-scale data sets to return in seconds, and a substantial number of BigQuery customers maintain data warehouses that store more than 50 terabytes (and a few customers now use more than 100 petabytes). More than half of these customers are loading data either continuously or many times per day. These customers value the ability to extract, transform, load, and analyze their data on a serverless platform, all without maintaining any underlying infrastructure.
A versatile serverless data warehouse
One of BigQuery’s major advantages is its ability to allow customers to address a wide variety of use cases—from a traditional data warehouse to data science. Over the past year, we’ve worked hard to introduce new features in BigQuery like data types for financial and monetary uses, BigQuery GIS for geospatial data, and machine learning capabilities through BigQuery ML. BigQuery’s continuous ingest capabilities make it suitable for an operational—or a real-time—serverless data warehouse.
An expanding ecosystem
With overall increased market adoption, our analytics offerings continue to benefit from a fast-growing partner ecosystem of service providers, and business intelligence (BI) and data integration vendors. In particular, in 2018 we expanded our partnerships with established industry providers, including Confluent, Dell Boomi, Informatica, Looker, Reltio, Tableau, and ThoughtSpot.
More and more organizations are finding value in Google Cloud’s serverless data warehouse and analytics offerings. If you’d like to learn more, you can download a complimentary copy of the Gartner Magic Quadrant for Data Management Solutions for Analytics on the Google site (requires an email address).
Gartner does not endorse any vendor, product or service depicted in its research publications, and does not advise technology users to select only those vendors with the highest ratings or other designation. Gartner research publications consist of the opinions of Gartner’s research organization and should not be construed as statements of fact. Gartner disclaims all warranties, expressed or implied, with respect to this research, including any warranties of merchantability or fitness for a particular purpose.
Recommendations for Modelling SAP Data inside BigQuery

8397
Of your peers have already read this article.
4:00 Minutes
The most insightful time you'll spend today!
Over the past few years, many organizations have experienced the benefits of migrating their SAP solutions to Google Cloud. But this migration can do more than reduce IT maintenance costs and make data more secure. By leveraging BigQuery, SAP customers can complement their SAP investments and gain fresh insights by consolidating enterprise data and easily extending it with powerful datasets and machine learning from Google.
BigQuery is a leading cloud data warehouse, fully managed and serverless, and allows for massive scale, supporting petabyte-scale queries at super-fast speeds. It can easily combine SAP data with additional data sources, such as Google Analytics or Salesforce, and its built-in machine learning lets users operationalize machine learning models using standard SQL — all at a comparatively low cost.
If your SAP-powered organization is looking to supercharge its analytics with the strength of BigQuery, read on for considerations and recommendations for modeling with SAP data. These guidelines are based on our real-world implementation experience with customers and can serve as a roadmap to the analytics capabilities your business needs.
Considerations for data replication
Like most technology journeys, this one should start with a business objective. Keeping your intended business value and goals in mind is critical to making the right decisions in the early steps of the design process.
When it comes to replicating the data from an SAP system into BigQuery, there are multiple ways to do it successfully. Decide which method will work best for your organization by answering these questions:
- Does your business need real-time data? Will you need to time travel into past data?
- Which external datasets will you need to join with the replicated data?
- Are the source structures or business logic likely to change? Will you be migrating the SAP source systems any time soon? For instance, will you be moving from SAP ECC to SAP S/4HANA?
You’ll also need to determine whether replication should be done on a table-by-table basis or whether your team can source from pre-built logic. This decision, along with other considerations such as licensing, will influence which replication tool you should use.
Replicating on a table-by-table basis
Replicating tables, especially standard tables in their raw form, allows sources to be reused and ensures more stability of the source structure and functional output. For example, the SAP table for sales order headers (VBAK) is very unlikely to change its structure across different versions of SAP, and the logic that writes to it is also unlikely to change in a way that affects a replicated table.
Something else to consider: Reconciliation between the source system and the landing table in BigQuery is linear when comparing raw tables, which helps avoid issues in consolidation exercises during critical business processes, such as period-end closing. Since replicated tables aren’t aggregated or subject to process-specific data transformation, the same replicated columns can be reused in different BigQuery views. You can, for instance, replicate the MARA table (the material master) once and use it in as many models as needed.
Replicating pre-built logic
If you replicate pre-built models, such as those from SAP extractors or CDS views, you don’t need to build the logic in BigQuery, since you’re using existing logic. Some of these extraction objects have embedded delta mechanisms, which may complement a replication tool that can’t handle deltas. This will save initial development time, but it can also lead to challenges if you create new columns, or if customizations or upgrades change the logic behind the extraction.
It’s also important to note that different extraction processes may transform and load the same source columns multiple times, which creates redundancy in BigQuery and can lead to higher maintenance needs and costs. However, replicating pre-built models may still be a good choice, since doing so can be especially useful for logic that tends to be immutable, such as flattening a hierarchy, or logic that is highly complex.
How you approach replication will also depend on your long-term plans and other key factors — for example, the availability (and curiosity) of your developers, and the time or effort they can put into applying their SQL knowledge to a new data warehouse.
With either replication approach, bear in mind when designing your replication process that BigQuery is meant to be an append-always database — so post-processing of data and changes will be required in both cases.
Processing data changes
The replication tool you choose will also determine how data changes are captured (known as CDC – change data capture). If the replication tool allows for it (for example as SAP SLT does) the same patterns described in the CDC with BigQuery documentation also apply to SAP data.
Because some data, like transactions, are known to be less static than others (e.g., master data), you need to decide what should be scanned in real time, what will require immediate consistency, and what can be processed in batches to manage costs. This decision will be based on the reporting needs from the business.
Consider the SAP table BUT000, containing our example master data for business partners, where we have replicated changes from an SAP ERP system:
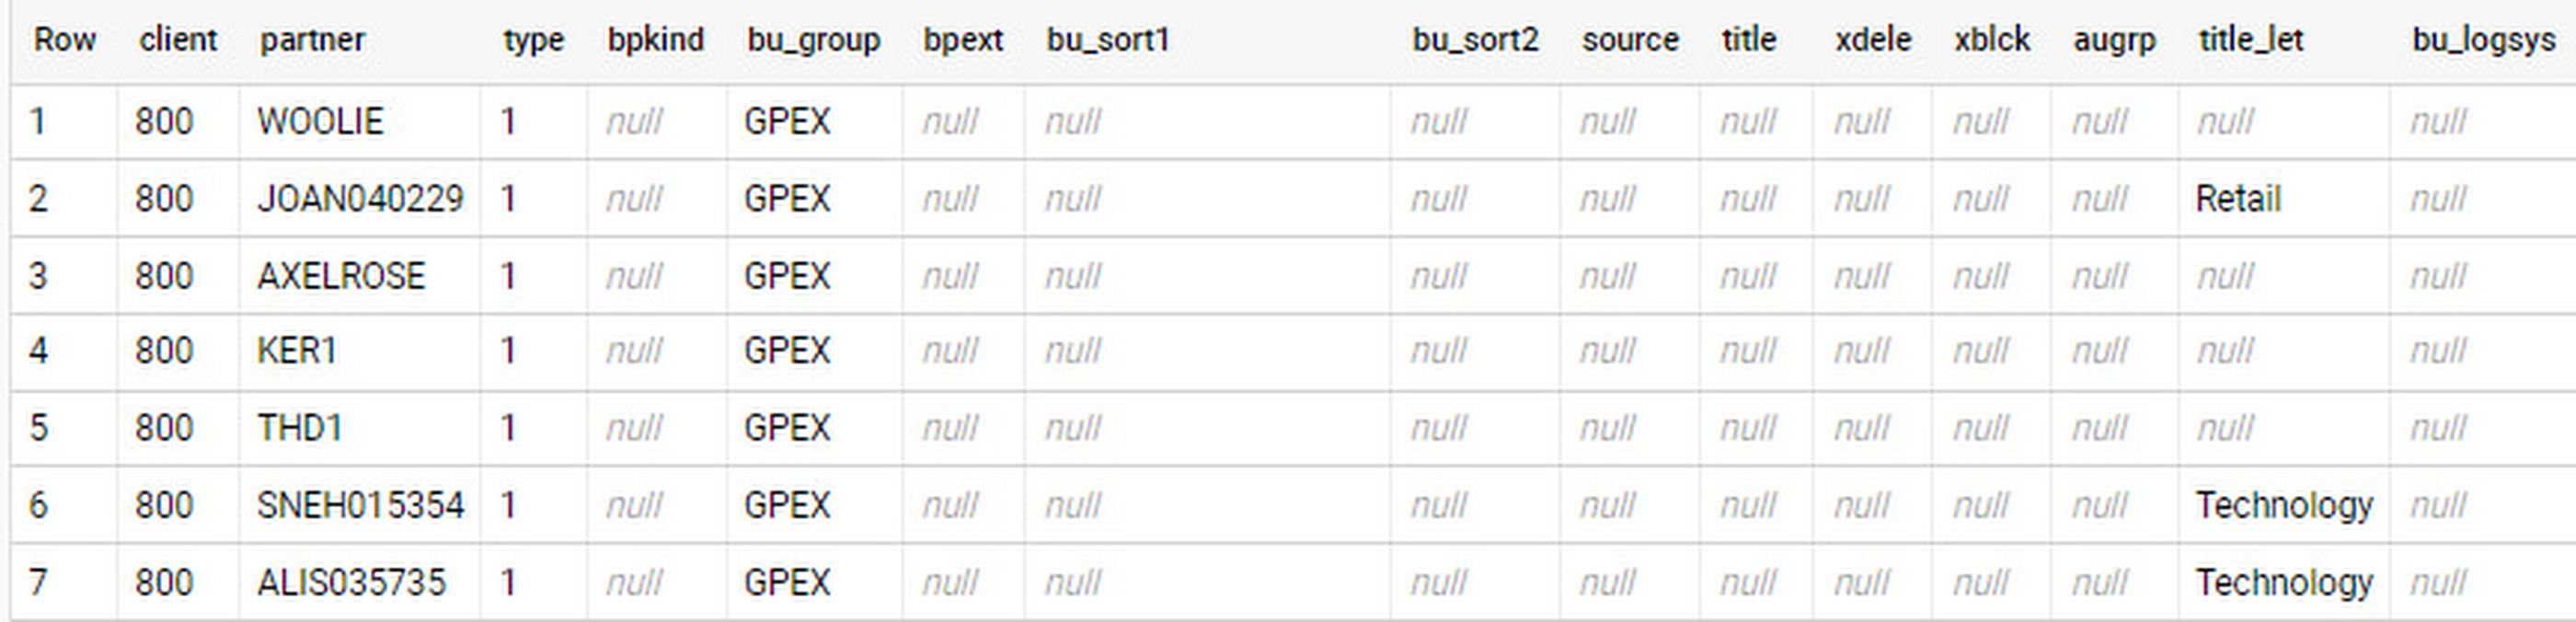
In an append-always replication in BigQuery, all updates are received as new records. For example, deleting a record in the source will be represented as a new record in BigQuery with a deletion flag. This applies to whether the records are coming from raw tables like BUT000 itself or pre-aggregated data, as from a BW extractor or a CDS view.
Let’s take a closer look at data coming particularly from the partners “LUCIA” and “RIZ”. The operation flag tells us whether the new record in BigQuery is an insert (I), update (U) or deletion (D), while the timestamps help us identify the latest version of our business partner.
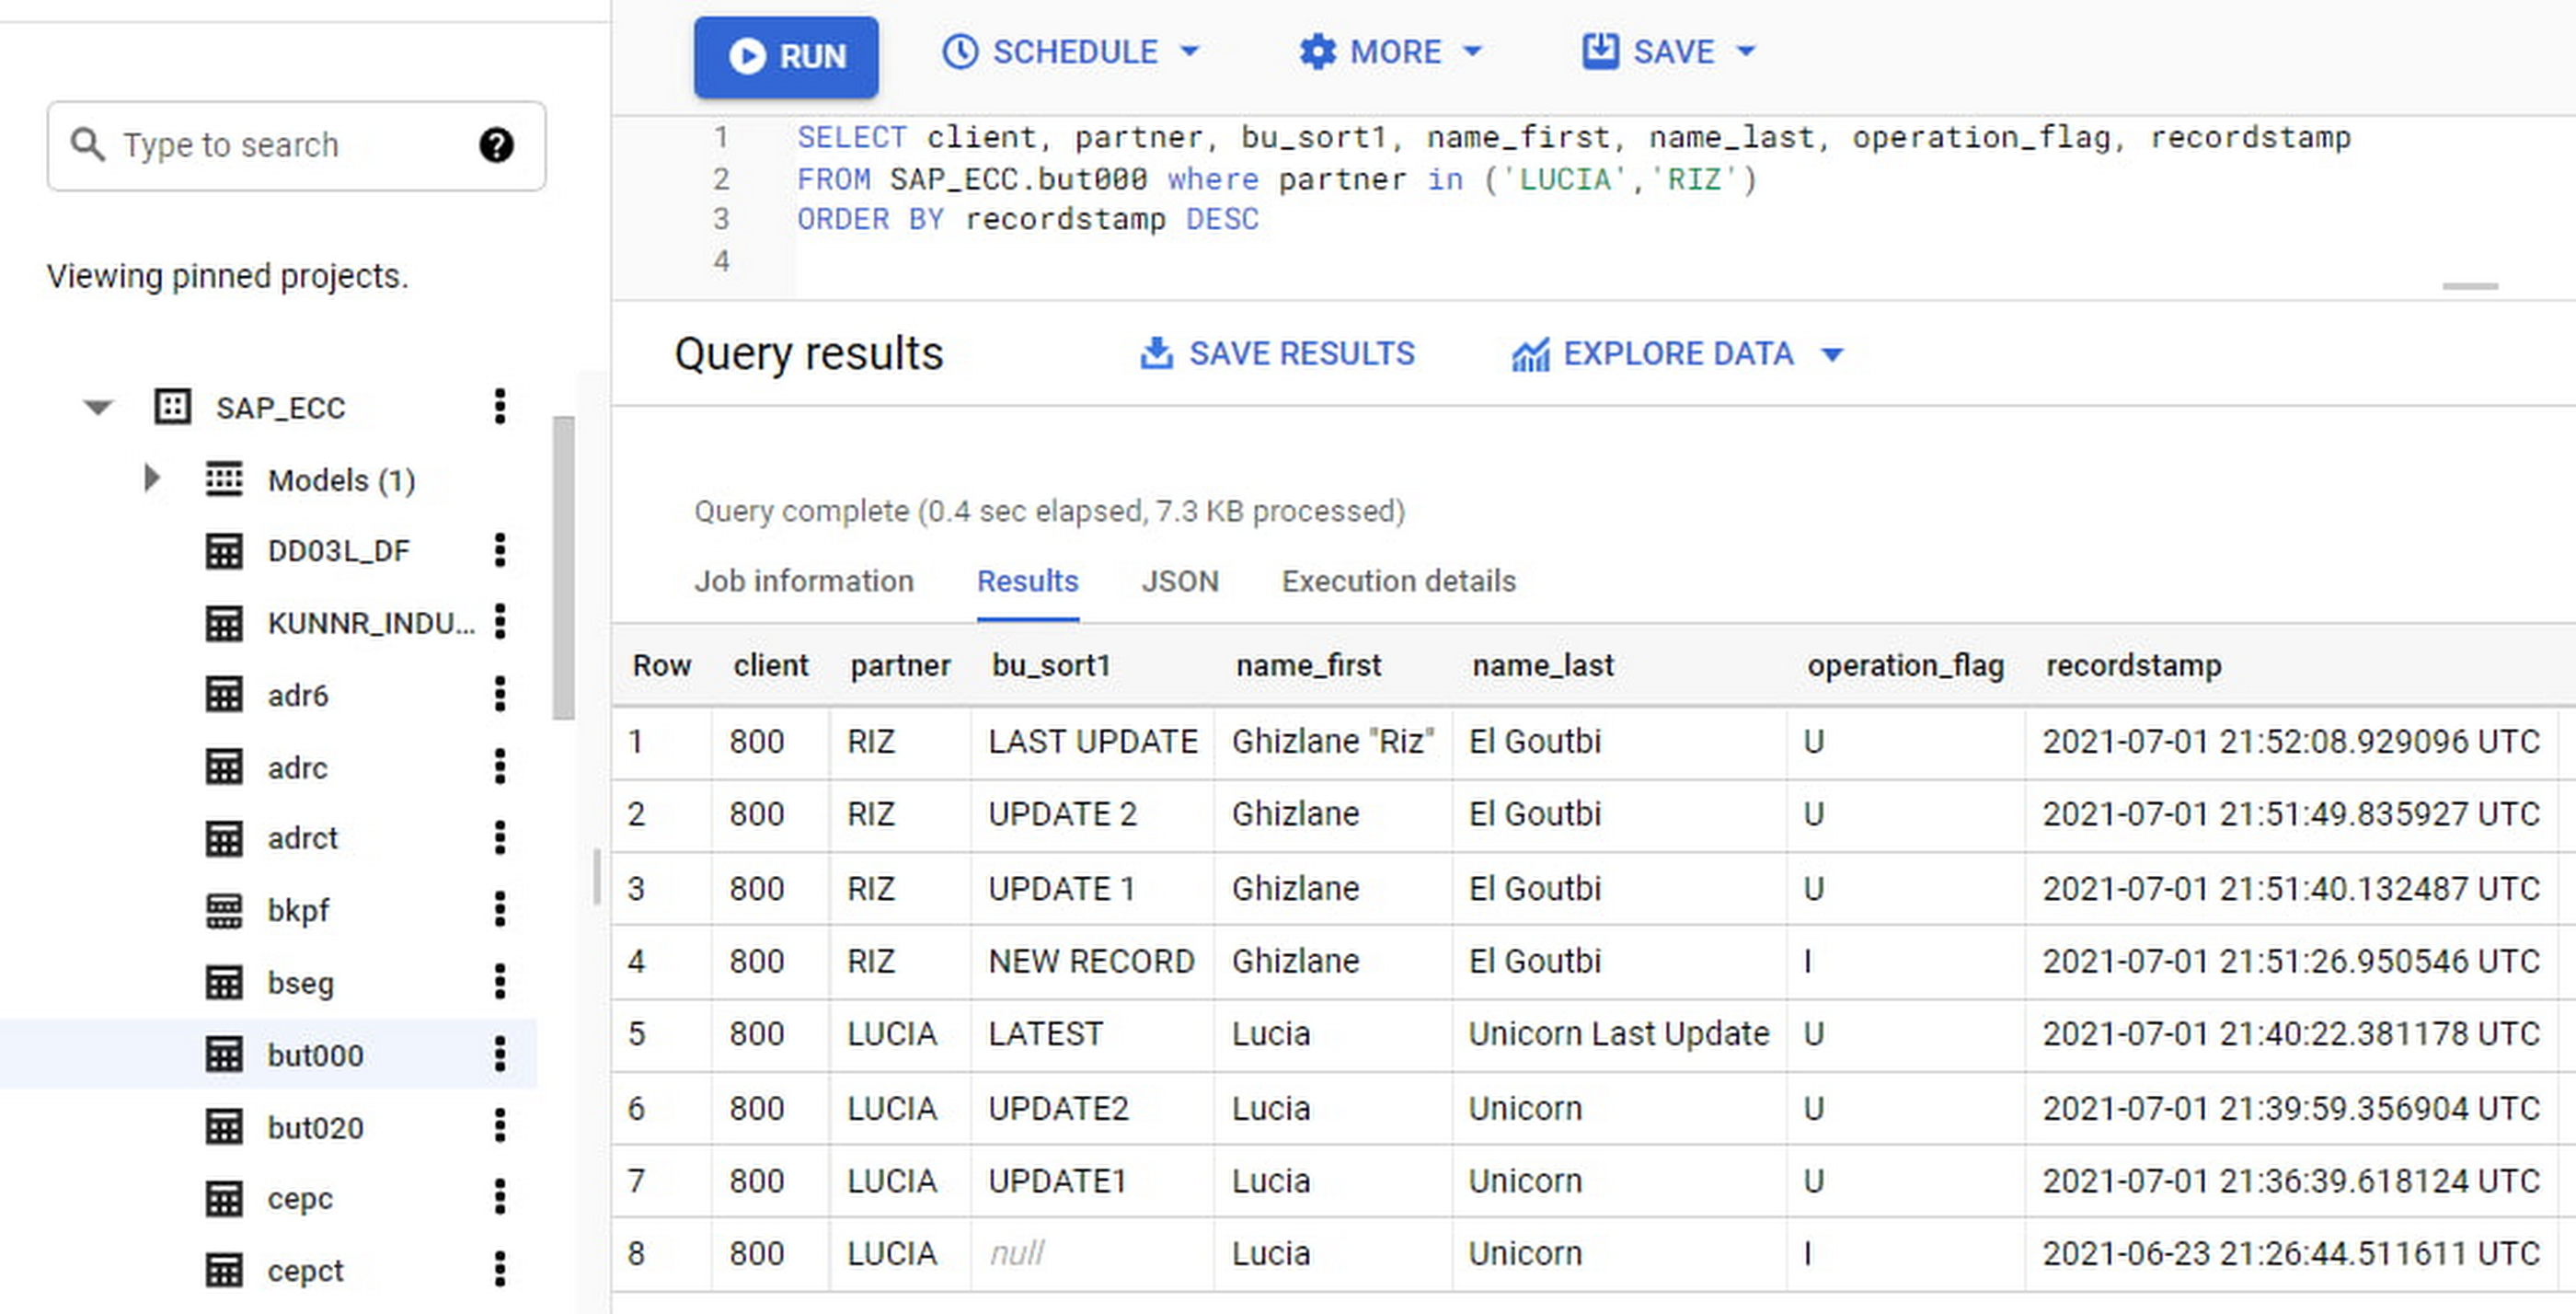
If we want to find the latest updated record for the partners LUCIA and RIZ, this is what the query would look like:
SELECT partner,ARRAY_AGG(i1 ORDER BY i1.recordstamp DESC LIMIT 1) AS rowFROM SAP_ECC.but000 i1WHERE partner in ('LUCIA','RIZ')GROUP BY partner
With the following result:
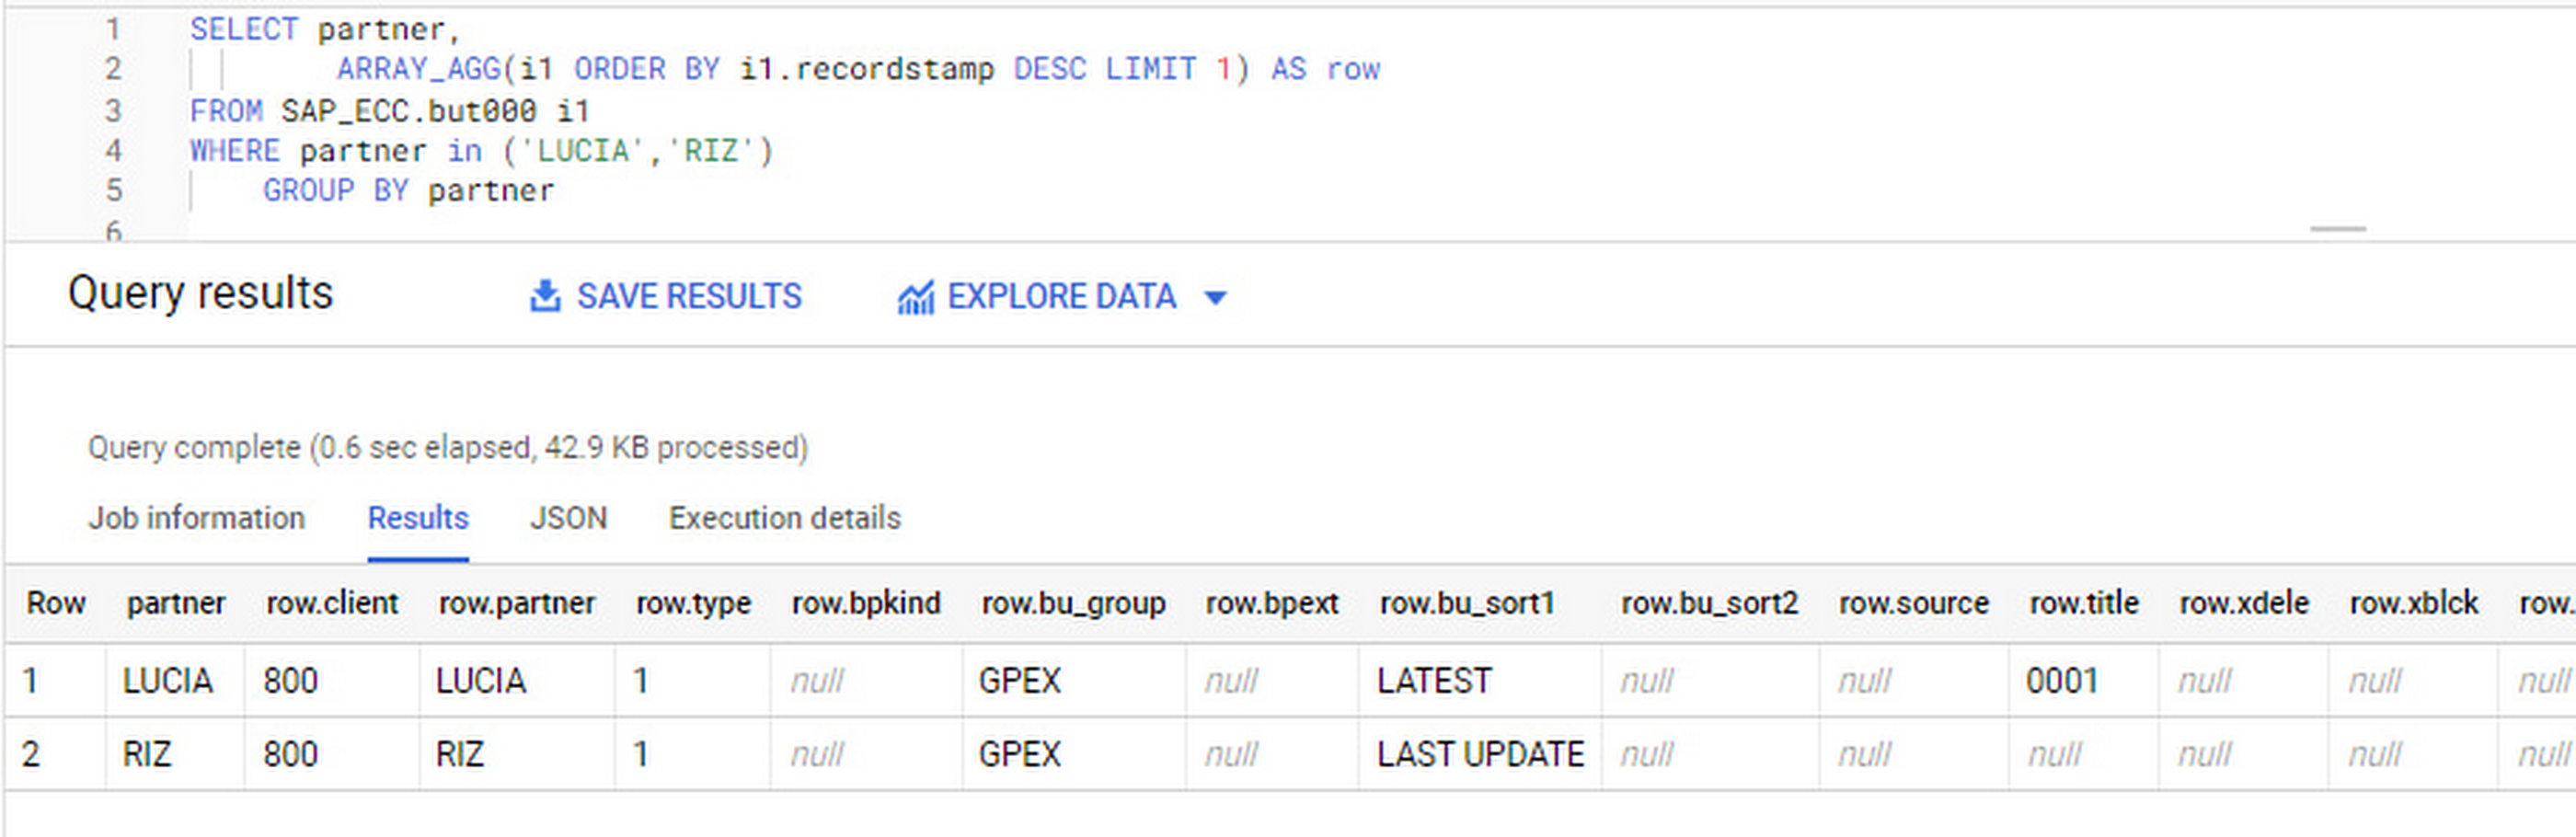
After identifying stale records for “LUCIA” and “RIZ” business partners, we can proceed to deleting all stale records for “LUCIA” if we do not want to retain the history. In this example, we are using a different table to which the same replication has been done, for the purpose of comparison and to check that all stale records have been deleted for the selection made and that we only kept last updated records. For example:
DELETE SAP_HANA.but000 i1WHEREi1.recordstamp < TIMESTAMP_SUB(CURRENT_TIMESTAMP(), INTERVAL 3 HOUR) ANDi1.recordstamp < (SELECT MAX(recordstamp) FROM SAP_HANA.but000 i2WHEREi1.partner = i2.partnerand partner="LUCIA")
You can also use the following query to retrieve stale records for “LUCIA” partner before moving forward with deletion
SELECT partner, operation_flag, recordstamp FROM SAP_HANA.but000 i1WHEREi1.recordstamp < TIMESTAMP_SUB(CURRENT_TIMESTAMP(), INTERVAL 3 HOUR)ANDi1.recordstamp < (SELECT MAX(recordstamp) FROM SAP_HANA.but000 i2WHEREi1.partner = i2.partnerand partner="LUCIA")
Which produces all of the records, except the latest update:

Partitioning and clustering
To limit the number of records scanned in a query, save on cost and achieve the best performance possible, you’ll need to take two important steps: determine partitions and create clusters.
Partitioning
A partitioned table is one that’s divided into segments, called partitions, which make it easier to manage and query your data. Dividing a large table into smaller partitions improves query performance and controls costs because it reduces the number of bytes read by a query.
You can partition BigQuery tables by:
- Time-unit column: Tables are partitioned based on a “timestamp,” “date,” or “datetime” column in the table.
- Ingestion time: Tables are partitioned based on the timestamp recorded when BigQuery ingested the data.
- Integer range: Tables are partitioned based on an integer column.
Partitions are enabled when the table is created, as in the example below. A great tip is to always include the partition filter as shown on the left-hand side of the query.

Clustering
Clustering can be created on top of partitioned tables by applying the fields that are likely to be used for filtering. When you create a clustered table in BigQuery, the table data is automatically organized based on the contents of one or more of the columns in the table’s schema. The columns you specify are then used to colocate related data.
Clustering can improve the performance of certain query types — for example, queries that use filter clauses or that aggregate data. It makes a lot of sense to use them for large tables such as ACDOCA, the table for accounting documents in SAP S/4HANA. In this case, the timestamp could be used for partitioning, and common filtering fields such as the ledger, company code, and fiscal year could be used to define the clusters.
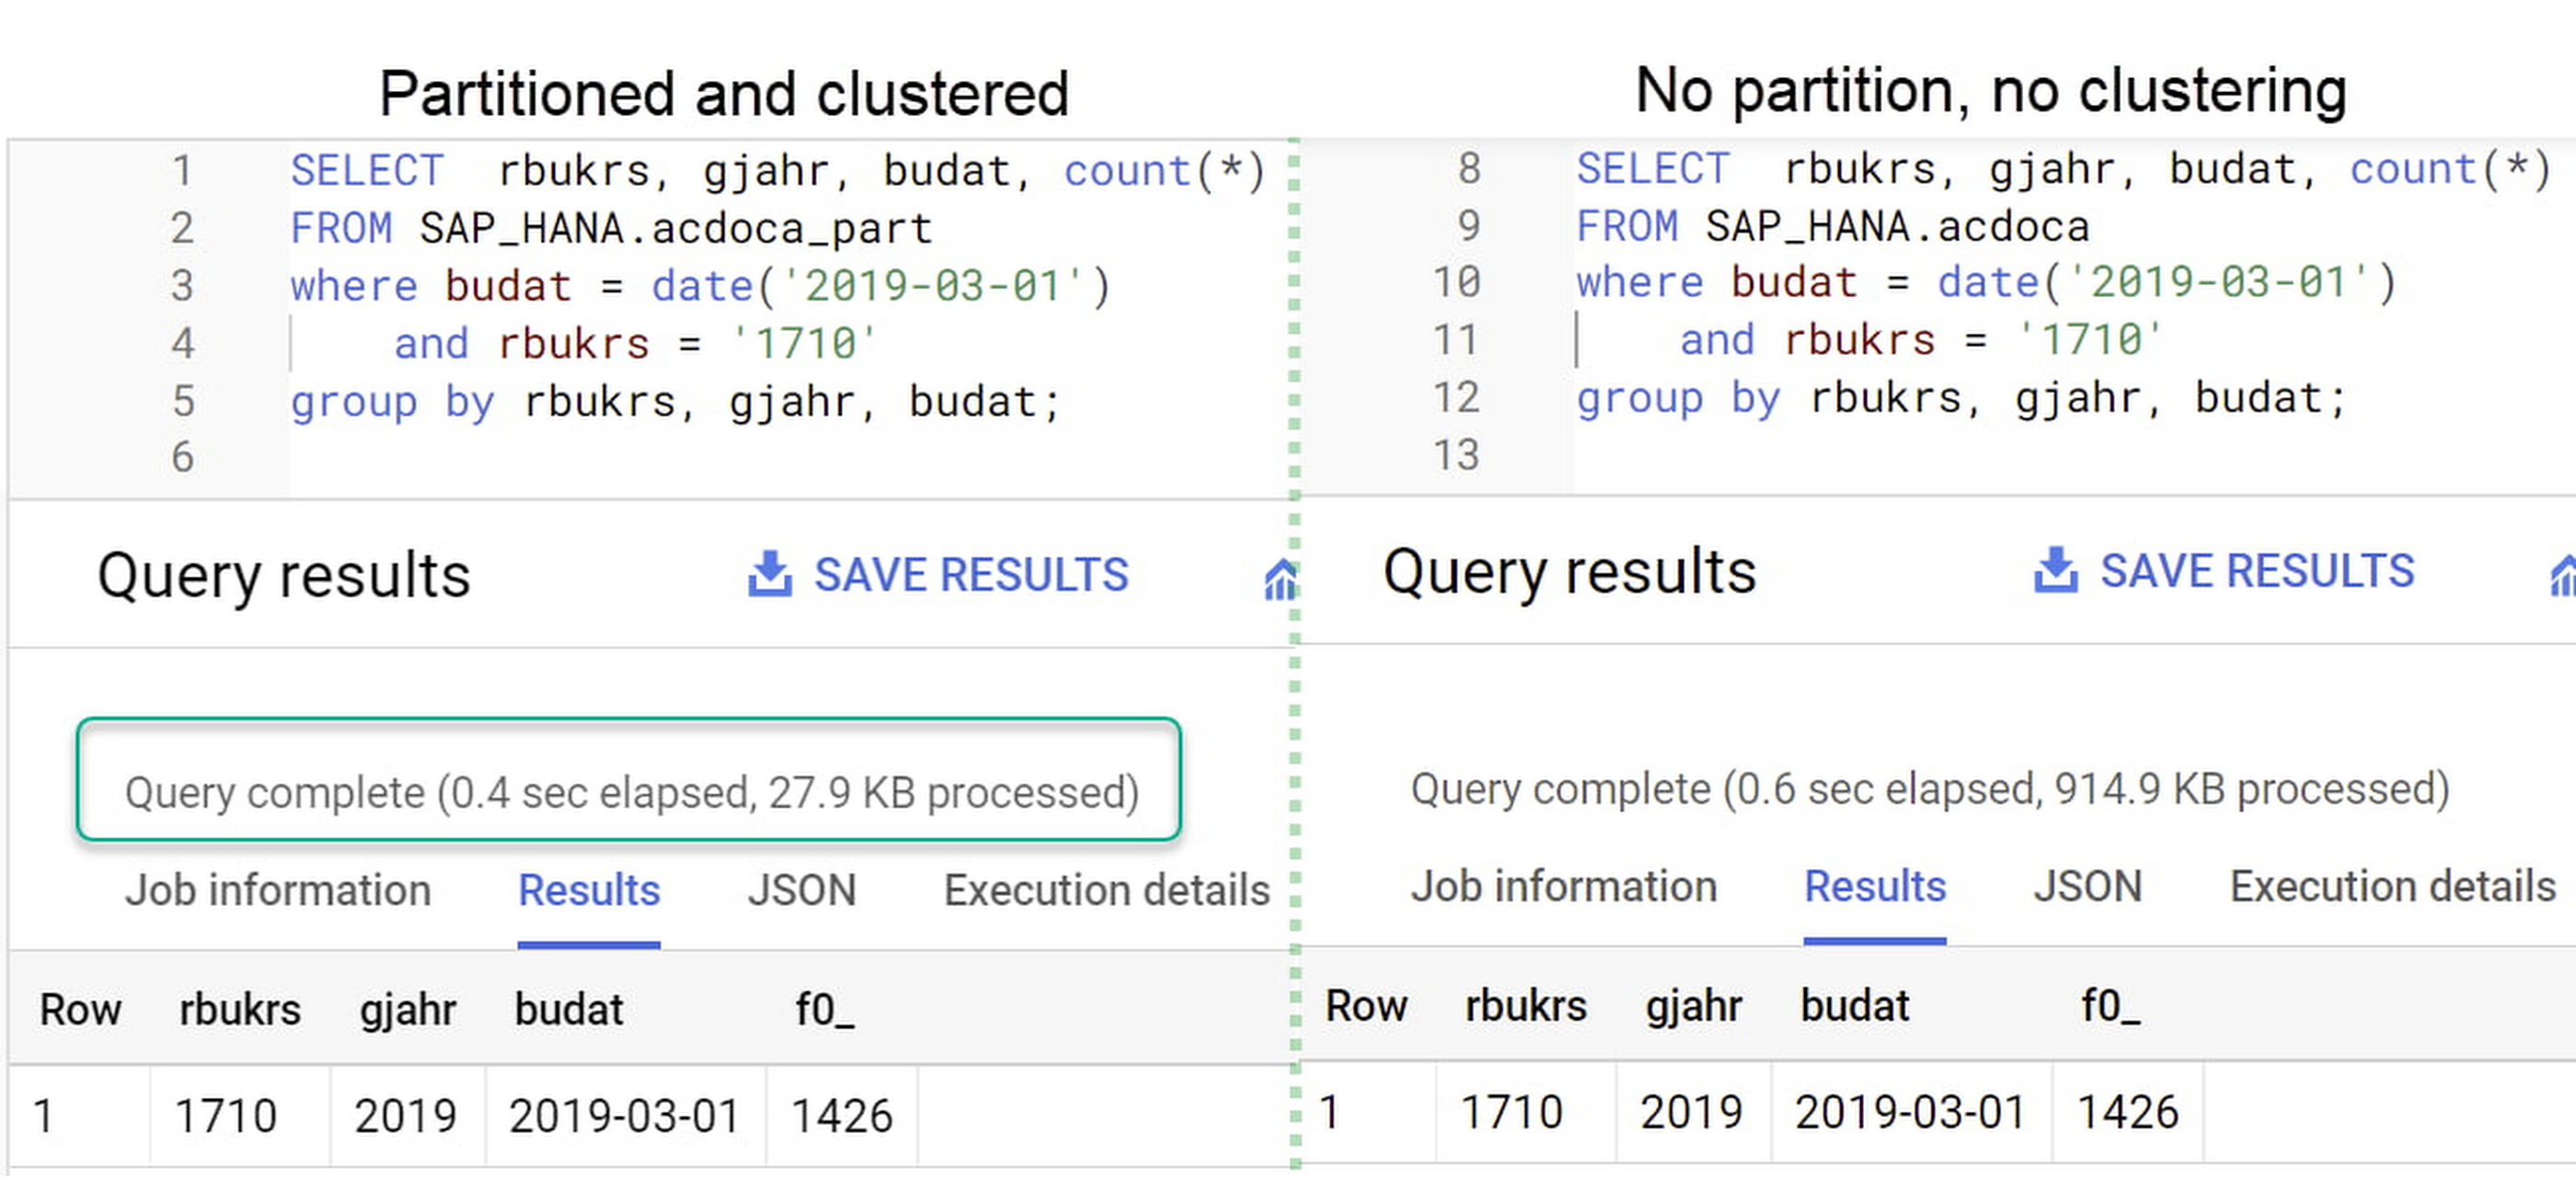
A great feature is that BigQuery will also periodically recluster the data automatically.
Materialized views
In BigQuery, materialized views are precomputed views that periodically cache the results of a query for better performance and efficiency. BigQuery uses precomputed results from materialized views and, whenever possible, reads only the delta changes from the base table to compute up-to-date results quickly. Materialized views can be queried directly or can be used by the BigQuery optimizer to process queries to the base table.
Queries that use materialized views are generally completed faster and consume fewer resources than queries that retrieve the same data only from the base table. If workload performance is an issue, materialized views can significantly improve the performance of workloads that have common and repeated queries. While materialized views currently only support single tables, they are very useful common and frequent aggregations like stock levels or order fulfillment.
Further tips on performance optimization while creating select statements can be found in the documentation for optimizing query computation.
Deployment pipeline and security
For most of the work you’ll do in BigQuery, you’ll normally have at least two delivery pipelines running — one for the actual objects in BigQuery and the other to keep the data staging, transforming, and updated as intended within the change-data-capture flows. Note that you can use most existing tools for your Continuous Integration / Continuous Deployment (CI/CD) pipeline — one of the benefits of using an open system like BigQuery. But, if your organization is new to CI/CD pipelines, this is a great opportunity to gradually gain experience. A good place to start is to read our guide for setting up a CI/CD pipeline for your data-processing workflow.
When it comes to access and security, most end-users will only have access to the final version of the BigQuery views. While row and column-level security can be applied, as in the SAP source system, separation of concerns can be taken to the next level by splitting your data across different Google Cloud projects and BigQuery datasets. While it’s easy to replicate data and structures across your datasets, it’s a good idea to define the requirements and naming conventions early in the design process so you set it up properly from the start.
Start driving faster and more insightful analytics
The best piece of advice we can give you is this: Try it yourself. Anyone with SQL knowledge can get started using the free BigQuery tier. New customers get $300 in free credits to spend on Google Cloud during the first 90 days. All customers get 10 GB storage and up to 1 TB queries/month, completely free of charge. In addition to discovering the massive processing capabilities, embedded machine learning, multiple integration tools, and cost benefits, you’ll soon discover how BigQuery can simplify your analytics tasks.
If you need additional assistance, our Google Cloud Professional Services Organization (PSO) and Customer Engineers will be happy to help show you the best path forward for your organization. For anything else, contact us at cloud.google.com/contact.
How a Mid-Sized Firm is Shrinking Inventory Carryovers 50% with AI

7432
Of your peers have already read this article.
5:30 Minutes
The most insightful time you'll spend today!
For more than 10 years, NMK Textile Mills has manufactured bed linens for major retailers in the United States and Canada. As e-commerce exploded, the company’s co-founder saw an opportunity to grow the business. So, in addition to manufacturing bed linens wholesale for retail customers, NMK Textile Mills reworked its complete supply chain to manufacture products for California Design Den, which became an e-commerce retailer selling its own fashion-forward products directly to consumers online.
With California Design Den’s push into e-commerce, it became apparent the SMB company (with about 250 global employees) faced the same tough supply chain questions as large retail customers, including maintaining enough inventory to meet customer demand in a timely, efficient way.
California Design Den depended upon a myriad of systems to track its complex forecasting and reordering processes. Team members typically planned inventory manually using desktop spreadsheet software, which could lead to excess inventory. Accurately forecasting demand and supply was essential to the company’s financial success—but it was also a challenge.
A couple years ago, California Design Den partnered with Pluto7, a technology solutions provider that offers a software as a service (SaaS) called Planning In A Box. Leveraging Google Cloud Platform machine learning and artificial intelligence, Planning In A Box intelligently helps predict demand and balances it with supply.
But that was just the beginning. “Along the way, we realized that to compete with larger retailers, make quicker decisions, and move faster, we needed to go further,” says Deepak Mehrotra, Co-founder and Chief Adventurer at California Design Den.
With guidance from Pluto7, California Design Den began migrating its database to Google Cloud Platform. Using Google BigQuery, Google Compute Engine, Google Cloud SQL, and Google Cloud Storage, and experimenting with Google Cloud Vision and Google Cloud AutoML, the company is reducing inventory carryovers by more than 50%, improving the accuracy of demand planning quarter over quarter, and gaining granular insights into how individual SKUs are performing.
“We would need an army of data scientists to make faster decisions on pricing and inventory levels. With Google Cloud Platform machine learning and artificial intelligence, we don’t need that. We can make much faster pricing decisions to optimize profitability and move inventory.”
—Deepak Mehrotra, Co-founder and Chief Adventurer, California Design Den
No need for army of data scientists
“Using Google Cloud Platform machine learning and AI was essential for California Design Den if it was to compete successfully with larger retailers,” Deepak says.
For example, tastes and fashions in bed linens can change quickly and consumer prices fluctuate. With more than 2,500 SKUs, it wasn’t possible for California Design Den’s team to continuously monitor product demand and experiment with competitive pricing in real time.
“We would need an army of data scientists to make faster decisions on pricing and inventory levels,” says Deepak. “With Google Cloud Platform machine learning and artificial intelligence, we don’t need that. We can make much faster pricing decisions to optimize profitability and move inventory.”
By integrating all its data onto Google Cloud Platform, California Design Den’s team gains deeper insights into product sales over time, which in turn helps the company improve demand planning by better determining which styles to manufacture and sell in the future.
“When experienced employees leave, their knowledge leaves with them. By having all data in one place, and with machine learning and AI, California Design Den can go back in its history, look at products made or sold years ago, and analyze product performance.”
—Deepak Mehrotra, Co-founder and Chief Adventurer, California Design Den
Merging visuals with data
Before Google Cloud Platform, team members had to dig through spreadsheets and run scenarios to get a sense of how particular products had sold. The next step was to perform keyword searches across the company’s photo library in the cloud to find each product’s image. From there, a team member would insert the product images into a presentation, along with relevant data points, to provide a report for stakeholders on how particular styles performed.
Today, California Design Den, with the help of Pluto7, is integrating its entire product image library with its database on Google Cloud Platform. Experimenting with Google Cloud Vision and Google Cloud AutoML, California Design Den is moving towards a day when team members can run sales scenarios and get deep background data on individual product performance while viewing images of the relevant products.
Merging product visuals with data will help designers and team members better understand sales patterns over time and in context. In the past, making correlations between things like which sheet colors sold well in California, compared to how the same sheet colors performed on the East Coast, was something that California Design Den employees primarily did in their heads.
“When experienced employees leave, their knowledge goes with them,” says Manjunath Devadas, Founder and CEO at Pluto7. “By having all data in one place, and with machine learning and AI, California Design Den can go back in its history, look at products made or sold years ago, and analyze product performance.”
“We are literally growing the complexity of our business on all levels, including designing, manufacturing, selling, reordering, inventory holding—everything.”
—Deepak Mehrotra, Co-founder and Chief Adventurer, California Design Den
Reimagining supply-demand balancing
Pluto7’s mission statement is to democratize supply demand balancing with machine learning and AI. California Design Den is a case in point, as the combination of Planning In A Box and Google Cloud Platform gives the company greater control over its destiny.
“Big retailers used to tell us what to manufacture and how much they would pay for it,” says Deepak. “That was our primary business, and if we didn’t accept the terms, a competitor would.” Today, in addition to continuing to make products for retailers, California Design Den can design, make, and sell a variety of designs for itself, including custom and limited-edition products, thanks to Google Cloud Platform and Pluto7 software offerings. The payoff is not only in having a more diversified business. California Design Den also receives more favorable profit margins by selling its own products.
“We are literally growing the complexity of our business on all levels, including designing, manufacturing, selling, reordering, inventory holding—everything,” Deepak says. “We can make smaller batches. We can connect directly with consumers. We can identify the missing pieces—what should we produce next, when, and how much? We otherwise couldn’t afford the level of talent it would take to do this.”
Cutting through the noise
Google and Pluto7 software helped California Design Den reduce inventory carryovers by more than 50%. Inventory tracking and distribution, along with insights and visibility into product sales, are faster, more efficient, and accurate. Google Cloud Platform flexible pricing, speed, reliability, security, and scalability enable California Design Den to stay relevant and be more competitive.
In addition to benefiting from Google Cloud Platform, California Design Den relies on G Suite—also part of Google Cloud—to enhance collaboration among its global teams. Previously, the company’s email server would sometimes crash, due to the heavy load of sharing product photos and other data. “Gmail and Google Drive handle the everyday demands on the business effortlessly and reliably,” Deepak says.
“Google machine learning and AI enable us to cut through all the noise from raw data, so we can see what’s important. We can focus on analytics to guide us to success today and in the future.”
—Deepak Mehrotra, Co-founder and Chief Adventurer, California Design Den
The company is exploring additional ways to leverage Google Cloud Platform in the near future. For example, one possibility is to import customer reviews from sites where products are sold into Google BigQuery, and to use that data to perform sentiment analysis via Google Cloud Natural Language. It could provide another valuable data source to help California Design Den’s team decide where to focus future designs.
“Google machine learning and AI enable us to cut through all the noise from raw data, so we can see what’s important,” Deepak says. “We can focus on analytics to guide us to success today and in the future.”
Serverless and BigQuery Together on Google Cloud: Behind the L’Oreal Beauty Tech Data Platform

5339
Of your peers have already read this article.
4:00 Minutes
The most insightful time you'll spend today!
Editor’s note: In Today’s guest post we hear from beauty leader L’Oréal about their approach to building a modern data platform on fully managed services: managing the ingest of diverse datasets into BigQuery with Cloud Run, and orchestrating transformations into relevant business domain representations for stakeholders across the organization. Learn more about how businesses have benefited from Cloud Run in Forrester’s report on Total Economic Impact.
L’Oréal was born out of science. For over 100 years, we have always shaped the future of beauty, and taken its eternal quest to new horizons. This has earned us our current position as the world’s uncontested beauty leader (~€ 32 B annual sales in 2021), present in 150 countries with over 85,000 employees.
Today, with the power of our game-changing science, multiplied by cutting-edge technologies, we continue our lifelong journey of shaping the future of beauty.
As a Beauty Tech company, we leverage our decades-long heritage of rich data assets to empower our decision-making with instant, sophisticated analysis.
Because we oversee global brands, which must adapt to local requirements, we need to maintain a deep understanding of what a brands’ data represents, while managing disparate legal and regulatory requirements for different countries. Our end goal is to run a safe, compliant and sustainable data warehouse as efficiently and effectively as possible.
We sync and aggregate internal and external data from a wide variety of sources across organizations and retail stores. This made the management of our data warehouse infrastructure used to be very complex and hard to manage before Google Cloud. L’Oréal’s footprint was so large that we once found it impossible to have a standardized method to handle data. Every process was vendor-specific, and the infrastructure was brittle. We went looking for a solution to our complex data infrastructure needs, and defined the following non-negotiable principles:
- No Ops: The job of a developer at L’Oréal is not to manage servers. We need an elastic infrastructure that scales on demand, so that our developers can focus on delivering customized and inclusive beauty experiences to all consumers, rather than focusing on managing servers.
- Secure: We have strict security and compliance requirements which vary by country, and we employ a zero-trust security strategy. We must keep both our own internal data and customer data safe and encrypted.
- Sustainable : Our data lives in multiple environments, including on-prem data centers and public cloud services. We must be able to securely access and analyze this data while minimizing the complexity and environmental impact of moving and duplicating data.
- End-to-end supervision: Because developers shouldn’t be managing servers, we need a “single pane of glass” dashboard to monitor and triage the system if something goes wrong.
- Easy-to-deploy: Deploying code safely should not compromise velocity. We are constantly developing innovations that push the boundaries of science and reinvent beauty rituals. We need integrated tools to make our code deployment process seamless and safe.
- Event-driven architecture: Our data is used globally by research, product, business and engineering teams with high expectations on data quality and timeliness. Many of our internal processes and analysis are based on near real-time data.
- Data products delivered “as a service”: We want to empower our employees to drive business value at record speed. To that end, we need solutions that enable us to remove the developers from the critical path of solution delivery as much as possible.
- Extract-load-transform (ELT): Our goal is to implement the pattern to load data as soon as possible into the data warehouse to take advantage of SQL transformations.
After considering multiple vendors on the market, with these principles in mind, we landed on end-to-end Google Cloud serverless and data tooling. We were already using Google Cloud for a few processes, including BigQuery, and loved the experience.
We’ve now expanded our use of Google Cloud to fully support the L’Oréal Beauty Tech Data Platform.
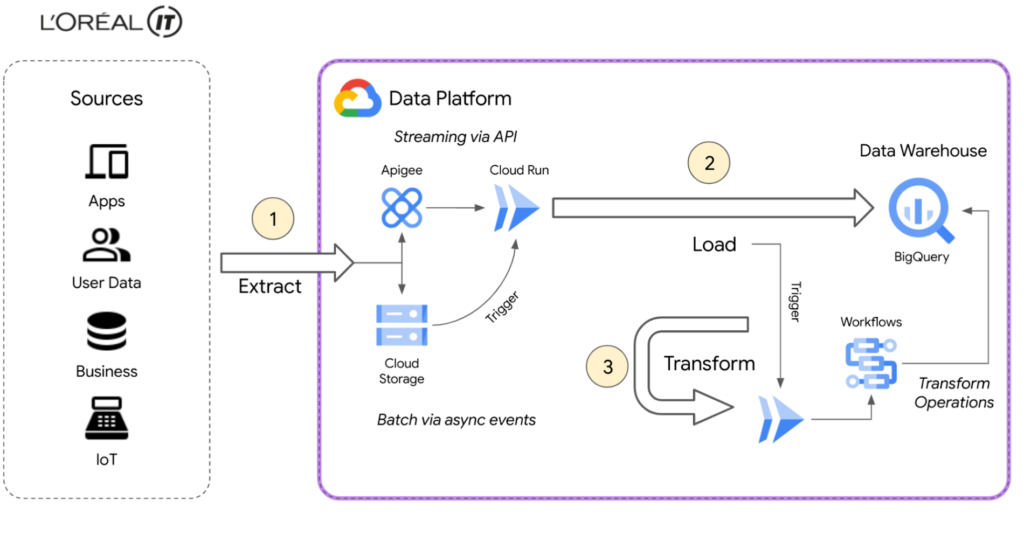
L’Oréal’s Beauty Tech Data Platform incorporates data from two types of sources: directly via API, which is data that adapts easily to our schema and is inserted directly into BigQuery, and bulk data from integrations, which require event-driven transformations using Eventarc mechanisms. These transformations are performed in Cloud Run and Cloud Functions (2nd gen), or directly in SQL. With Google Cloud, we can adapt very quickly.
Today, we currently have 8500 flows for ~5000 users using the native zero-trust capabilities offered by Google Cloud. Indeed, the flows come from Google Cloud and other third-party services.
BigQuery enabled us to adopt standard SQL as our universal language in our data warehouse and meet all expectations for queries and reporting. We were also able to load original data using features like federated queries, and efficiently transitioned from ETL to ELT data ingestion by handling semi-structured data with SQL. This approach of loading original data from sources into BigQuery with non-destructive transformations allows us to reprocess data for new use-cases easily, directly within BigQuery.
Our applications are hosted on multiple environments – on-premises, in Google Cloud, and in other public clouds. This made it difficult for our data engineers and analysts to natively analyze data across clouds until we started using BigQuery Omni. This capability of BigQuery allowed us to globally access and analyze data across clouds through a single pane of glass using the native BigQuery user interface itself. Without BigQuery Omni, it would’ve been impossible for our teams to natively do cross-cloud analytics. Moreover, it eliminated the need for us to move sensitive data, which is not only expensive because of local tax and subsea transport, but also incredibly risky – sometimes even forbidden – because of local regulations.
Today Google Cloud powers our Beauty Tech Data Platform, which stores 100TB of production data in BigQuery and processes 20TB of data each month. We have more than 8000 governed datasets, and 2 millions of BigQuery tables coming from multiple data sources such as Salesforce, SAP, Microsoft, and Google Ads.
For more complex transformations where custom and specific libraries are required, Cloud Workflows help us to manage the complexity very efficiently by orchestrating steps in containers through Cloud Run, Cloud Functions and even BigQuery jobs — the most used way to transform and add value to the L’Oréal data.
Additionally, by using BigQuery and Google Cloud’s serverless compute for API ingestion, bulk data loading, and post-loading transformations, we can keep the entire system in a single boundary of trust at a fraction of the cost. With ingest, queries, and transformations all being fully elastic and on-demand, we no longer have to perform capacity planning for either the compute or analytics components of the system. And of course these services’ pay-as-you-go model perfectly aligns with L’Oréal’s strategy of only paying for something when you use it.
Google Cloud fulfilled the requirements of our Beauty Tech Data Platform. And as if offering us a no-ops, secure, easy-to-deploy, custom-development free, event-based platform with end-to-end supervision wasn’t enough, Google Cloud also helped us with our sustainability efforts.
Being able to measure and understand the environmental footprint of our public cloud usage is also a key part of our sustainable tech roadmap. With Google Cloud Carbon Footprint, we can easily see the impact of our sustainable infrastructure approach and architecture principles. Our Beauty Tech platform is a strategic ambition for L’Oréal: inventing the beauty products of the future while becoming the company of the future.
Sustainable tech is an imperative and a very important step towards this ambition of creating responsible beauty for our consumers, and sustainable-by-design tech services for our employees. We all have a role to play, and by joining forces, we can have a positive impact.
Google Cloud’s data ecosystem and serverless tools are highly complementary, and made it possible to build a next-generation data analytics platform that met all our needs.
Get started using serverless and BigQuery together on Google Cloud today.
2799
Of your peers have already watched this video.
41:30 Minutes
The most insightful time you'll spend today!
Real-world Data Integration Patterns
Learn the basics of Google Cloud Data Integration. How do you go from basic, hardcoded data pipelines to making your solution is dynamic and reusable? How do you parameterize your pipelines? What is the difference between parameters and variables, and when should you use them?
Nidhi Modh, Product Manager, Google Cloud, answers all these questions and more. He contrasts practices with traditional views of data integration, the benefits and the challenges.
Explore some common design patterns for moving and orchestrating data, including incremental and metadata-driven pipelines. Discover best practices and lessons learned and highlight common data engineering best practices for building scalable and high-performing data integration solutions.
More Relevant Stories for Your Company

How Do You Cut Costs and Improve Staff Productivity, and Business Visibility? Ascend Money Has an Answer
Hundreds of millions of residents of South East Asia have only limited access to banking and finance services. However, help is at hand. One of South East Asia's largest fintech businesses, Ascend Money is using digital technologies to realize its mission of enabling as many people as possible to access

Home Depot’s Interconnected Retail Experience by Virtue of Google Cloud Migration for SAP Applications
With nearly 2,300 stores, The Home Depot is the world’s largest home-improvement chain — a brand that professional contractors and DIYers alike have come to depend on. The home improvement industry continues to experience unprecedented demand and dramatic increases in online ordering accompanied by expanding consumer expectations for things like




The True Story of How HotStar Broke a World-Record–Thanks to Firebase and Google BigQuery
Hotstar, India’s largest video streaming platform with 150 million monthly active users around the world, provides live-streaming of TV shows, movies, sports, and news on the go. By using a combination of Firebase products together, Hotstar safely rolled out new features to its watch screen during a major live-streaming event

An Expert’s Opinion on What Early-stage Startups Must Know
As lead for analytics and AI solutions at Google Cloud, my team works with startups building on Google Cloud. This puts us in the fortunate position to learn from founders and engineers about how early-stage startups’ investments can either constrain them or position them for success, even at the seed
