





An Expert’s Opinion on What Early-stage Startups Must Know

6475
Of your peers have already read this article.
3:00 Minutes
The most insightful time you'll spend today!
As lead for analytics and AI solutions at Google Cloud, my team works with startups building on Google Cloud. This puts us in the fortunate position to learn from founders and engineers about how early-stage startups’ investments can either constrain them or position them for success, even at the seed level. In this post, I want to share a few of the best practices to keep in mind as you’re building.
Understand your value proposition before diving into a technology stack
If you’re launching a startup in the cloud, you’re no doubt thinking about a technology stack, but it’s important to step back a bit and think carefully about the major value proposition that your startup offers to your customers. That value proposition is going to fundamentally drive the kind of technology that you should pick.
For example, does your system need processing in real time, or can it be done in a batch mode? Can you rely on once-a-day insights or do the insights have to come in as events happen?
Additionally, what kind of latency will your customers face? That latency makes your value proposition either usable or unusable. Early on in Google’s development, leaders realized that no one was going to wait more than a few hundred milliseconds for a web page to show them their results, and that realization drove the technology decisions that have allowed Google to scale from being a startup in a garage to being a trillion dollar company. Your startup needs to define its value to customers with this level of specificity before it can build a technology stack suited to its needs.
Focus on customer interactions
A few companies have gracefully pulled off big IT pivots that reshaped their value proposition. Netflix, for example, moved from mostly sending DVDs through the mail to becoming a streaming service and major content producer. That’s a huge shift in the user experience and the technology stack necessary to support it, even if the underlying value proposition (i.e., get content to customers) was broadly the same. But it’s also an outlier. If you’re planning for potential changes of this magnitude, rather than focused on getting your value proposition to users, you probably need to sharpen what that value proposition is.
Specifically, you need a clear vision of how customers will access and interact with your business. Typically, they’ll do so over a website or a mobile app, but there are still so many variables.
Are customers going to transmit documents? If so, in what format? Is handwriting supported or is input limited to typing? Can they use images for optical character recognition? Will it mostly be forms? Will the data be structured or unstructured? If all that sounds a little overwhelming, don’t worry, it’ll seem simpler by the end of this article—but also be aware: we’re just getting warmed up.
Imagine that most of your customers will access your business via voice, so you know you’ll want to prioritize conversational workflows. That’s a start—but dig deeper. Even if we suppose you’re usingDialogflow, a Google Cloud conversational AI platform that lets you build and deploy virtual agents, we’re still not really seeing the value proposition. How will all this work, from the beginning of a typical full customer interaction to the resolution? How many interactions will have to be facilitated over low-bandwidth connections, for example? When it comes to user interactions, make sure you can see an end-to-end use case.
Another example: you’re building a retail website, and one of your end-to-end use cases involves the customer asking if a certain amount of a given product is in stock, whether it’s one unit of the product, ten or hundreds. If the product is not sufficiently stocked, you want your app to offer similar items that are. Will your technology stack support this end-to-end use case?
These considerations are not an argument for premature optimization. There’s value in moving fast, getting minimum viable products to users, and then iterating. But in the early stages, you only get one chance to start on the right foot—and how you navigate that chance will influence a lot of dollars and effort down the road. You need to make sure you have business use cases, not just an idea, before you can start designing a technology stack.
Here’s how to get in the right frame of mind. Pick three use cases: two that are “bread and butter” and one that is technologically complex. Make sure your proposed technology stack can support all three, end to end.
Default toward higher levels of abstraction
Now that we’re in the right frame of mind, we’re ready to think about the technology stack more directly.
As a startup, you’ll need to conserve resources, and to do that, you’ll want to build at the highest level of abstraction possible for your value proposition. For example, you probably don’t want your people setting up clusters. You don’t want them configuring things if they can use a fully managed service. You want them focused on building your prototype, not managing infrastructure.
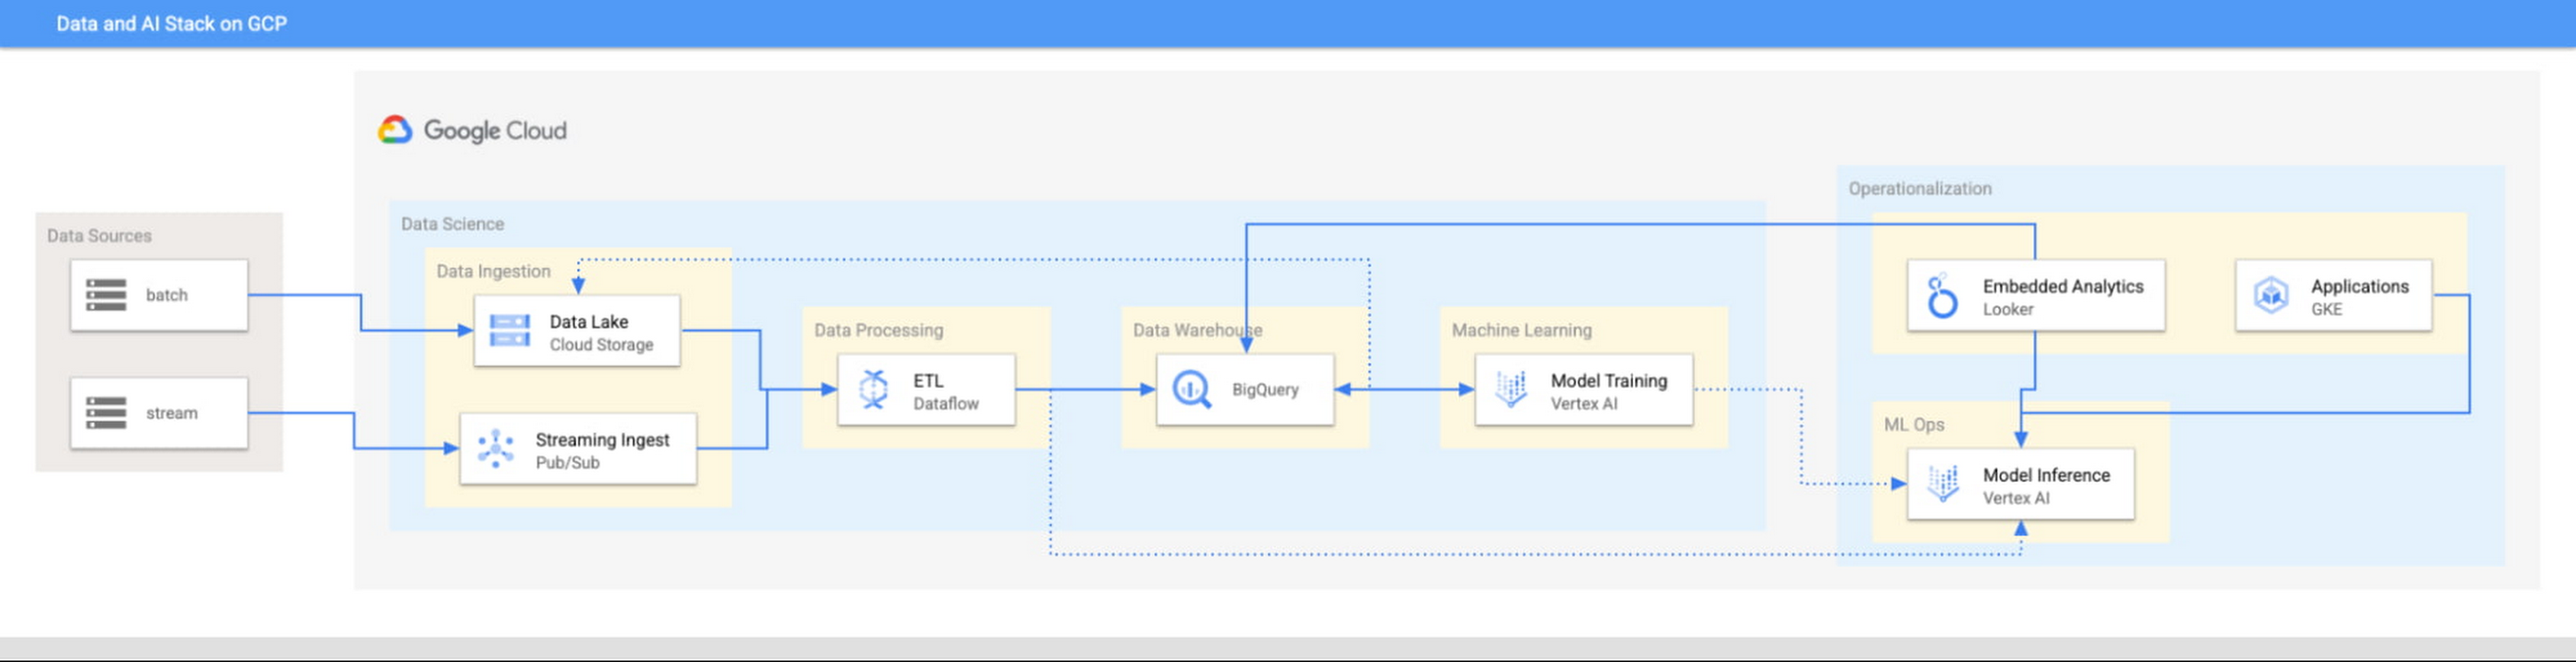
This focus has definitely informed how we create products at Google Cloud, as our canonical data stack—Pub/Sub, Dataflow, BigQuery, and Vertex AI—consists of auto-scaling and serverless products.
But management of infrastructure is not the only place where you should err toward a less-is-more philosophy.
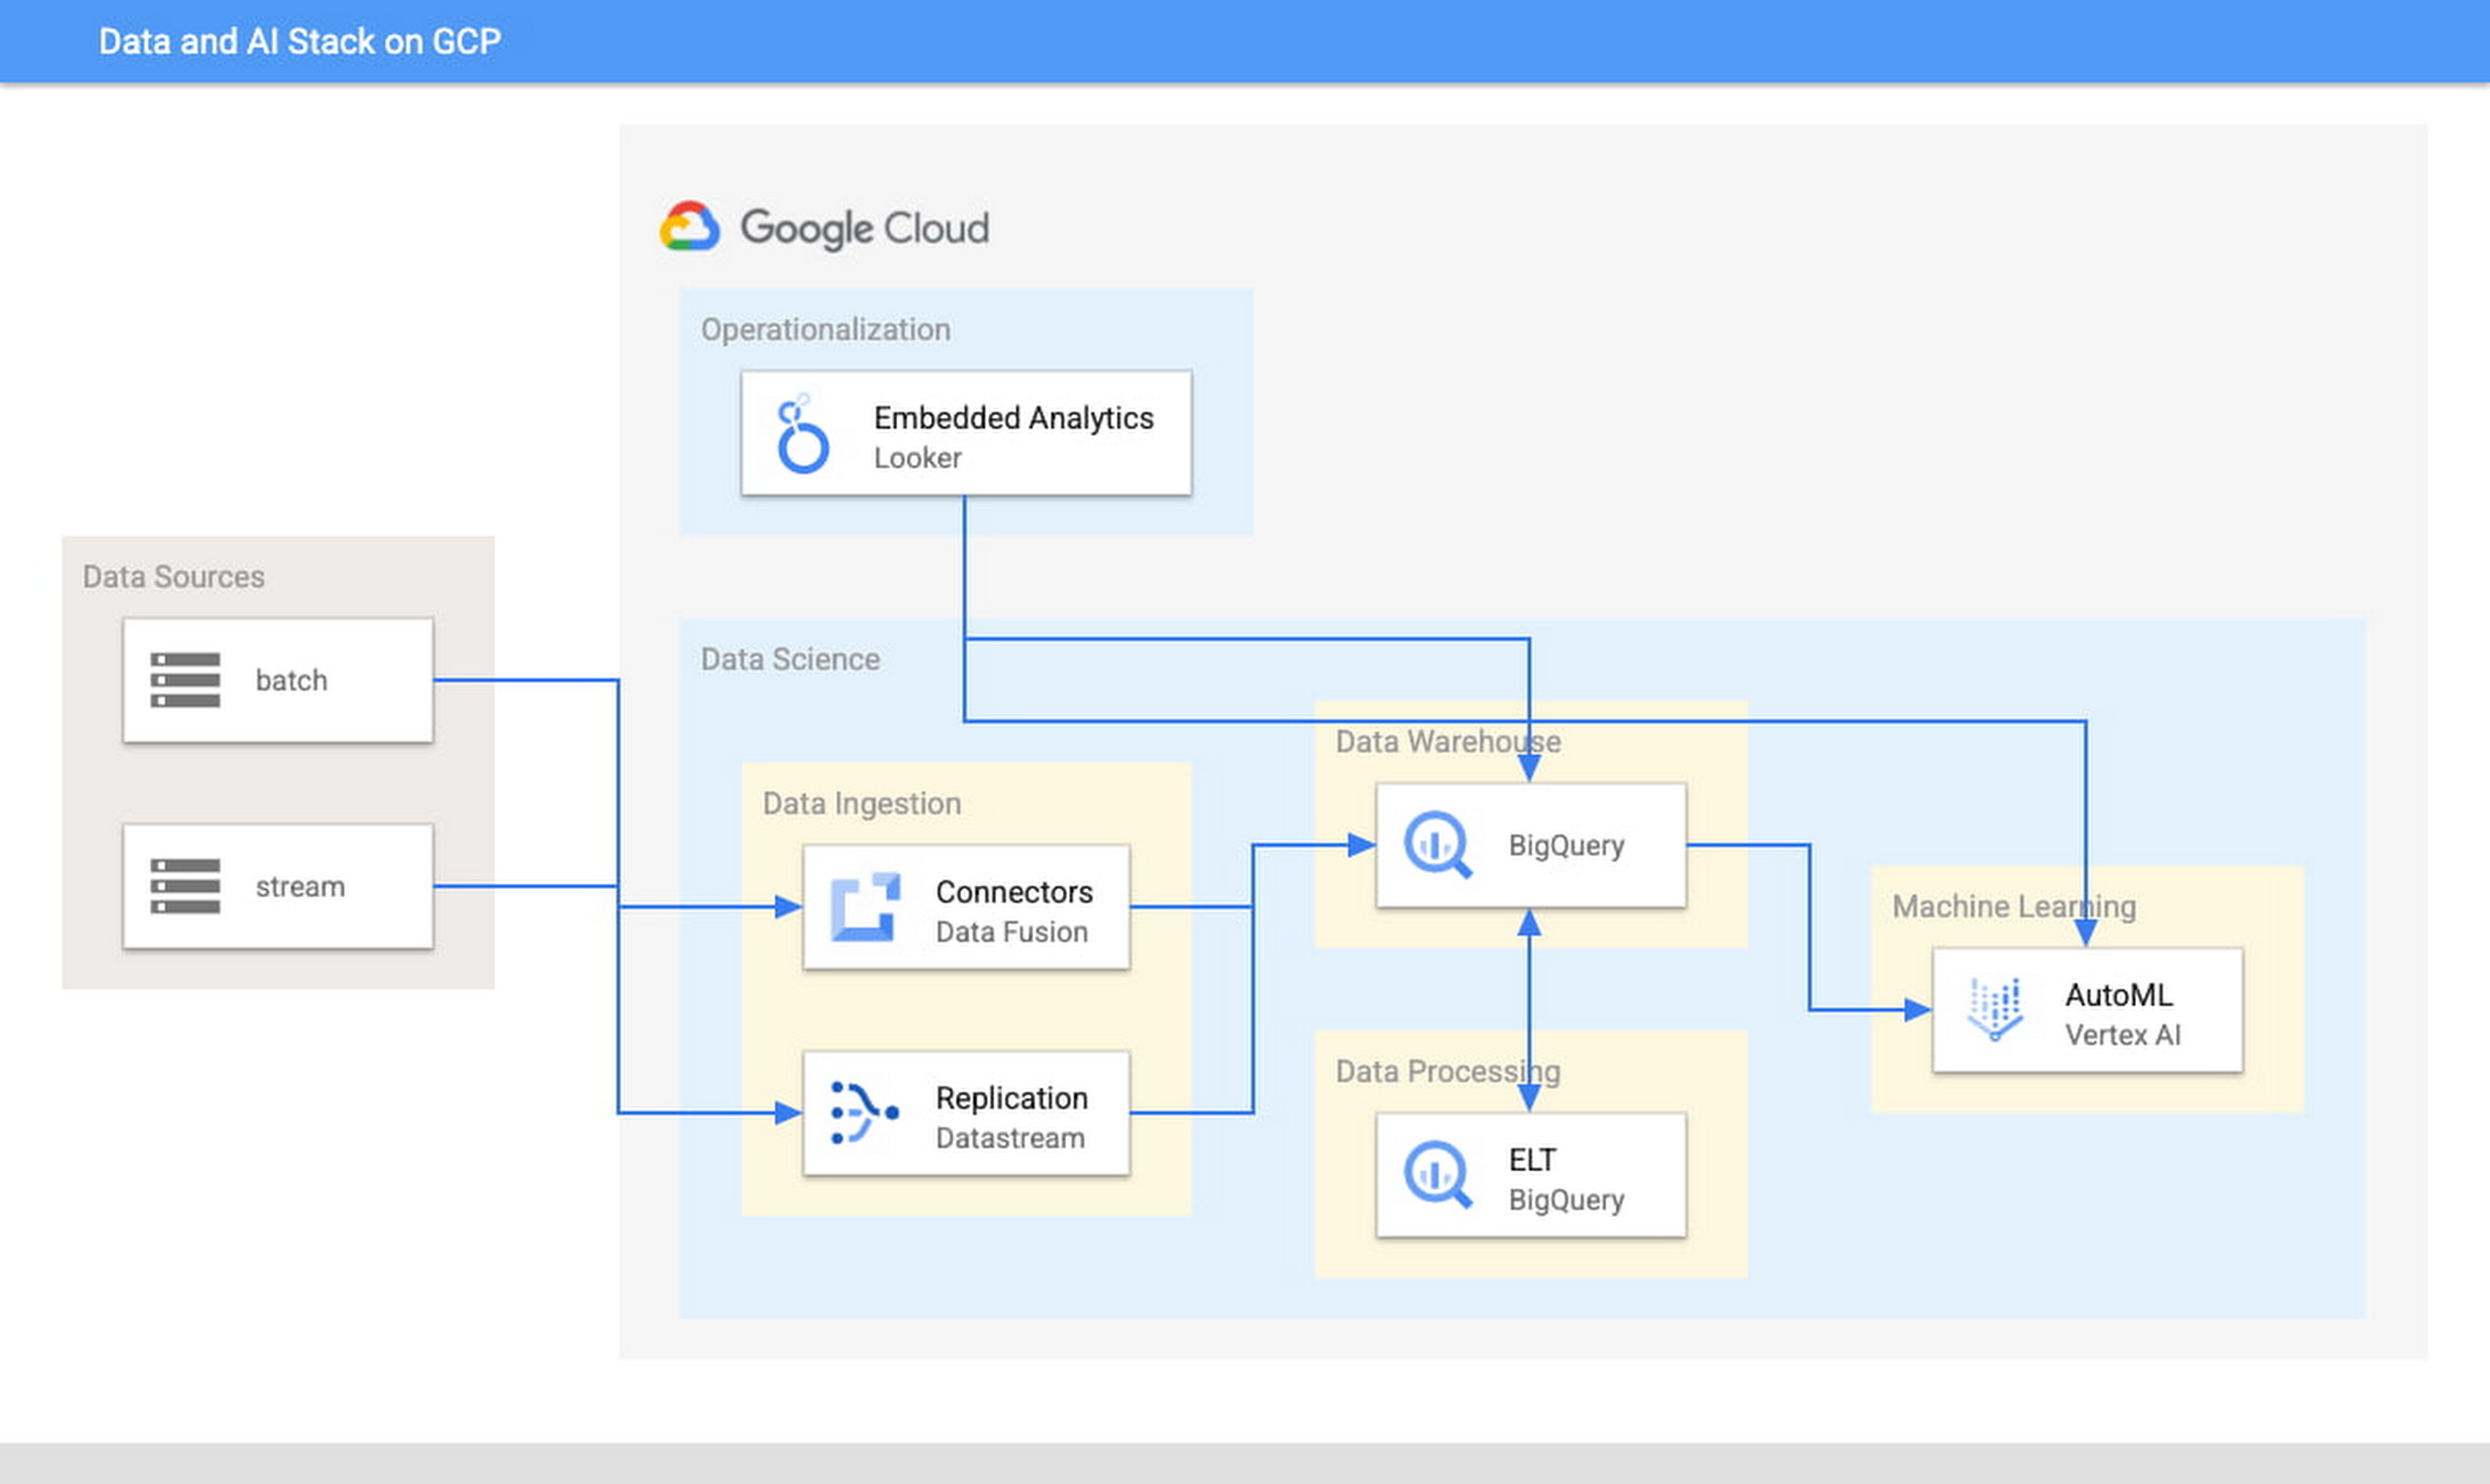
When it comes to architecture, choose no-code over low-code and low-code over writing custom code. For example, rather than writing ETL pipelines to transform the data you need before you land it into BigQuery, you could use pre-built connectors to directly land the raw data into BigQuery. That’s no code right there. Then, transform the data into the form you need using SQL views directly in the data warehouse. This is called ELT, and it is low code. You will be a lot more agile if you choose an ELT approach over an ETL approach.
Another place is when you choose your ML modeling framework. Don’t start with custom TensorFlow models. Start with AutoML. That’s no-code. You can invoke AutoML directly from BigQuery, avoiding the need to build complex data and ML pipelines. If necessary, move on to pre-built models from TensorFlow Hub, HuggingFace, etc. That’s low-code. Build your own custom ML models only as a last resort.
Focus on getting your vision to market, not chasing technology hype
The goal is to pick the right technology stack for bringing your vision to market, generating value for customers, conserving resources, and maintaining flexibility for growth. Early IT investments should usually gravitate toward things that preserve flexibility, such as managed services built on standard protocols or open APIs, but they needn’t always rush to the flashiest technologies. The answer isn’t always ML, for example. The answer might be heuristics to start, with a path to ML once you have collected enough data. You want to make sure that your intelligence layer has enough abstraction so you can mark it up with simple rules at first, but then replace it with a more robust system as you go along.
Launch and iterate fast with these principles
The preceding discussion is a reminder that your most expensive resource is your people—and that you really want them to be focused on building your prototype, minimum viable product or production app You want to launch fast and iterate fast, and the only way you can do that is by focusing on the things that differentiate you.
But regardless of the technologies you use, the bottom line is the same: follow these four principles.
- Figure out your major value proposition and design your tech stack around it.
- Be very careful about user interactions. User experience is super important; you need to make sure you deliver the kind of experience that your customers have grown to expect.
- When you’re building, pick the highest possible level of abstraction possible—the most fully managed tools and no-code/low-code frameworks that give you the functionality that you need.
- Instead of choosing new or flashy technologies, consider if you can build a “good enough” minimum viable product quickly and come back to a better implementation later.
To learn more about why startups are choosing Google Cloud, click here.
IKEA’s AI-driven Personalized and Real-time Recommendations Up its Conversion Rates and Average Order Value

4885
Of your peers have already read this article.
3:00 Minutes
The most insightful time you'll spend today!
Background
At IKEA we have multiple places in our customer journey in various channels where different kinds of personalization can deliver a superior customer experience. Product recommendations in the shopping basket, content recommendations in editorial sections, inspirational recommendations on product pages and more. After a while in the broader “recommendations” team there was a decision to split the team to have one sub-team focused on product recommendations. The pandemic altered customer behavior and needs as well. At that inflection point we decided to change our way of working and dive head-first into a more scientific approach to handle the operational complexities of delivering high quality product recommendations at scale. We deemed this necessary to improve our level of personalization and to have a holistic understanding of our customers.
Data Driven Decisions
The first step was to radically improve our ability to get high-quality quantitative information to understand how our ‘recommendation’ solutions affected personalization. We did this through high volume A/B testing on customer behaviour and after initial experimentation, we had a few key learnings:
- The mix of both UX and algorithms are really important for a cohesive customer experience.
- The quality of personalization can’t be measured in silos. Statistical significance can be attained by testing several groups of recommendations at once.
Once we came up with a solid framework for gathering data and acknowledged how little we knew about our customers, we were able to explore an incredible number of creative options – nothing was off the table. This was a very humbling experience, in that it opened up new perspectives for personalization, a more curious and less confined way of thinking. We learned to trust the data because it might show you things you don’t expect.
Experimentation and Learning Framework
Our teams created ways to quickly deploy experimental modifications to our existing solution. This enabled experimentation in the front-end with the user experience, including details in headings and images. This also covered tweaks in the backend with anything from detailed manual additions or removals of recommendations to mixing and matching of various algorithms both home grown and from Recommendations AI.
This flexibility came with an overhead–more complexity and cost relative to directly retrieving recommendations from Recommendations AI. However, the benefit was that we were no longer dependent on manual evaluation of what made for a good recommendation system. We aligned on a data-driven and qualitative approach to provisioning recommendations and significantly accelerated our experimentation timeline. Together with optimization of the CI/CD pipeline this enabled the team to take an idea or hypothesis from inception to A/B testing with customers in less than half an hour.
Recommendations AI Experiments
Our team’s infrastructure was already running on GCP and when we received early access to Recommendations AI, the requirements to get started were minimal and that allowed us to start with initial tests requiring minimal effort and investment.
We started with a few use-cases and identified places where our existing recommendation algorithms needed improvement or complementary recommendations. We also explored additional ways where more useful information could be presented to the customers through personalized recommendations.
Recommendations AI Model Combinations
While Recommendations AI might be considered a simple API to get a set of product recommendations, as we dove deeper into the solution it became apparent that it could be tweaked in several different ways to offer many fine tuning configurations to meet business goals. While too much fine tuning and customization could lead to subpar performance, in general we found that it was a great strategy to give us several versions of ML powered recommendations to work with. The further you personalize the experience, the more options you have to likely pick the best one for the customer.
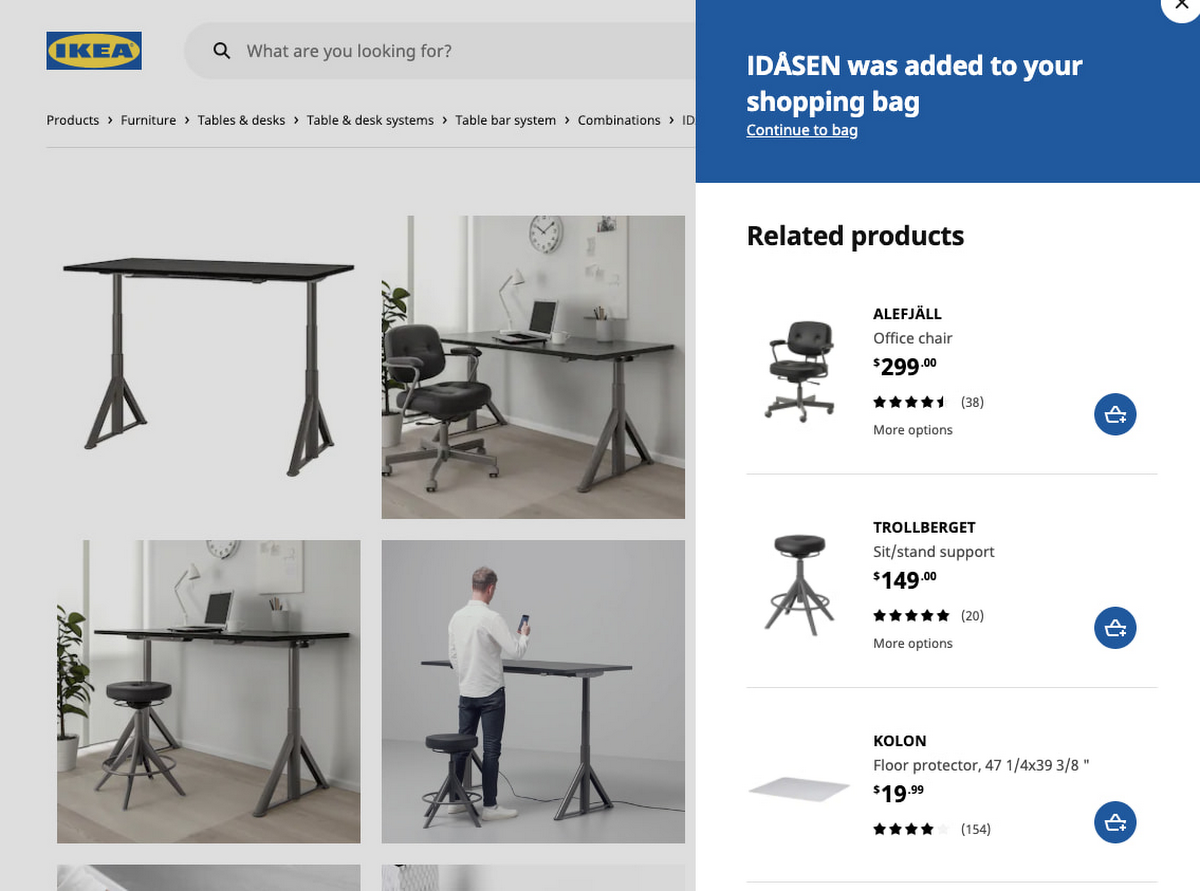
Recommendations AI models like ‘Recommended for you’, ‘Frequently Bought Together’ and ‘Others you may like’; are coupled with business goals like optimizing for conversion rate, click through rate and revenue. We experimented with many different model combinations and custom rules. All this was easily configurable right in the GCP console. One of the simplest custom configurations we used was to only recommend items that were in stock, and when items were out of stock we looked at similar items that were available to augment the experience.
Collaboration with Google
Our collaboration with Google Cloud accelerated our learning process during experimentation. We worked closely together early in the product development. Additionally, their model provided flexibility to change direction and allow for more options than we had previously. Ultimately, this provided us a way to drastically improve our time to market with a product that produced tremendous results that we could not have accomplished on our own.
Results and Takeaways
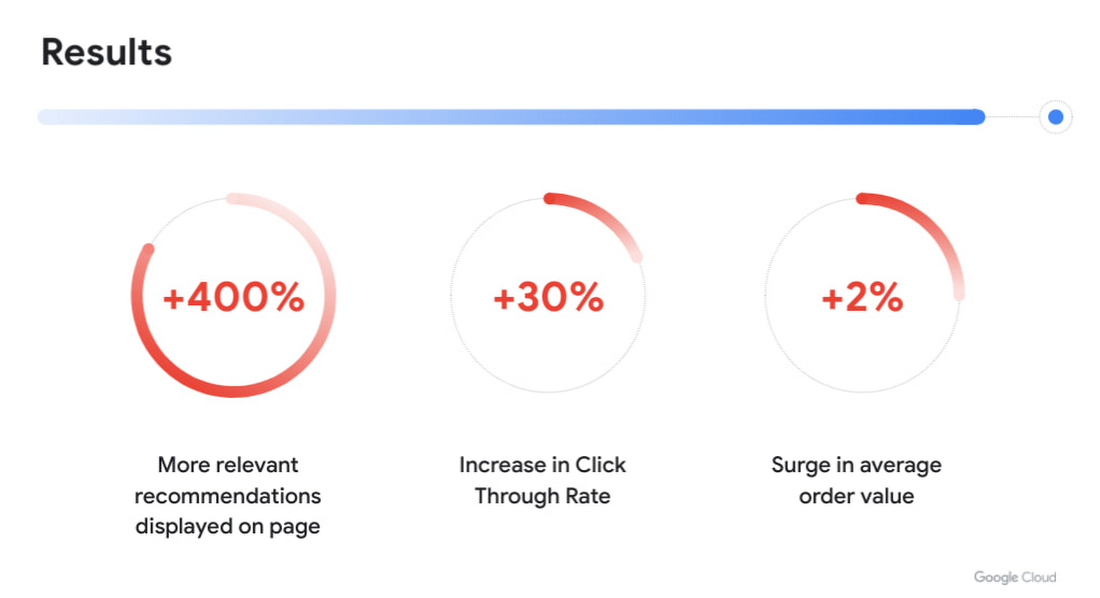
With more personalized and real-time recommendations available we saw great success. We were able to increase the number of relevant recommendations displayed on a page by +400%. To accommodate the wider repertoire of recommendations we had to change the user experience. For example, in some places we had horizontally scrolling displays of product recommendations which were much easier for customers to use.
Another consequence of displaying more personalized recommendations was tangible improvement to conversion rate and average order value. Recommendations AI algorithms helped customers in two ways:
- Customers were able to find products that they liked quickly and establish their preferred choice among other options more quickly as well, giving them confidence to make a purchase through much fewer clicks. Even though we previously already had well tuned recommendations of several types, with Recommendations AI we measured +30% improvement in click through rates.
- Average order value saw a +2% surge with numerous examples of how Recommendations AI could help customers find both attractive and directly complementary products, expanding the customer purchase from a single product to an entire home furnishing solution.
As a direct effect of having stronger business results, the team started exploring more places in the customer journey where our growing buffet of recommendations could be used. We’d start with an initial experiment to answer if displaying recommendations in the specific context made sense at all. Frequently the data that emerged from these experiments prodded us to iterate further on what additional types of recommendations would be most appropriate to show to the customer as the customer’s behaviour evolved. Today, most of IKEA’s site recommendations are powered by Recommendations AI.
One key takeaway is that for some types of personalized recommendations there are benefits to using advanced algorithms that require a lot of high level data science and engineering competence to build since they outperform simplistic approaches. In some places, simplistic approaches work very well and in others the right decision is to not have product recommendations at all. For an effective use of product recommendations you need to have all the above options and the ability to tell when to use which one.
Next steps
When working with something so tightly related to customer experience, there is a constant change in user behaviour and new learnings to observe and adapt to. Product recommendations are rarely the main stand alone experience and frequently something that is used to help and enhance an experience. We see a lot of value in having a large toolbox of possible options and a team with a relentless focus on collaboration to improve the customer experience. We’re working directly with the Recommendations AI team and experimenting with several new features that we’re excited about.
In the future we see opportunities of improving the customer journey through a more visual experience that inspires the customer rather than relying on customers to use their imagination to visualize groups of products together. Vision Product Search provides that and is something we’re looking into deploying next. We’ll be sharing more about our journey with Recommendations AI at the Google Cloud Retail Summit session ‘IKEA’s Approach to Building a Powerful Recommendations Engine’ on July 27th 2021.
Best wishes to all developers from the IKEA product recommendations team & the Google Recommendations AI team!
4340
Of your peers have already watched this video.
20:00 Minutes
The most insightful time you'll spend today!
The New and Upcoming Infrastructure for Google Cloud’s AI and ML Solutions
How does Google manage to provide its customers a differentiated compute platform experience and define ways to fully leverage its infrastructure supporting its cutting-edge AI and ML offerings? Easy-to-use, scalable and ability to create innovative products and services to end-users at low cost of ownership is the narrative behind Google Cloud’s AI and ML solutions. Explore Google Cloud’s ML infrastructure and accelerator innovation for 2021.
Watch the video to find out how Google Cloud’s leadership in AI through Google research, Deep Mind and also practical application of AI within Google Products drive innovative platforms and offerings that cater to customers’ AI and ML use cases!
4589
Of your peers have already watched this video.
1:30 Minutes
The most insightful time you'll spend today!
Introduction to Cloud Shell Editor
Watch the video to understand how Google’s Cloud Shell Editor and its powerful features-packed environment can streamline your development workflows.
3386
Of your peers have already watched this video.
26:00 Minutes
The most insightful time you'll spend today!
Lead Your Company Towards Data-Powered Innovation
In this talk, Lak Lakshmanan, Head of Analytics and AI Solutions, Google Cloud, presents a prescriptive, proven approach to foster the ability of your organization to innovate with data.
This approach has helped other Google Cloud customers handle key challenges around data size, speed, and a (lack of) structure.
This five-step journey provides immediate short-term benefits at every stage and sets your organization up for transformational growth.
The first step is to simplify operations and lower the total cost of ownership and build a common data platform by migrating legacy data warehouses and data lakes to the cloud.
Next is to break down silos, democratize data access, and build a data culture.
The third step is to make decisions in context (taking location and near-term behavior into account) and do so faster with real-time dashboards and real-time AI.
The fourth step is to build the ability to absorb AI and leapfrog with end-to-end packaged AI solutions.
Finally, with the ability to integrate AI already in place, it is time to empower data-driven innovation with scaled AI platforms.
BigQuery Explainable AI for Demystifying the Inner Workings of ML Models. Now GA!

6577
Of your peers have already read this article.
2:00 Minutes
The most insightful time you'll spend today!
Explainable AI (XAI) helps you understand and interpret how your machine learning models make decisions. We’re excited to announce that BigQuery Explainable AI is now generally available (GA). BigQuery is the data warehouse that supports explainable AI in a most comprehensive way w.r.t both XAI methodology and model types. It does this at BigQuery scale, enabling millions of explanations within seconds with a single SQL query.
Why is Explainable AI so important? To demystify the inner workings of machine learning models, Explainable AI is quickly becoming an essential and growing need for businesses as they continue to invest in AI and ML. With 76% of enterprises now prioritizing artificial intelligence (AI) and machine learning (ML) over other initiatives in 2021 IT budgets, the majority of CEOs (82%) believe that AI-based decisions must be explainable to be trusted according to a PwC survey.
While the focus of this blogpost is on BigQuery Explainable AI, Google Cloud provides a variety of tools and frameworks to help you interpret models outside of BigQuery, such as with Vertex Explainable AI, which includes AutoML Tables, AutoML Vision, and custom-trained models.
So how does Explainable AI in BigQuery work exactly? And how might you use it in practice?
Two types of Explainable AI: global and local explainability
When it comes to Explainable AI, the first thing to note is that there are two main types of explainability as they relate to the features used to train the ML model: global explainability and local explainability.
Imagine that you have a ML model that predicts housing price (as a dollar amount), based on three features: (1) number of bedrooms, (2) distance to the nearest city center, and (3) construction date.
Global explainability (a.k.a. global feature importance) describes the features’ overall influence on the model and helps you understand if a feature had a greater influence than other features over the model’s predictions. For example, global explainability can reveal that the number of bedrooms and distance to city center typically has a much stronger influence than the construction date on predicting housing prices. Global explainability is especially useful if you have hundreds or thousands of features and you want to determine which features are the most important contributors to your model. You may also consider using global explainability as a way to identify and prune less important features to improve the generalizability of their models.
Local explainability (a.k.a. feature attributions) describes the breakdown of how each feature contributes towards a specific prediction. For example, if the model predicts that house ID#1001 has a predicted price of $230,000, local explainability would describe a baseline amount (e.g. $50,000) and how each of the features contributes on top of the baseline towards the predicted price. For example, the model may say that on top of the baseline of $50,000, having 3 bedrooms contributed an additional $50,000, close proximity to the city center added $100,000, and construction date of 2010 added $30,000, for a total predicted price of $230,000. In essence, understanding the exact contribution of each feature used by the model to make each prediction is the main purpose of local explainability.
What ML models does BigQuery Explainable AI apply to?
BigQuery Explainable AI applies to a variety of models, including supervised learning models for IID data and time series models. The documentation for BigQuery Explainable AI provides an overview of the different ways of applying explainability per model. Note that each explainability method has its own way of calculation (e.g. Shapley values), which are covered more in-depth in the documentation.

Examples with BigQuery Explainable AI
In this next section, we will show three examples of how to use BigQuery Explainable AI in different ML applications:
Regression models with BigQuery Explainable AI
Let’s use a boosted tree regression model to predict how much a taxi cab driver will receive in tips for a taxi ride, based on features such as number of passengers, payment type, total payment and trip distance. Then let’s use BigQuery Explainable AI to help us understand how the model made the predictions in terms of global explainability (which features were most important?) and local explainability (how did the model arrive at each prediction?).
The taxi trips dataset comes from the BigQuery public datasets and is publicly available in the table: bigquery-public-data.new_york_taxi_trips.tlc_yellow_trips_2018.
First, you can train a boosted tree regression model.
CREATE OR REPLACE MODEL bqml_tutorial.taxi_tip_regression_modelOPTIONS (model_type='boosted_tree_regressor',input_label_cols=['tip_amount'],max_iterations = 50,tree_method = 'HIST',subsample = 0.85,enable_global_explain = TRUE) ASSELECTvendor_id,passenger_count,trip_distance,rate_code,payment_type,total_amount,tip_amountFROM`bigquery-public-data.new_york_taxi_trips.tlc_yellow_trips_2018`WHERE tip_amount >= 0LIMIT 1000000
Now let’s do a prediction using ML.PREDICT, which is the standard way in BigQuery ML to make predictions without explainability.
SELECT *FROMML.PREDICT(MODEL bqml_tutorial.taxi_tip_regression_model,(SELECT"0" AS vendor_id,1 AS passenger_count,CAST(5.85 AS NUMERIC) AS trip_distance,"0" AS rate_code,"0" AS payment_type,CAST(55.56 AS NUMERIC) AS total_amount))

But you might wonder—how did the model generate this prediction of ~11.077?
BigQuery Explainable AI can help us answer this question. Instead of using ML.PREDICT, you use ML.EXPLAIN_PREDICT with an additional optional parameter top_k_features. ML.EXPLAIN_PREDICT extends the capabilities of ML.PREDICT by outputting several additional columns that explain how each feature contributes to the predicted value. In fact, since ML.EXPLAIN_PREDICT includes all the output from ML.PREDICT anyway, you may want to consider using ML.EXPLAIN_PREDICT every time instead.
SELECT *FROMML.EXPLAIN_PREDICT(MODEL bqml_tutorial.taxi_tip_regression_model,(SELECT"0" AS vendor_id,1 AS passenger_count,CAST(5.85 AS NUMERIC) AS trip_distance,"0" AS rate_code,"0" AS payment_type,CAST(55.56 AS NUMERIC) AS total_amount),STRUCT(6 AS top_k_features))

The way to interpret these columns is:
Σfeature_attributions + baseline_prediction_value = prediction_value
Let’s break this down. The prediction_value is ~11.077, which is simply the predicted_tip_amount. The baseline_prediction_value is ~6.184, which is the tip amount for an average instance. top_feature_attributions indicates how much each of the features contributes towards the prediction value. For example, total_amount contributes ~2.540 to the predicted_tip_amount.
ML.EXPLAIN_PREDICT provides local feature explainability for regression models. For global feature importance, see the documentation for ML.GLOBAL_EXPLAIN.
Classification models with BigQuery Explainable AI
Let’s use a logistic regression model to show you an example of BigQuery Explainable AI with classification models. We can use the same public dataset as before: bigquery-public-data.new_york_taxi_trips.tlc_yellow_trips_2018.
Train a logistic regression model to predict the bracket of the percentage of the tip amount out of the taxi bill.
CREATE OR REPLACE MODEL bqml_tutorial.taxi_tip_classification_modelOPTIONS(model_type='logistic_reg',input_label_cols=['tip_bucket'],enable_global_explain=true) ASSELECTvendor_id,passenger_count,trip_distance,rate_code,payment_type,total_amount,CASEWHEN tip_amount > total_amount*0.20 THEN '20% or more'WHEN tip_amount > total_amount*0.15 THEN '15% to 20%'WHEN tip_amount > total_amount*0.10 THEN '10% to 15%'ELSE '10% or less'END AS tip_bucketFROM`bigquery-public-data.new_york_taxi_trips.tlc_yellow_trips_2018`WHERE tip_amount >= 0LIMIT 1000000
Next, you can run ML.EXPLAIN_PREDICT to get both the classification results and the additional information for local feature explainability. For global explainability, you can use ML.GLOBAL_EXPLAIN. Again, since ML.EXPLAIN_PREDICT includes all the output from ML.PREDICT anyway, you may want to consider using ML.EXPLAIN_PREDICT every time instead.
SELECT *FROMML.EXPLAIN_PREDICT(MODEL bqml_tutorial.taxi_tip_classification_model,(SELECT"0" AS vendor_id,1 AS passenger_count,CAST(5.85 AS NUMERIC) AS trip_distance,"0" AS rate_code,"0" AS payment_type,CAST(55.56 AS NUMERIC) AS total_amount),STRUCT(6 AS top_k_features))

Similar to the regression example earlier, the formula is used to derive the prediction_value:
Σfeature_attributions + baseline_prediction_value = prediction_value
As you can see in the screenshot above, the baseline_prediction_value is ~0.296. total_amount is the most important feature in making this specific prediction, contributing ~0.067 to the prediction_value, though followed by trip_distance. The feature passenger_count contributes negatively to prediction_value by -0.0015. The features vendor_id, rate_code, and payment_type did not seem to contribute much to the prediction_value.
You may wonder why the prediction_value of ~0.389 doesn’t equal the probability value of ~0.359. The reason is that unlike for regression models, for classification models, prediction_value is not a probability score. Instead, prediction_value is the logit value (i.e., log-odds) for the predicted class, which you could separately convert to probabilities by applying the softmax transformation to the logit values. For example, a three-class classification has a log-odds output of [2.446, -2.021, -2.190]. After applying the softmax transformation, the probability of these class predictions is [0.9905, 0.0056, 0.0038].
Time-series forecasting models with BigQuery Explainable AI

Explainable AI for forecasting provides more interpretability into how the forecasting model came to its predictions. Let’s go through an example of forecasting the number of bike trips in NYC using the new_york.citibike_trips public data in BigQuery.
You can train a time-series model ARIMA_PLUS:
CREATE OR REPLACE MODEL bqml_tutorial.nyc_citibike_arima_modelOPTIONS(model_type = 'ARIMA_PLUS',time_series_timestamp_col = 'date',time_series_data_col = 'num_trips',holiday_region = 'US') ASSELECTEXTRACT(DATE from starttime) AS date,COUNT(*) AS num_tripsFROM`bigquery-public-data.new_york.citibike_trips`GROUP BY dateNext, you can first try forecasting without explainability using ML.FORECAST:SELECT*FROMML.FORECAST(MODEL bqml_tutorial.nyc_citibike_arima_model,STRUCT(365 AS horizon, 0.9 AS confidence_level))
This function outputs the forecasted values and the prediction interval. Plotting it in addition to the input time series gives the following figure.

But how does the forecasting model arrive at its predictions? Explainability is especially important if the model ever generates unexpected results.
With ML.EXPLAIN_FORECAST, BigQuery Explainable AI provides extra transparency into the seasonality, trend, holiday effects, level (step) changes, and spikes and dips outlier removal. In fact, since ML.EXPLAIN_FORECAST includes all the output from ML.FORECAST anyway, you may want to consider using ML.EXPLAIN_FORECAST every time instead.
SELECT*FROMML.EXPLAIN_FORECAST(MODEL bqml_tutorial.nyc_citibike_arima_model,STRUCT(365 AS horizon, 0.9 AS confidence_level))

Compared to the previous figure which only shows the forecasting results, this figure shows much richer information to explain how the forecast is made.
First, it shows how the input time series is adjusted by removing the spikes and dips anomalies, and by compensating the level changes. That is:
time_series_adjusted_data = time_series_data - spikes_and_dips - step_changes
Second, it shows how the adjusted input time series is decomposed into different components such as both weekly and yearly seasonal components, holiday effect component and trend component. That is
time_series_adjusted_data = trend + seasonal_period_yearly + seasonal_period_weekly + holiday_effect + residual
Finally, it shows how these components are forecasted separately to compose the final forecasting results. That is:
time_series_data = trend + seasonal_period_yearly + seasonal_period_weekly + holiday_effect
For more information on these time series components, please see the documentation here.
Conclusion
With the GA of BigQuery Explainable AI, we hope you will now be able to interpret your machine learning models with ease.
Thanks to the BigQuery ML team, especially Lisa Yin, Jiashang Liu, Amir Hormati, Mingge Deng, Jerry Ye and Abhinav Khushraj. Also thanks to the Vertex Explainable AI team, especially David Pitman and Besim Avci.
More Relevant Stories for Your Company

Data to Business Outcomes with Google’s Data Analytics Design Pattern
Companies today are inundated with vast amounts of data from various sources. This overwhelming amount of data is meant to benefit the company, but often leaves data teams feeling overwhelmed, which can create data bottlenecks and result in a slow time to value. In fact, only twenty seven percent of

How Google Cloud’s Scalable Data Storage and High Compute Resources Fuel Investment Research
Investment management is a heavily data-driven industry—portfolio managers and investment researchers require a large number of data sources to guide them in shaping their investment strategies. New cloud capabilities and technologies enable investment managers to process data faster than ever before and iterate on ideas quickly to fuel innovation in

redBus: Mastering Big Data with Google BigQuery
In 2006, online travel agency redBus introduced internet bus ticketing in India, unifying tens of thousands of bus schedules into a single booking operation. (Think of it as Expedia for bus booking.) Using BigQuery, redBus crunches terabytes of booking and inventory data in mere seconds and at a fraction of


Setting up Data Pipelines Easily for Streaming and Non-Streaming Data
We live in a world of incessant data. Our phones, factory equipment, smart watches, health devices, and other IoT devices are constantly streaming data. Some of the most popular uses of machine learning and AI are also based on streaming data. Think real-time credit card fraud detection, or software that
