





10501
Of your peers have already watched this video.
2:15 Minutes
The most insightful time you'll spend today!
The True Story of How HotStar Broke a World-Record–Thanks to Firebase and Google BigQuery
Hotstar, India’s largest video streaming platform with 150 million monthly active users around the world, provides live-streaming of TV shows, movies, sports, and news on the go.
By using a combination of Firebase products together, Hotstar safely rolled out new features to its watch screen during a major live-streaming event without disrupting users, sacrificing stability, or releasing a new build. They also used Firebase with BigQuery to analyze their event data and reduce app startup time.
“We have an ambitious mission, but our engineering team is only a fraction of the size of most of our competitors. But we are still keeping up, and we are doing it with the help of Firebase,” says Ayushi Gupta, Android Engineer, Hotstar.
4527
Of your peers have already watched this video.
1:30 Minutes
The most insightful time you'll spend today!
AI-powered Cameras Help You Serve Your Pets Better. Learn How
Watch the video to learn how you can leverage Google Cloud platform and AI functions to build pet-detection cameras that can capture and send image-based alert messages on your phone to notify when your pets arrive or leave.
Recommendations for Modelling SAP Data inside BigQuery

8402
Of your peers have already read this article.
4:00 Minutes
The most insightful time you'll spend today!
Over the past few years, many organizations have experienced the benefits of migrating their SAP solutions to Google Cloud. But this migration can do more than reduce IT maintenance costs and make data more secure. By leveraging BigQuery, SAP customers can complement their SAP investments and gain fresh insights by consolidating enterprise data and easily extending it with powerful datasets and machine learning from Google.
BigQuery is a leading cloud data warehouse, fully managed and serverless, and allows for massive scale, supporting petabyte-scale queries at super-fast speeds. It can easily combine SAP data with additional data sources, such as Google Analytics or Salesforce, and its built-in machine learning lets users operationalize machine learning models using standard SQL — all at a comparatively low cost.
If your SAP-powered organization is looking to supercharge its analytics with the strength of BigQuery, read on for considerations and recommendations for modeling with SAP data. These guidelines are based on our real-world implementation experience with customers and can serve as a roadmap to the analytics capabilities your business needs.
Considerations for data replication
Like most technology journeys, this one should start with a business objective. Keeping your intended business value and goals in mind is critical to making the right decisions in the early steps of the design process.
When it comes to replicating the data from an SAP system into BigQuery, there are multiple ways to do it successfully. Decide which method will work best for your organization by answering these questions:
- Does your business need real-time data? Will you need to time travel into past data?
- Which external datasets will you need to join with the replicated data?
- Are the source structures or business logic likely to change? Will you be migrating the SAP source systems any time soon? For instance, will you be moving from SAP ECC to SAP S/4HANA?
You’ll also need to determine whether replication should be done on a table-by-table basis or whether your team can source from pre-built logic. This decision, along with other considerations such as licensing, will influence which replication tool you should use.
Replicating on a table-by-table basis
Replicating tables, especially standard tables in their raw form, allows sources to be reused and ensures more stability of the source structure and functional output. For example, the SAP table for sales order headers (VBAK) is very unlikely to change its structure across different versions of SAP, and the logic that writes to it is also unlikely to change in a way that affects a replicated table.
Something else to consider: Reconciliation between the source system and the landing table in BigQuery is linear when comparing raw tables, which helps avoid issues in consolidation exercises during critical business processes, such as period-end closing. Since replicated tables aren’t aggregated or subject to process-specific data transformation, the same replicated columns can be reused in different BigQuery views. You can, for instance, replicate the MARA table (the material master) once and use it in as many models as needed.
Replicating pre-built logic
If you replicate pre-built models, such as those from SAP extractors or CDS views, you don’t need to build the logic in BigQuery, since you’re using existing logic. Some of these extraction objects have embedded delta mechanisms, which may complement a replication tool that can’t handle deltas. This will save initial development time, but it can also lead to challenges if you create new columns, or if customizations or upgrades change the logic behind the extraction.
It’s also important to note that different extraction processes may transform and load the same source columns multiple times, which creates redundancy in BigQuery and can lead to higher maintenance needs and costs. However, replicating pre-built models may still be a good choice, since doing so can be especially useful for logic that tends to be immutable, such as flattening a hierarchy, or logic that is highly complex.
How you approach replication will also depend on your long-term plans and other key factors — for example, the availability (and curiosity) of your developers, and the time or effort they can put into applying their SQL knowledge to a new data warehouse.
With either replication approach, bear in mind when designing your replication process that BigQuery is meant to be an append-always database — so post-processing of data and changes will be required in both cases.
Processing data changes
The replication tool you choose will also determine how data changes are captured (known as CDC – change data capture). If the replication tool allows for it (for example as SAP SLT does) the same patterns described in the CDC with BigQuery documentation also apply to SAP data.
Because some data, like transactions, are known to be less static than others (e.g., master data), you need to decide what should be scanned in real time, what will require immediate consistency, and what can be processed in batches to manage costs. This decision will be based on the reporting needs from the business.
Consider the SAP table BUT000, containing our example master data for business partners, where we have replicated changes from an SAP ERP system:
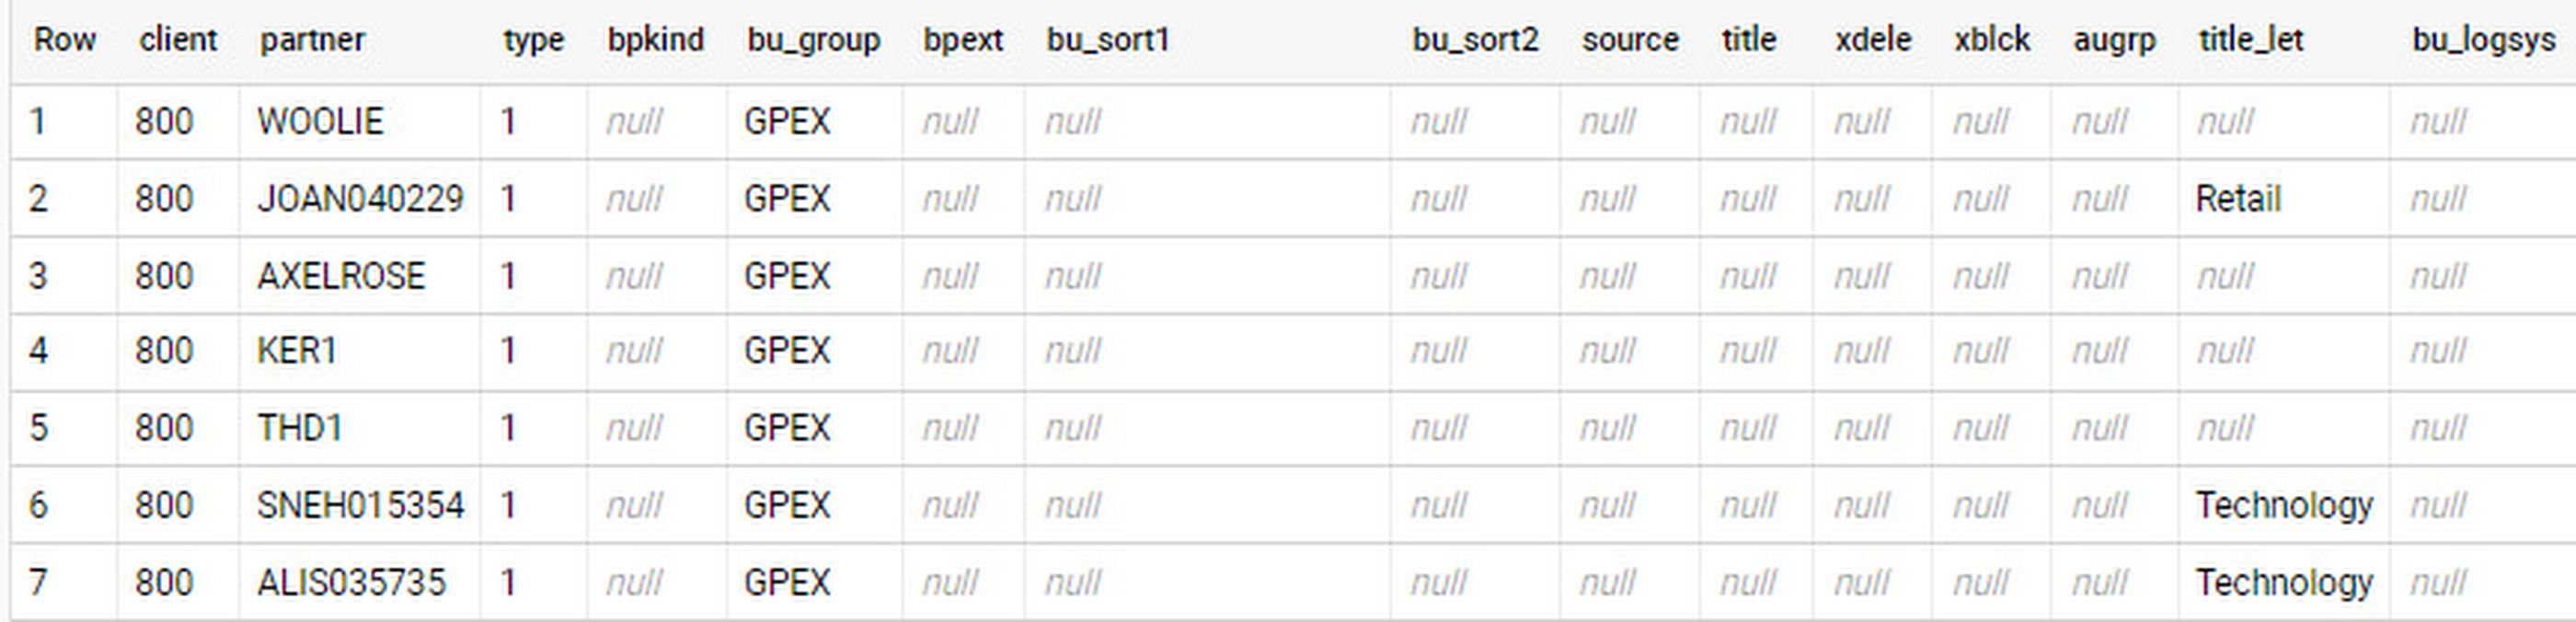
In an append-always replication in BigQuery, all updates are received as new records. For example, deleting a record in the source will be represented as a new record in BigQuery with a deletion flag. This applies to whether the records are coming from raw tables like BUT000 itself or pre-aggregated data, as from a BW extractor or a CDS view.
Let’s take a closer look at data coming particularly from the partners “LUCIA” and “RIZ”. The operation flag tells us whether the new record in BigQuery is an insert (I), update (U) or deletion (D), while the timestamps help us identify the latest version of our business partner.
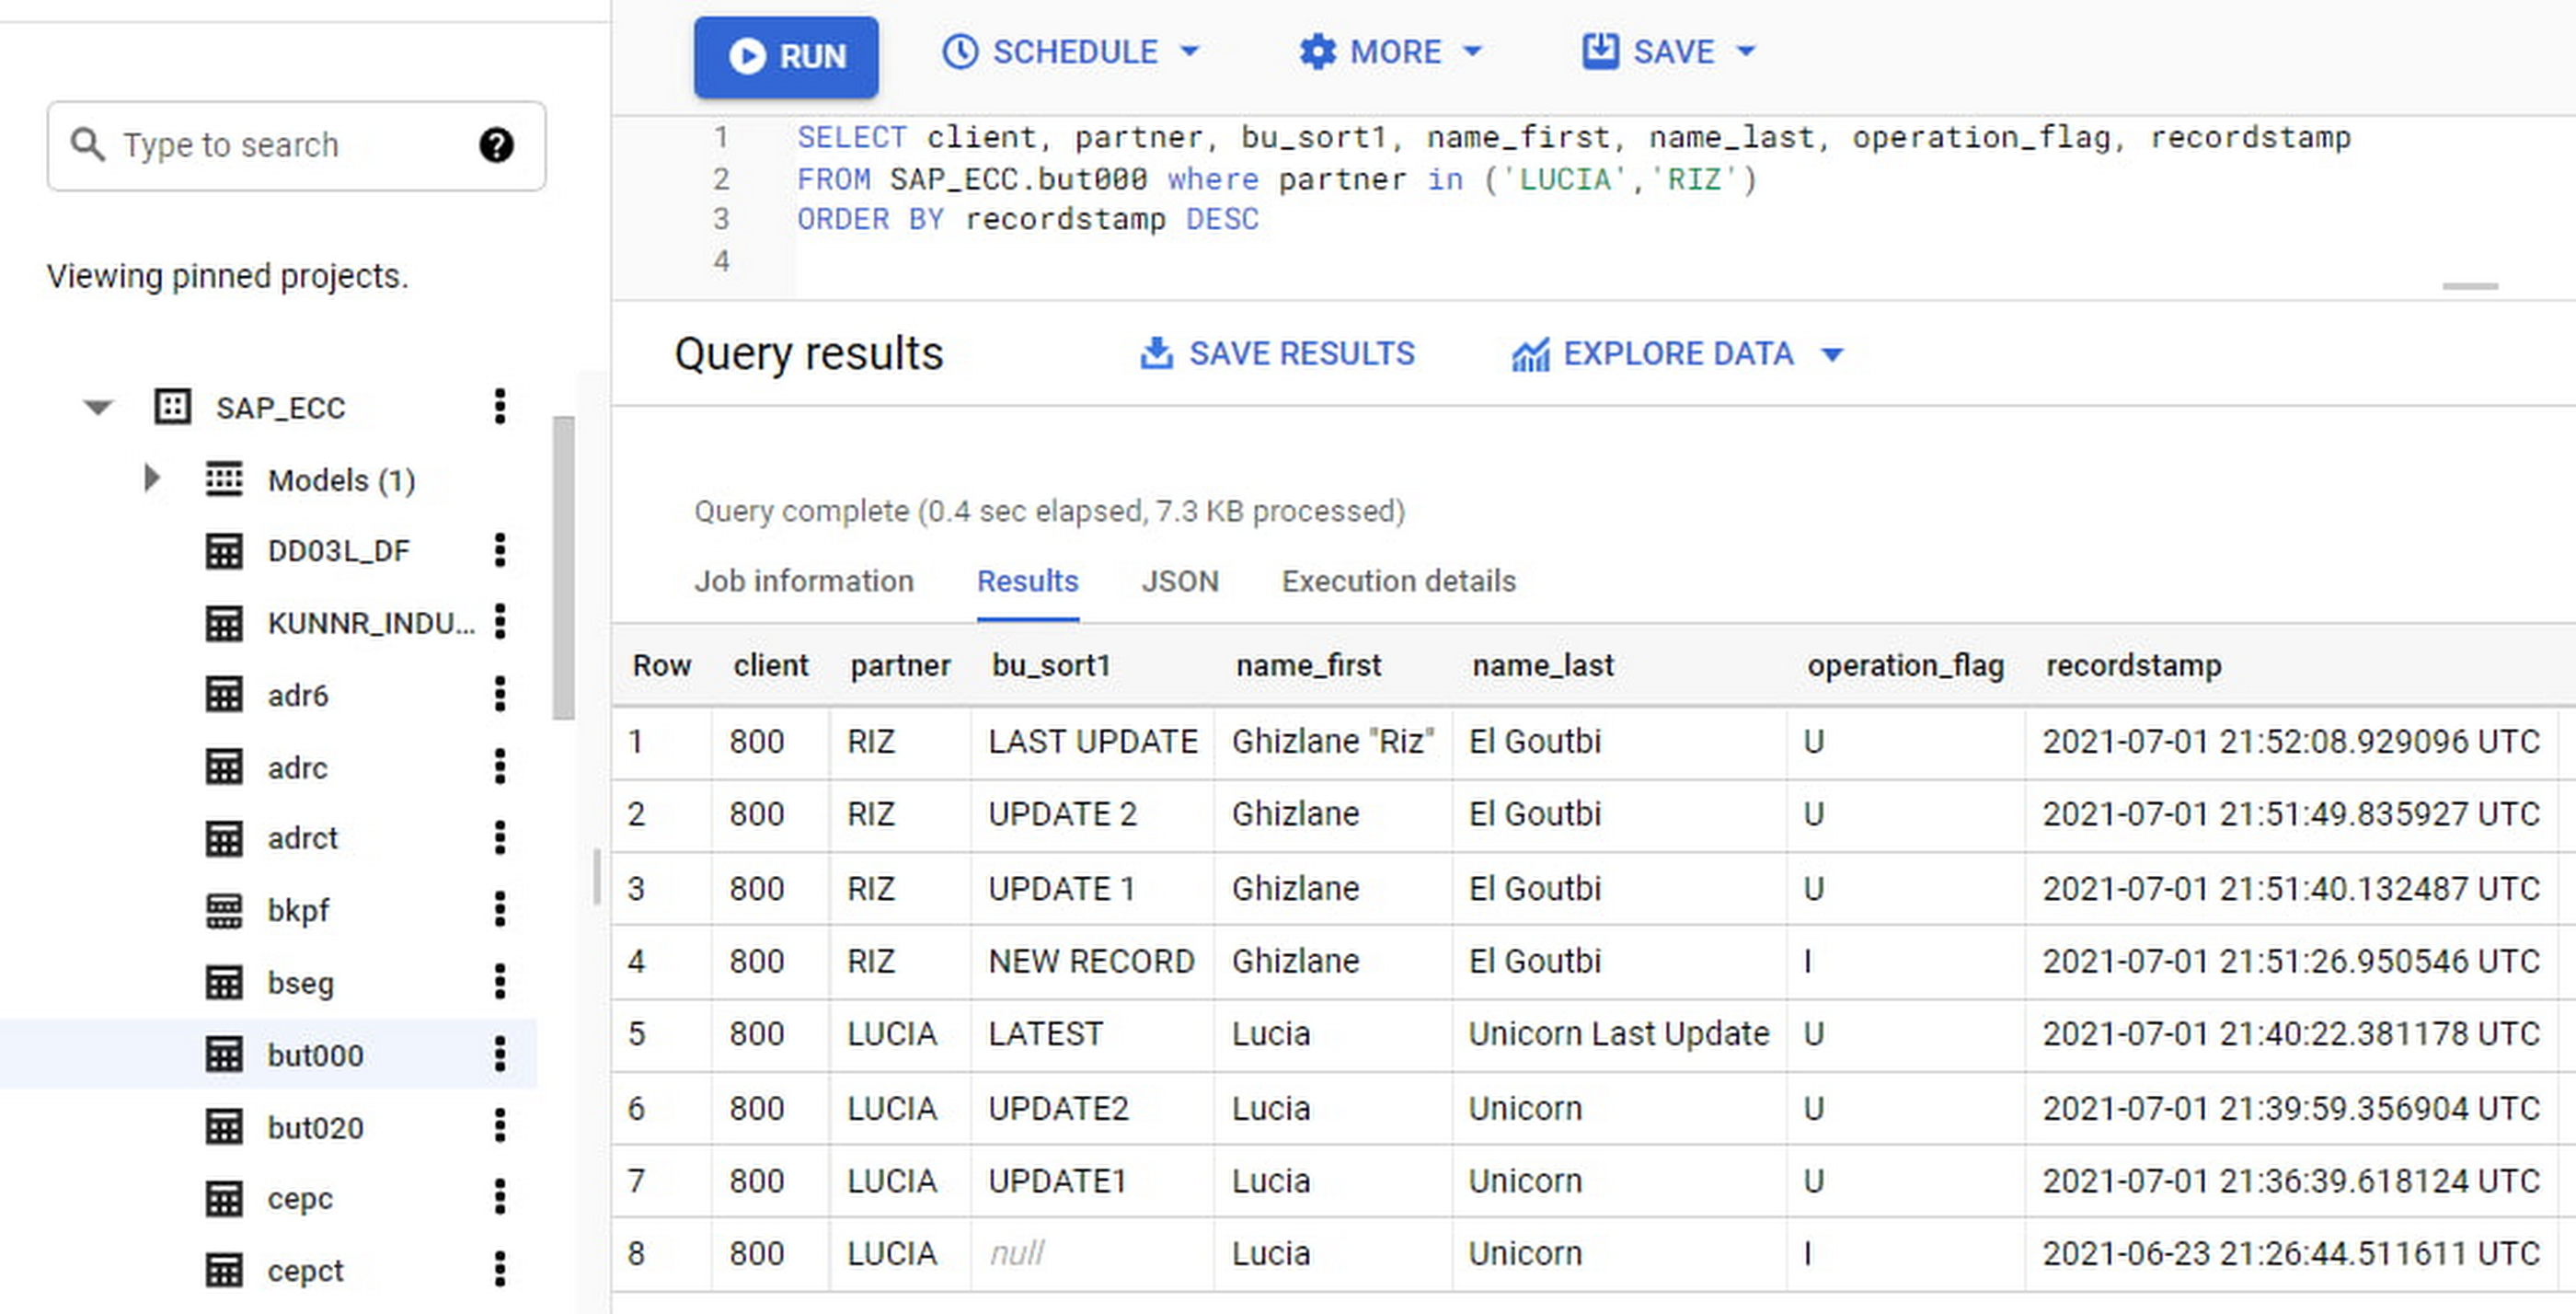
If we want to find the latest updated record for the partners LUCIA and RIZ, this is what the query would look like:
SELECT partner,ARRAY_AGG(i1 ORDER BY i1.recordstamp DESC LIMIT 1) AS rowFROM SAP_ECC.but000 i1WHERE partner in ('LUCIA','RIZ')GROUP BY partner
With the following result:
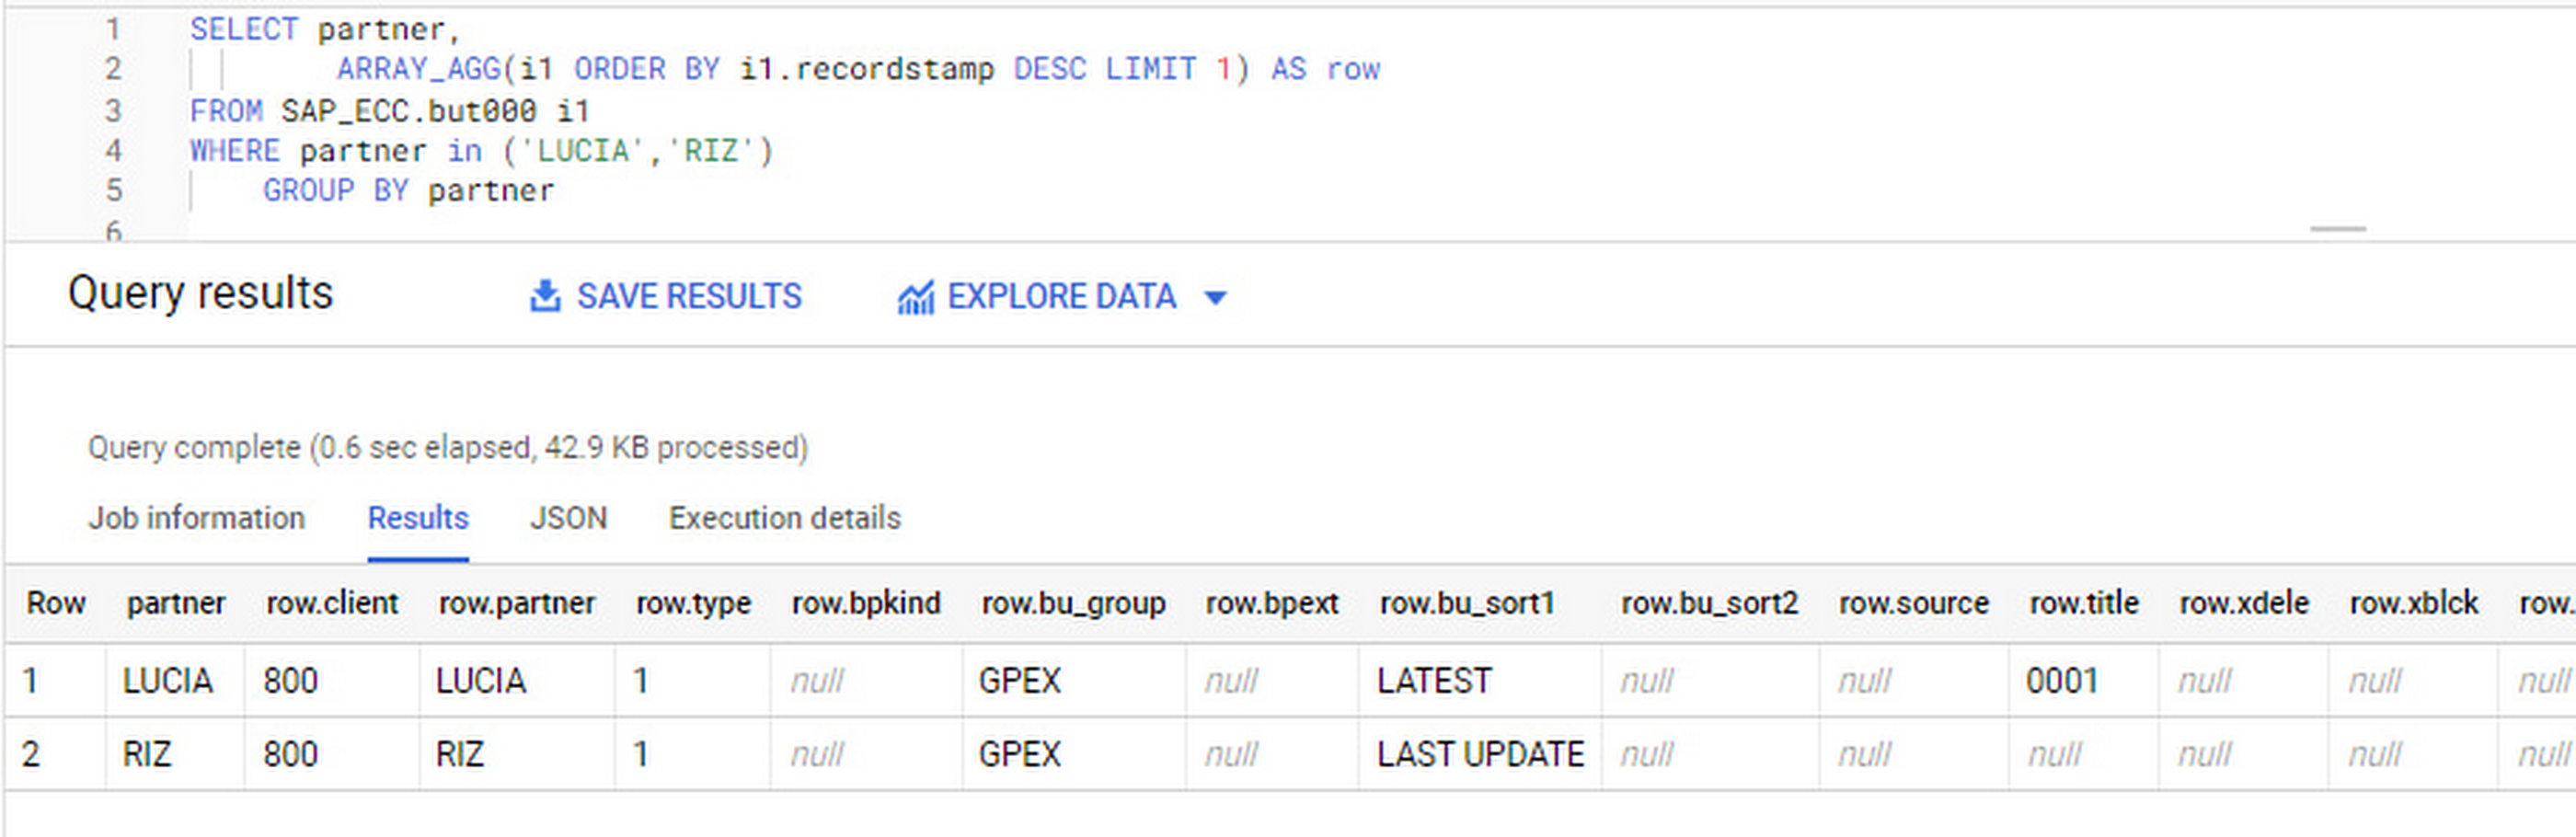
After identifying stale records for “LUCIA” and “RIZ” business partners, we can proceed to deleting all stale records for “LUCIA” if we do not want to retain the history. In this example, we are using a different table to which the same replication has been done, for the purpose of comparison and to check that all stale records have been deleted for the selection made and that we only kept last updated records. For example:
DELETE SAP_HANA.but000 i1WHEREi1.recordstamp < TIMESTAMP_SUB(CURRENT_TIMESTAMP(), INTERVAL 3 HOUR) ANDi1.recordstamp < (SELECT MAX(recordstamp) FROM SAP_HANA.but000 i2WHEREi1.partner = i2.partnerand partner="LUCIA")
You can also use the following query to retrieve stale records for “LUCIA” partner before moving forward with deletion
SELECT partner, operation_flag, recordstamp FROM SAP_HANA.but000 i1WHEREi1.recordstamp < TIMESTAMP_SUB(CURRENT_TIMESTAMP(), INTERVAL 3 HOUR)ANDi1.recordstamp < (SELECT MAX(recordstamp) FROM SAP_HANA.but000 i2WHEREi1.partner = i2.partnerand partner="LUCIA")
Which produces all of the records, except the latest update:

Partitioning and clustering
To limit the number of records scanned in a query, save on cost and achieve the best performance possible, you’ll need to take two important steps: determine partitions and create clusters.
Partitioning
A partitioned table is one that’s divided into segments, called partitions, which make it easier to manage and query your data. Dividing a large table into smaller partitions improves query performance and controls costs because it reduces the number of bytes read by a query.
You can partition BigQuery tables by:
- Time-unit column: Tables are partitioned based on a “timestamp,” “date,” or “datetime” column in the table.
- Ingestion time: Tables are partitioned based on the timestamp recorded when BigQuery ingested the data.
- Integer range: Tables are partitioned based on an integer column.
Partitions are enabled when the table is created, as in the example below. A great tip is to always include the partition filter as shown on the left-hand side of the query.

Clustering
Clustering can be created on top of partitioned tables by applying the fields that are likely to be used for filtering. When you create a clustered table in BigQuery, the table data is automatically organized based on the contents of one or more of the columns in the table’s schema. The columns you specify are then used to colocate related data.
Clustering can improve the performance of certain query types — for example, queries that use filter clauses or that aggregate data. It makes a lot of sense to use them for large tables such as ACDOCA, the table for accounting documents in SAP S/4HANA. In this case, the timestamp could be used for partitioning, and common filtering fields such as the ledger, company code, and fiscal year could be used to define the clusters.
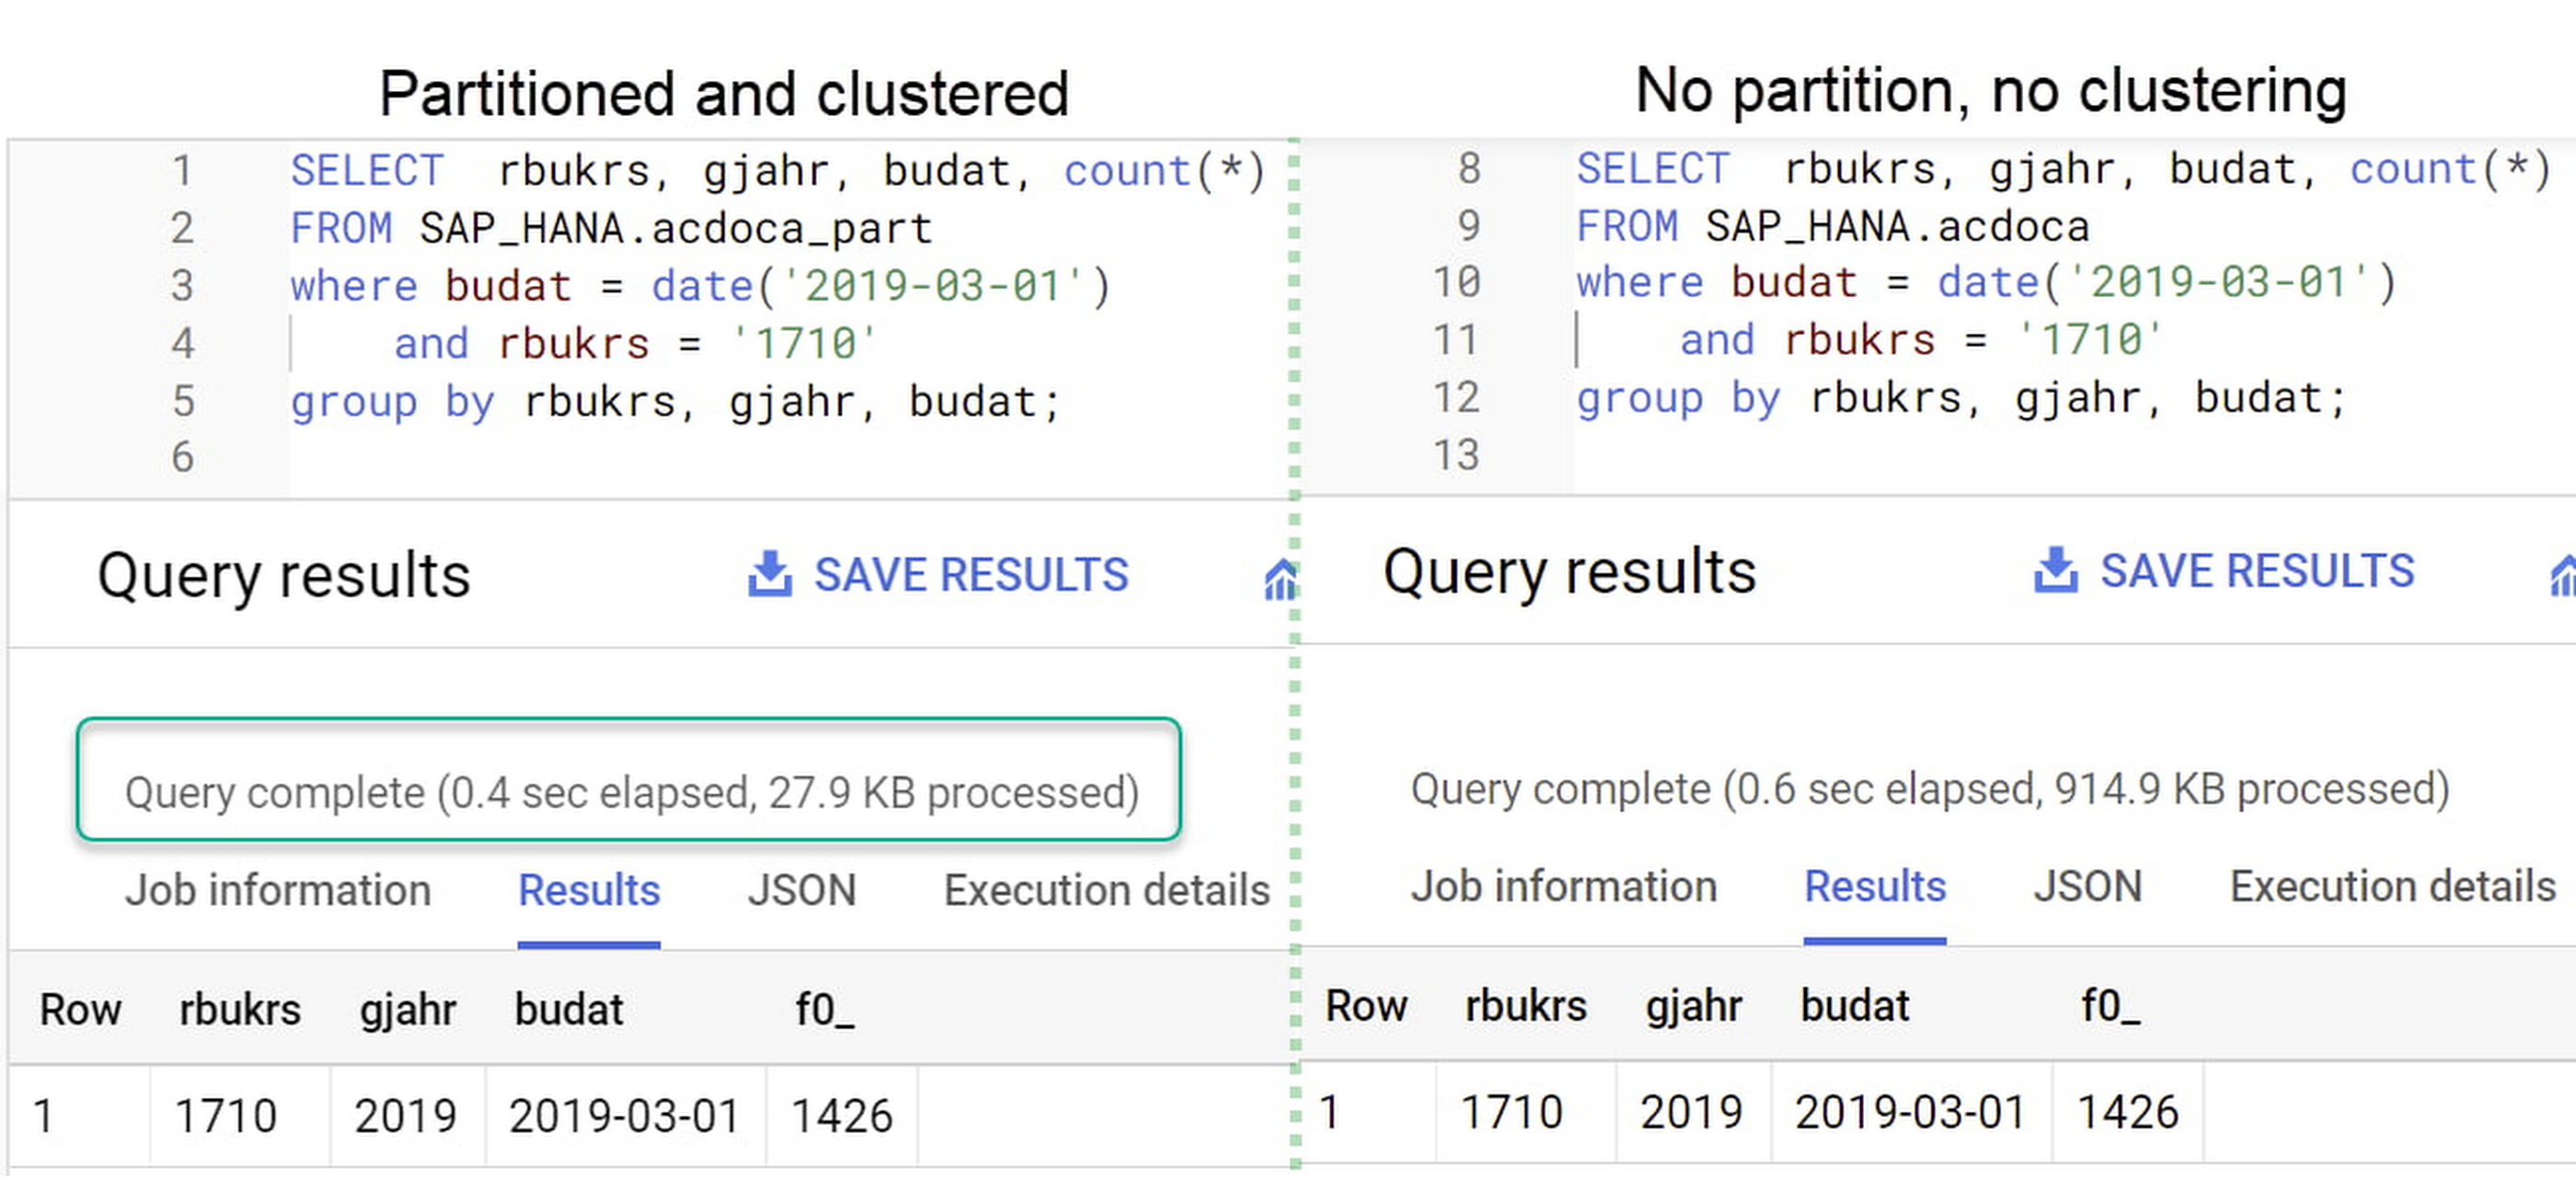
A great feature is that BigQuery will also periodically recluster the data automatically.
Materialized views
In BigQuery, materialized views are precomputed views that periodically cache the results of a query for better performance and efficiency. BigQuery uses precomputed results from materialized views and, whenever possible, reads only the delta changes from the base table to compute up-to-date results quickly. Materialized views can be queried directly or can be used by the BigQuery optimizer to process queries to the base table.
Queries that use materialized views are generally completed faster and consume fewer resources than queries that retrieve the same data only from the base table. If workload performance is an issue, materialized views can significantly improve the performance of workloads that have common and repeated queries. While materialized views currently only support single tables, they are very useful common and frequent aggregations like stock levels or order fulfillment.
Further tips on performance optimization while creating select statements can be found in the documentation for optimizing query computation.
Deployment pipeline and security
For most of the work you’ll do in BigQuery, you’ll normally have at least two delivery pipelines running — one for the actual objects in BigQuery and the other to keep the data staging, transforming, and updated as intended within the change-data-capture flows. Note that you can use most existing tools for your Continuous Integration / Continuous Deployment (CI/CD) pipeline — one of the benefits of using an open system like BigQuery. But, if your organization is new to CI/CD pipelines, this is a great opportunity to gradually gain experience. A good place to start is to read our guide for setting up a CI/CD pipeline for your data-processing workflow.
When it comes to access and security, most end-users will only have access to the final version of the BigQuery views. While row and column-level security can be applied, as in the SAP source system, separation of concerns can be taken to the next level by splitting your data across different Google Cloud projects and BigQuery datasets. While it’s easy to replicate data and structures across your datasets, it’s a good idea to define the requirements and naming conventions early in the design process so you set it up properly from the start.
Start driving faster and more insightful analytics
The best piece of advice we can give you is this: Try it yourself. Anyone with SQL knowledge can get started using the free BigQuery tier. New customers get $300 in free credits to spend on Google Cloud during the first 90 days. All customers get 10 GB storage and up to 1 TB queries/month, completely free of charge. In addition to discovering the massive processing capabilities, embedded machine learning, multiple integration tools, and cost benefits, you’ll soon discover how BigQuery can simplify your analytics tasks.
If you need additional assistance, our Google Cloud Professional Services Organization (PSO) and Customer Engineers will be happy to help show you the best path forward for your organization. For anything else, contact us at cloud.google.com/contact.
How Google Cloud’s Scalable Data Storage and High Compute Resources Fuel Investment Research
6280
Of your peers have already read this article.
1:30 Minutes
The most insightful time you'll spend today!
Investment management is a heavily data-driven industry—portfolio managers and investment researchers require a large number of data sources to guide them in shaping their investment strategies.
New cloud capabilities and technologies enable investment managers to process data faster than ever before and iterate on ideas quickly to fuel innovation in the signal generation process and gain a competitive edge.
Using the cloud for investment research workflows makes it easier to onboard data from data providers, spin up large compute workloads in the midst of market volatility or during heavy research cycles, and manage complex machine learning or natural language workflows to gain market insights.
We hear from industry leaders that they’re exploring new ways to run investment research. “Differentiated investment strategies require new types of information sources, and new ways to process that information,” David Easthope, senior analyst, Market Structure and Technology, Greenwich Associates. “And that, of course, relies heavily on having access to reliable and scalable storage, computational, and AI / ML resources. More specifically, quantitative strategies can benefit from the computational platforms and embedded AI/ML capabilities the cloud can offer.”
Google Cloud gives investment managers essential components to work and operate faster as they bring their investment research workflows to the cloud. Here are the key highlights:
1. Simplify, speed up your data acquisition, discovery, and analytics
The foundation of any investment strategy starts with data—acquiring it, detecting patterns, and analyzing it for insights. Enabling data providers to easily share large datasets such as tick history within a high-performance analytics engine can greatly reduce the data engineering overhead when possible.
Once data is onboarded, you can tag business and technical metadata related to your datasets and provide portfolio managers the ability to discover these datasets via a search interface.
We further review analytics options for various scenarios, including aggregating massive datasets, creating dashboards, and incorporating streaming analytics workloads.
2. Take advantage of burst compute workloads
Data engineers and researchers require ready access to burst compute capabilities to perform backtesting, portfolio simulations and run risk calculations. Cloud works well for these workloads due to its elasticity, consumption-based models, and hardware evolution.
Many investment managers are shifting to a container-based strategy along with a Kubernetes-based scheduler for greater consistency, scaling and efficiency in environments with a large number of researchers. Cloud managed services and a rich suite of CI/CD tools can make this vision a reality while improving security and developer productivity.
3. Tackle machine learning (ML) and model deployment with the help from cloud
Quantitative researchers scour vast amounts of market and alternative data sources searching for signals and correlations, while ML engineers have the challenge of taking these signals and moving them to production.
Google Cloud empowers users to create and operationalize their models without wasting valuable time with a comprehensive set of MLOps tools.
In this paper, we explore multiple solutions for ML and model deployment. Those capabilities reduce the amount of time operationalizing ML models, so quants and data scientists have more time to devote to differentiating activities.
4. Get the data you need in less time with Natural Language and Document AI
Thousands of financial filings, news articles, and sell-side research reports are generated every day, and it’s difficult for humans alone to process this volume of information. These documents are often generated in many languages and the ability to do entity recognition, sentiment or syntactical analysis in those languages, or perhaps translate them into the language of the portfolio manager is of critical importance. Google Cloud provides these capabilities through pre-trained models, or allows you to train high-quality models with your own datasets.
Getting started
There are plenty of emerging technologies, tools, and approaches available to help investment managers today. At Google Cloud, we can help you access, organize, and utilize these essential components to make your research faster, reliable, and more valuable.
To learn more about these four keys to better investment research, check out our whitepaper for more.
6535
Of your peers have already watched this video.
17:00 Minutes
The most insightful time you'll spend today!
Eli Lilly’s Custom-built Translation Service Leverages Google’s Translation Engine
Eli Lilly leverages Google Cloud’s machine translation to globalize content to serve their multilingual employees. Watch the video to learn how the healthcare company built an in-house solution powered by Google Cloud APIs to address the challenge of translating multilingual content at scale. Also explore Google’s innovations and investments into services for language translations produced for machine learning (also called as machine translation or neural machine translation) for safe and secure documents and text translation via an easy-to-use interface and API.
How Google Cloud Solutions Help Retail Firms to ABP(Always Be Pivoting)

6397
Of your peers have already read this article.
2:00 Minutes
The most insightful time you'll spend today!
For years, retailers have been told that they must embrace a litany of new technologies, trends, and imperatives like online shopping, mobile apps, omnichannel, and digital transformation. In search of growth and stability, retailers adopted many of these, only to realize that for every box they ticked, there was another one waiting.
And then the pandemic hit, along with rising social movements and increasingly harsh weather. Some retailers were more prepared to take on these disruptions than others, which crystallized a new universal truth across the industry: the ability to adapt on the fly became the most important trait to survive and thrive.
Today’s retail landscape has surfaced both existing and new challenges for specialty and department store retailers. Approximately 88% of purchases previously occurred within a store environment. Now, it’s closer to 59%, with the remainder done online or through other omni methods.
With such constant change and upheaval, it can feel like the mantra now is ABP: always be pivoting.
The big question isn’t just how to maintain constant momentum and agility—it’s how to do it without sapping your workforce, your inventory, or your profits in the process. The pivot is now a given. What matters is how you do it.
Adapting requires a flexible base of technology that allows retailers to shift and scale seamlessly with the needs of the moment.
They need to be able to leverage real-time insights and enhance customer experiences rapidly, online and in the real world (not to mention the growing hybridization that’s AR and VR). They need to modernize their stores to power engaging consumer and associate experiences. They need to enhance operations for rapid scaling between full operations and digital-only offerings.
To help retailers achieve these goals and more, Google Cloud is honing a trio of essential innovations: demand forecasting that harnesses the power of data analytics and artificial intelligence; enhanced product discovery to improve conversion across channels; and the tools to help create the modern store experience.
In other words, here’s some of the biggest ways we’re ready to help you pivot.
Pivot point 1: Harnessing data and AI for demand forecasting with Vertex AI
One of the greatest challenges for retailers when building organizational flexibility is managing inventory and the supply chain.
We are in the midst of one of the worst global supply chain crises, stemming from soaring demand and logistics issues brought on by the pandemic. This crisis has only heightened the challenge retailers face when assessing demand and product availability. Even in normal times, mismanagement of inventory can add up to a trillion-dollar problem, according to IHL Group (costing $634 billion in lost sales worldwide each year, while overstocks result in $472 billion in lost revenues due to markdowns).
On the flipside, optimizing your supply chain can lead to greater profits. For instance, McKinsey predicts that a 10% to 20% improvement in retail supply chain forecasting accuracy is likely to produce a 5% reduction in inventory costs and a 2% to 3% increase in revenues.
Some of the challenges related to demand forecasting include:
- Low accuracy leads to excess inventory, missed sales, and pressure on fragile supply chains.
- Real drivers of product demand are not included, because large datasets are hard to model using traditional methods.
- Poor accuracy for new product launches and products that have sparse or intermittent demand.
- Complex models are hard to understand, leading to poor product allocation and low return on investment on promotions.
- Different departments use different methods, leading to miscommunication and costly reconciliation errors.
AI-based demand forecasting techniques can help. Vertex AI Forecast supports retailers in maintaining greater inventory flexibility by infusing machine learning into their existing systems. Machine learning and AI-based forecasting models like Vertex AI are able to digest large sets of disparate data, drive analytics and automatically adjust when provided with new information.
With these machine learning models, retailers can not only incorporate historical sales data, but also use close to real-time data such as marketing campaigns, web actions like a customer clicking the “add to cart” button on a website, local weather forecasts, and much more.
Pivot point 2: Enhanced product discovery through AI-powered search and recommendations
If customers can’t easily find what they are looking for, whether online or at the store, they will turn to someone else. That’s a simple statement, but one with profound impacts.
In research conducted by The Harris Poll and Google Cloud, we found that over a six month period, 95% of consumers received search results that were not relevant to what they were searching for on a retail website. And roughly 85% of consumers view a brand differently after an unsuccessful search, while 74% say they avoid websites where they’ve experienced search difficulties in the past.
Each year, retailers lose more than $300 billion dollars from search abandonment, or when a consumer searches for a product on a retailer’s website but does not find what they are looking for. Our product discovery solutions help you surface the right products, to the right customers, at the right time. These solutions include:
- Vision Product Search, which is like bringing the augmented reality of Google Lens to a retailer’s own branded mobile app experience. Both shoppers and retail store associates can search for products using an image they’ve photographed or found online and receive a ranked list of similar items.
- Recommendations AI, which enables retailers to deliver highly personalized recommendations at scale across channels.
- Retail Search, which provides Google-quality search results on a retailer’s own website and mobile applications.
All three are powered by Google Cloud, leveraging Google’s advanced understanding of user context and intent, utilizing technology to deliver a seamless experience to every shopper. With these combined capabilities, retailers are able to reduce search abandonment and improve conversions across their digital properties.
Pivot point 3: Building the modern store
Stores are no longer places for just browsing and buying. They must be flexible operation centers, ready to pivot to address changing circumstances. The modern store must be multiple things at once: a mini-fulfillment and return center, a recommendation engine, a shopping destination, a fun place to work, and more.
Just as retail companies had to embrace omnichannel, stores are now becoming omnichannel centers on their own, mixing the digital and physical into a single location. Retailers can use physical stores as a vehicle to deliver superior customer experiences. This will demand heightened levels of collaboration and cooperation between stores, digital, and tech infrastructure teams, building on the agile ways they have worked together.
In many ways, it’s about allowing our physical spaces to function more like digital ones. Google Cloud can help by bringing the scalability, security, and reliability of the cloud to the store, allowing physical locations to upgrade infrastructure and modernize their internal and customer-facing applications.
Think of it as when a new OS gets released for your phone. It’s the same small, hard box, but the experience can feel radically different. Now, extend that same idea to a digitally enabled store. With the right displays, interfaces, and tools at a given retail location, the team only needs to send an over-the-air update to create radically fresh experiences, ranging from sales displays to fulfillment or employee engagement.
Such an approach can enable streamlined experiences for both customers and store associates. For instance, when it comes to the modern store’s evolving role as a fulfillment or return center, cloud solutions can help drive efficiency in stores through automation of ordering, replenishment, and fulfillment of omnichannel order selection.
Similar tools for personalized product discovery online can be applied to customers in the store, helping them to browse and explore, or even create a tailored shopping experience.
The impact of store associates can be maximized by equipping them with technology to provide expertise that drives value-added customer service, as well as increasing productivity in stores by streamlining operations, thus lowering overhead cost. At the register, customers should be able to enjoy frictionless checkout while ensuring reliable, accurate, secure transactions.
Google Cloud can help retailers transform
The ability to adapt and pivot to meet today’s changing consumer needs requires that retailers rely on modern tools to obtain operational flexibility. We believe that every company can be a tech company. That every decision is data driven. That every store is physical and digital all at once. That every worker is a tech worker.
Google Cloud works with retailers to help them solve their most challenging problems. We have the unique ability to handle massive amounts of unstructured data, in addition to advanced capabilities in AI and ML. Our products and solutions help retailers focus on what’s most important—from improving operations to capturing digital and omnichannel revenue.
More Relevant Stories for Your Company

Rubin Observatory Leverages Google Cloud to Power Astronomical Research
This week, the Vera C. Rubin Observatory is launching the first preview of its new Rubin Science Platform (RSP) for an initial cohort of astronomers. The observatory, which is located in Chile but managed by the U.S. National Science Foundation’s NOIRLab in Tucson, AZ and SLAC in California, is jointly funded by the NSF and the U.S. Department

BURGER KING Germany: Serving Up Marketing Insights and Supply Chain Visibility Easily
Do hamburgers really come from Hamburg? This may still be a matter of debate, but the popularity of American-style burger joints not just in Hamburg but all over Germany, is clear. Germany’s top two fast food companies are both burger chains. One of them is BURGER KING®, a global brand that welcomes more

How to Predict the Cost of a Managed Streaming and Batch Analytics Service
The value of streaming analytics comes from the insights a business draws from instantaneous data processing, and the timely responses it can implement to adapt its product or service for a better customer experience. “Instantaneous data insights,” however, is a concept that varies with each use case. Some businesses optimize

Data to Business Outcomes with Google’s Data Analytics Design Pattern
Companies today are inundated with vast amounts of data from various sources. This overwhelming amount of data is meant to benefit the company, but often leaves data teams feeling overwhelmed, which can create data bottlenecks and result in a slow time to value. In fact, only twenty seven percent of
