





How Do You Cut Costs and Improve Staff Productivity, and Business Visibility? Ascend Money Has an Answer

10680
Of your peers have already read this article.
6:30 Minutes
The most insightful time you'll spend today!
Hundreds of millions of residents of South East Asia have only limited access to banking and finance services. However, help is at hand. One of South East Asia’s largest fintech businesses, Ascend Money is using digital technologies to realize its mission of enabling as many people as possible to access innovative financial services and live better lives.
According to Ascend Money, 60 percent of the region’s 620 million residents do not have access to a full suite of financial services. Even a relatively small proportion of this market represents a big opportunity for the business.
Ascend Money’s offerings include the TrueMoney regional payment platform for underserved and digital consumers. The TrueMoney platform supports more than 40 million consumers across six countries: Cambodia, Indonesia, Myanmar, the Philippines, Thailand, and Vietnam.
“We found, based on value, ease of use, effectiveness, and the skills and adaptability of our own team members, BigQuery and other Google Cloud Platform services were the best fit for our business.”
– Abraham Jarrett, Head of Engineering, Ascend Money
TrueMoney also provides an e-wallet app that provides easy ways to top up mobile phones, undertake online shopping, and pay for products and services; a network of 65,000 branded shops; and international remittances, initially between Thailand and Myanmar. In addition, Ascend Money offers financial products to small to medium businesses.
Ascend Money is part of the South East Asian online business Ascend Group, which also operates e-commerce, e-procurement, data centers, cloud services, fulfilment, and digital marketing services.
Cost is a key criteria
Ascend Money initially started operations using physical infrastructure and on-premises workforce productivity applications. However, as the business grew its customer base and expanded into new markets, its technology leaders began to explore options to improve value for money; reduce the maintenance load on in-house team members; improve its data management and analysis; and collaborate more effectively.
“Operating our own on-premises infrastructure entails a higher cost of ownership and maintenance, as well as requiring us to scale up our hardware as needed,” says Abraham Jarrett, Head of Engineering, Ascend Money. “We conducted an evaluation and found that moving to the cloud would deliver a range of benefits.”
G Suite and Google Cloud Platform the best fit
The business evaluated solutions available in the market and opted to move to G Suite and Google Cloud Platform.
“Moving to Google Cloud Platform was an optimization exercise, with lowering our costs our primary goal, and achieving better performance an added benefit,” says Jarrett. Google Cloud Platform monitoring, diagnostic, and analytics tools have enabled Ascend Money to reduce its infrastructure spending, becoming more efficient and cost-effective in the process.
“Managing software is a big cost for us. Through G Suite, we are significantly reducing our software deployment, licensing, and repair costs.”
– Abraham Jarrett, Head of Engineering, Ascend Money
The Ascend Money team saw Google Kubernetes Engine as enabling a seamless way of transitioning from an on-premises data center to a cloud service. “We considered industry trends such as what people were adopting and who we could hire when making our decision,” says Jarrett. “Engineering teams are focusing on using Kubernetes open source container management at scale and as a way of doing business, which was attractive to us.
“Google Kubernetes Engine presented the easiest way to manage and orchestrate our containers, and drive us away from our existing infrastructure.”
BigQuery best for cost and ease of use
Ascend Money also reviewed data infrastructure solutions, with its business intelligence and data platform teams considering a range of options. The teams quickly ruled out an on-premises solution due to the capital investment required and opted for a cloud service. Following a rigorous evaluation of Google Cloud Platform against the services offered by another cloud provider, Ascend Money opted to run on Google Cloud.
“We found, based on value, ease of use, effectiveness, and the skills and adaptability of our own team members, BigQuery and other Google Cloud Platform services were the best fit for our business,” says Jarrett. The business is now running an architecture comprising a BigQuery analytics data warehouse; Cloud Storage to store raw and archive data; Cloud Dataflow to process stream and batch data, and Cloud Pub/Sub for event ingestion and delivery.
“We’re expanding our utilization of BigQuery and other services on a daily basis,” says Jarrett.
Ascend Money is also using a range of Google Cloud Platform services for the infrastructure outside its data platform, including Stackdriver logging and monitoring; Cloud KMS to manage cryptographic keys for its cloud services, Cloud Build to undertake continuous integration, delivery, and deployment; Cloud DNS to provide domain name system services; and Cloud Functions to enable its developers to run and scale code in the cloud.
With Google Cloud Platform, Ascend Money is now processing about 12GB of batch data per day and streaming data from about 200 data marts per day in Thailand alone.
Cost effective scalability and faster to market
Google Kubernetes Engine has enabled the business to scale and deliver to market faster. “We can build on the platform, take the application and container and deploy them to scale out,” says Jarrett. “The Google Kubernetes Engine orchestration mechanism that provides containerized, elastic scalability is extremely important in allowing us to manage costs and expend our effort efficiently. Through Kubernetes, we can write once and deploy everywhere.”
With Google Cloud Platform, the business has saved 3,000,000 THB (about US$90,000) in licensing costs and, through automation tools, reduced the time to complete infrastructure activities by 50 percent.
“We don’t have as many meetings since we deployed G Suite and we can work effectively in a distributed fashion.”
– Abraham Jarrett, Head of Engineering, Ascend Money
Ascend Money’s entire workforce is now using G Suite to collaborate and operate productively. The business is achieving a range of benefits including being able to get new team members up and running more quickly and reduced cost. “Managing software is a big cost for us,” says Jarrett. “Through G Suite, we are significantly reducing our software deployment, licensing, and repair costs.” Meanwhile, the shorter time to onboard team members to G Suite is paying off with improved productivity and an accelerated ability to collaborate.
Ascend Money team members primarily use Sheets, Slides, and Docs to create internal materials, including product requirement documents in Docs and workforce and project planning spreadsheets in Sheets.
The organization also uses Hangouts Meet to collaborate when working from different locations. “We don’t have as many meetings since we deployed G Suite and we can work effectively in a distributed fashion,” says Jarrett. “People can work from home and we have five regions plus Thailand where they can collaborate live on a document, such as a slide deck for board meetings or meetings with our chief executive officer, head of engineering, or other senior managers.”
20 hours per week saved
Jarrett describes the time savings of using web browser-based productivity software and G Suite as saving them an average of 20 hours per week. This has improved productivity and the quality of life for Ascend Money’s hard-working team, increasing overall staff satisfaction.
“The ability to work remotely is a big win for us,” Jarrett says. “Our team members can keep one computer at work and one at home and access the same information, they can work in a plane while it sits on the tarmac, or update a Google Doc or a Google Sheet in real time on their phone. They can work anytime, from any location, as long as they have an internet connection. They have less dead time, meaning more uptime.”
With Google Cloud Platform and G Suite, Ascend Money is ideally positioned to support growing demand for its fintech services in South East Asia, particularly among people with limited access to banking. “We have the agility and dynamism to support rising demand and look forward to continuing to work with Google to realize our business ambitions,” says Jarrett.
Wayfair Writes its Success Story with BigQuery for Internal Analytics

4930
Of your peers have already read this article.
4:00 Minutes
The most insightful time you'll spend today!
Editor’s note: Home-goods and furniture giant Wayfair first partnered up with Google Cloud to transform and scale its storefront—work that proved its value many times over during the unprecedented surge in ecommerce traffic during 2020. Today, we hear how BigQuery’s performance and cost optimization have transformed the company’s internal analytics to create an environment of “yes”.
At Wayfair, we have several unique challenges relating to the scale of our product catalog, our global delivery network, and our position in a multi-sided marketplace that supports both our customers and suppliers. To give you a sense of our scale we have a team of more than 3,000 engineers with tens of millions of customers. We supply more than 20 Million items using more than 16,000 supplier partners.
Serving those constituents generates a lot of analytics work. Wayfair runs over a billion ‘analytic’ database queries a year, from both humans and systems, against multi-petabyte datasets. Scaling our previous environment to meet these challenges required us to maintain dozens of copies of data for different use cases and manage complex data synchronization routines to move trillions of records each day, resulting in long development times and high support costs for our analytics projects.
Centralizing our data using Cloud Storage and BigQuery enabled us to break down existing silos and build unified pipelines for our batch and real-time operations. BigQuery shines by letting us decouple our compute and storage resources and flexibly ingest structured data in streaming and batch modes. We also benefit from the same decoupling for more complicated machine learning (ML) workflows in Dataproc and Cloud Storage. In particular, BigQuery is extremely low maintenance. From ML and easy data integrations to the integrated query cache, many out-of-the-box features have proven valuable for multiple use cases.
Beyond storage and compute, Google Cloud offers multiple tools to maximize the value of our data. For example, we can easily connect Data Studio to BigQuery for lightning-fast dashboarding of enterprise KPI reporting. When we need to dive deeper into a metric, Looker provides an interface and semantic model that empowers more business users to answer important questions — without understanding SQL or our vast dataset and table structure.
The combination of all of Google Cloud’s tools enables every Wayfairian the opportunity to self-serve their data visualization and analysis needs. We are able to support all of the requirements of our internal and external users, from descriptive analytics to alerting and ML, in a platform that blends Google’s proprietary technology with open-source standards.we have seen a greater than 90% reduction in the number of analytic queries in production that take more than one minute to run
As a result, we have seen a greater than 90% reduction in the number of analytic queries in production that take more than one minute to run, which delights our users and increases adoption of our analytics tools across the business.
Higher performance means saying “Yes” more often
We went into the BigQuery experience expecting very strong performance on large, aggregate queries and excellent scalability — the kind of performance that could enable consistent 5-15 minute processing queries and 5-10 second response times for large analytics queries.
We weren’t disappointed — we saw slightly better than linear performance profiles as record counts went up from millions to trillions for a flat resource allocation. BigQuery had the expected high performance for aggregate queries. This made our large data processing pipelines predictable and straightforward to maintain and optimize.
Below is a plot of gigabytes processed by a query against query run time in seconds; outliers are filtered and the axes are pruned to ranges where we had a large sample size. This focuses on longer-duration queries. As an example of the linear performance, a 2 terabyte query averages 5 minutes — 2.5min/terabyte — and an 18 terabyte query (9 times as much data) averages 25s — only 1.4min/terabyte. This is despite the fact that complex queries [sorting and analytic functions are particularly problematic] are more common with large data sizes. We do see increasing variability at large sizes as slot limits and other resource constraints come into play, but these factors are controllable and ultimately a business optimization decision.
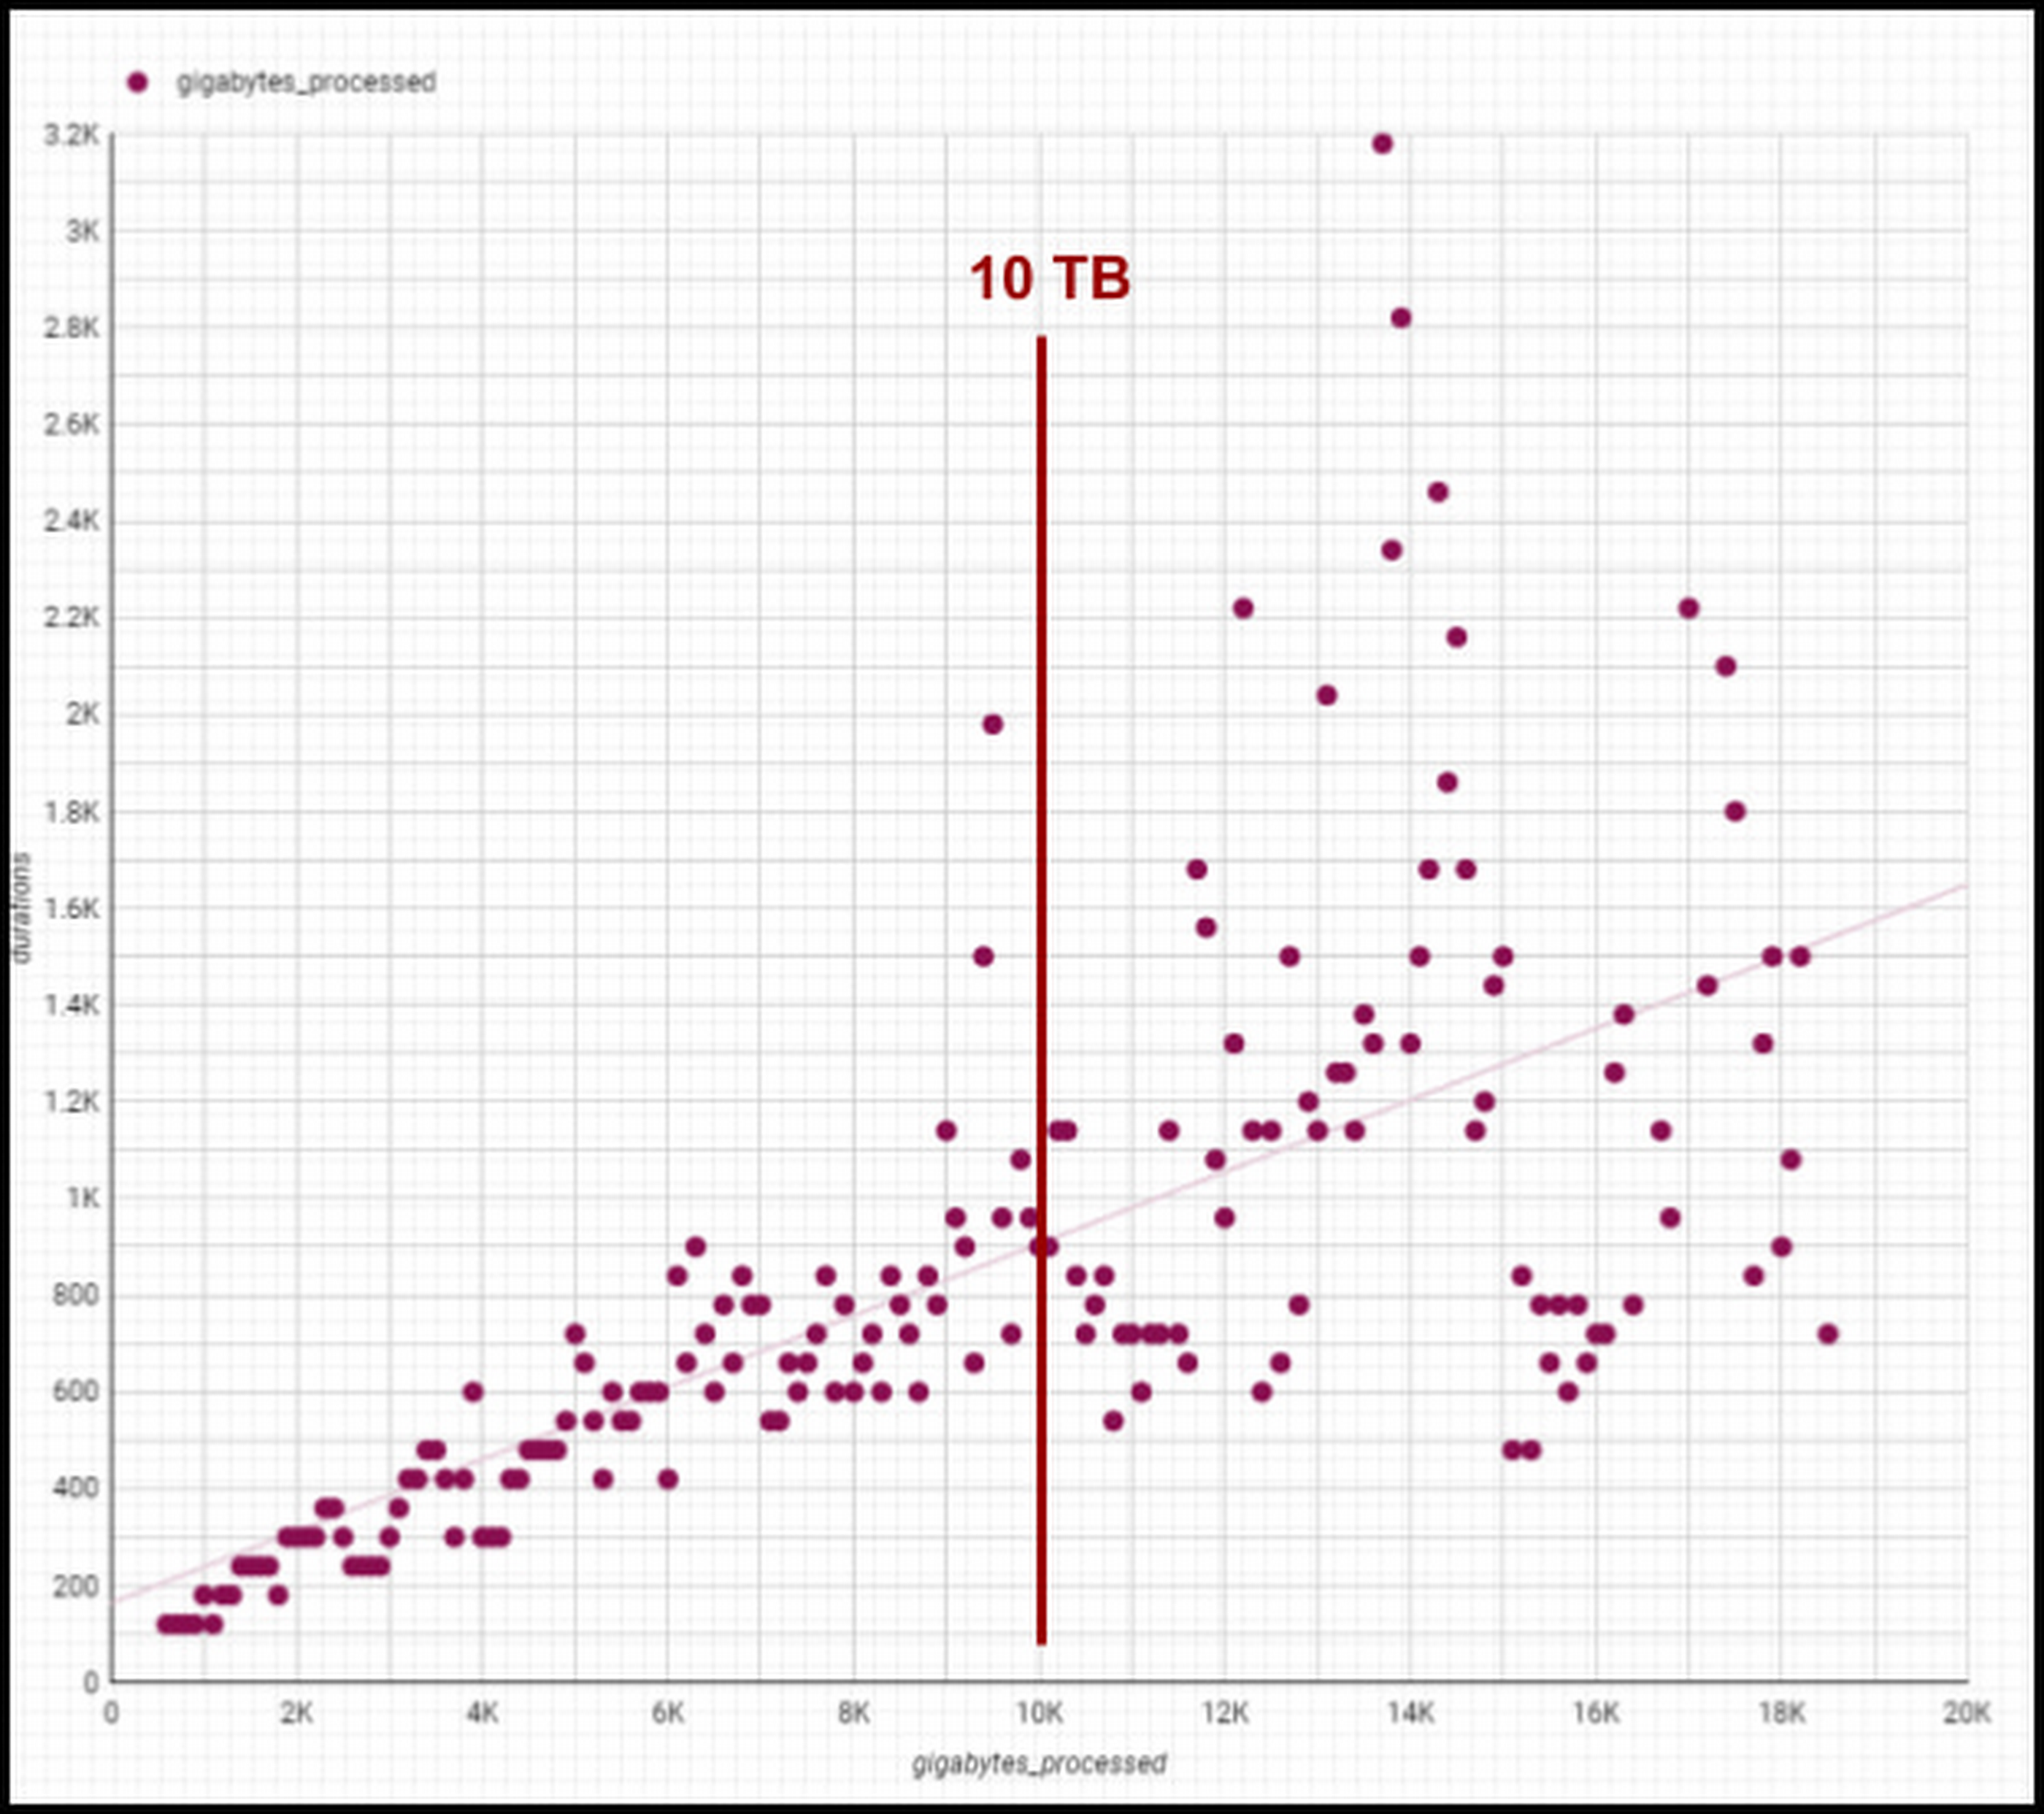
Though individual values vary greatly depending on query complexity [analytic functions/sorting can be computationally expensive], the overall trend line is below 1-1 for bytes versus duration, meaning our BigQuery query runtimes are increasing slower than our data volumes. We are still seeing sub 1:1 threshold runtimes, and we’re already at 100 PB of total data with single queries running on 50PB or more. Going strong!
One unexpected and pleasant surprise has been high performance for smaller queries, such as those required for development, interactive analytics, and internal applications we use for forecasting, segmentation, and other latency-sensitive data workflows. BigQuery’s resource management systems have provided smoother degradation and parallelism profiles than we initially expected for a multi-tenant platform.
We regularly see sub-second p50 query performance for interactive use cases, with p90 performance coming in under 10 seconds for Looker, Data Studio, and AtScale — meeting the threshold we set to avoid analysts losing focus during a business investigation. The chart below shows p50, p90, and p95 timing for core workloads, as well as the number of queries in each bucket and the number of unique users. [Looker and Atscale will use small numbers of service accounts for a large number of users].

This has enabled two important shifts in the way our customers experience analytics services:
- Delivering better user productivity. People no longer have long wait times to get results for a basic query delivering an improved overall user experience.
- Scaling our data transformation. BigQuery has proven, effective data transformation that allows us to embrace the industry shift away towards ELT (extract, load, transform) to transform raw data right within the database.
We no longer have to ask ourselves, “Can we meet the SLA for this data processing task?” The new conversation is, “Of course, we can meet it. What’s the associated cost based on how many resources we assign?” We can make cost and resource trade-offs clear to our users and say “yes” more often to requirements that have measurable business value.
Supporting cost vs. performance decisions
Democratized access to internal analytics is a powerful decision-making tool. With BigQuery’s robust tooling, the decision about how to best allocate computational resources is in the hands of the analytics groups closest to the business decision being made. If they want to spend a sprint optimizing a dashboard, they can show exactly how much money it will save. If they choose not to optimize a report, they can offset the decision with concrete cost savings and other realized value.
Wayfair teams also benefit from visibility into their committed costs by abstracting away the details of the underlying services, including BigQuery slots, the virtual CPUs used to execute SQL queries.
Take a look at this example view consumed by our teams (the metrics for these dashboards are from the BigQuery INFORMATION_SCHEMA (jobs and reservations tables):
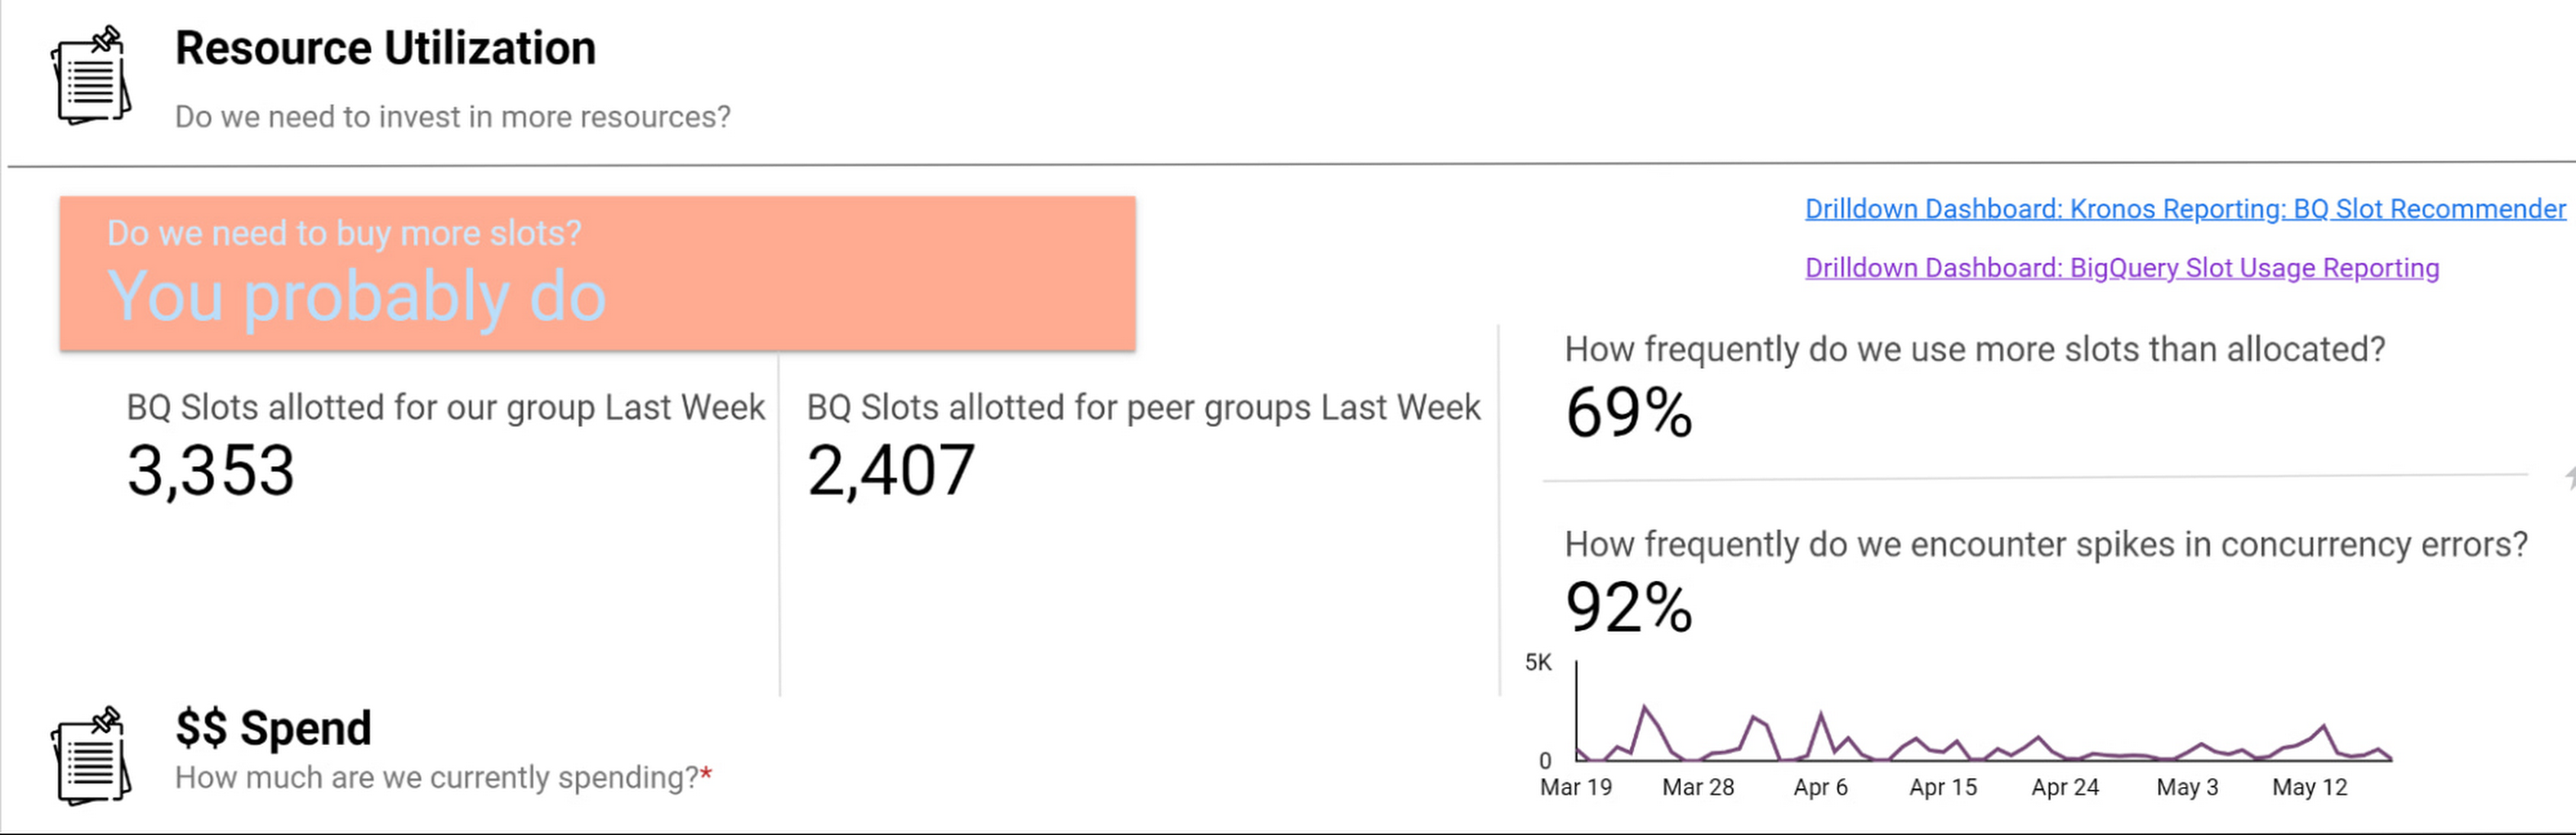
Suppose an organization wants to purchase capacity for a period of time. In that case, we provide an average cost for a slot during that time and charge them based on their slot usage for queries, multiplied by the average price.
Teams can see whether their consumption matches their reservations with a consistent, high-level number. We apply the same approach to tools like Dataproc by aggregating up the costs of component services and providing an organizational cost for those services.
How we use performance signals to improve user efficiency
Instead of overcorrecting for occasional performance fluctuations by allocating excessive resources, we try to align incentives so that people make the right choices for the business. Showback doesn’t work in a vacuum — it requires context and integrated insights. Teams need to show the cost of running a dashboard as well as the ROI is in terms of end user engagement and what peer dashboards with equivalent source datasets might cost.
We want to give users the freedom to do things the way they want and need to while also educating them on achieving their goals and using best practices to reduce their costs and improve their performance. The goal is never for all dashboards to load “less than x seconds” — we believe that any dashboard can load in x seconds when it is properly designed and resourced.
For instance, BigQuery allocates slots for a new workload quickly and efficiently, and queries that are optimized and have dedicated resources consistently complete quickly. When users experience a slowdown, it’s typically because they are sharing resources or inefficiently using their resources. Variable performance is a useful signal to help users discover opportunities to optimize queries and work more productively. We value these signals as we like to focus on the aggregate experience of all users interacting with the tool, not individual interaction.
A natural way to improve user efficiency is to reward ideal behaviors and discourage those that do not align with our analytics strategy. Some examples include splitting out high-demand reporting from ad-hoc exploration to reduce concurrency errors or encouraging people to use materialized tables instead of writing complex custom SQL. For instance, a dedicated reporting project might only include an organization’s Data Studio dashboard if it directly references a table or meets other optimization requirements. Using this approach, we give our users a high degree of freedom and experimentation at the entry-level while providing a well-documented path to scale.
Visibility into query performance improves business performance
The detailed tracking information we get from Google Cloud products is critical — Google’s robust analytics performance has enabled us to scale Data Studio to over 15,000 Wayfarians. Of course, a larger user base always comes with concerns that less sophisticated users may not appropriately optimize their queries or make the best use of the infrastructure.
Evaluating the different Data Studio dashboards helps us identify opportunities to use better query optimization practices, such as reducing custom queries, connecting directly to permanent tables, or using the BI Engine to improve dashboard performance. Recently, our team built new billing projects specific for Data Studio reporting. We can scale up a reservation dedicated to reporting about a major sales event in minutes.
Beyond everyday reporting, holidays and sales events may require higher, guaranteed performance. BigQuery’s flexible capacity commitments allow us to decide at a business level whether an urgent need requires us to reprioritize resources immediately or whether we have the time to optimize queries and rebuild dashboards to be performant. These new billing projects let us evaluate if teams need to scale up resourcing, what areas they can optimize in BigQuery, or if a new reservation is needed to resource that team separately.
Recommendations for achieving high performance at low cost
Are you wondering how to allocate BigQuery slots? Teams must see direct, immediate return on their investment in performance and optimization.
Our first rule of thumb is to align resource utilization with ownership as closely as possible. This makes it easier for teams to secure dedicated resources, even if they start out small. We’re comfortable doing this because BigQuery dynamically reassigns capacity between the targeted reservation and other consumers in milliseconds. We always get the total usage of our slots — there is no wasted capacity even when we break assignments down granularly.
Once a team has a reservation, we provide reporting that consumes various BigQuery information schema views, such as query logs and reservation information, and processes it into aggregated reporting. We look for metrics like the average slots available to a query at a point in time, overall query performance, and how long queries took to execute to pinpoint the overall health of a reservation against our business objectives. Flex slots also let us experiment easily with additional capacity, and BigQuery’s performance is so consistent that we can use straightforward models to estimate return on additional slot investment.
Other key cost optimization tips we have found helpful at Wayfair include:
- Optimize for worst-case performance. Given BigQuery’s ability to share slots, we expect teams will often see much better performance, but we find that thinking it’s more effective when teams think about the most pessimistic case when resourcing their jobs.
- Take advantage of BI Engine reservations. We like to think critically about the data and workload. BI Engine reservations are excellent for workloads that query lots of small dimension tables or a few larger tables loaded into memory. In cases like that, such as with OLAP tools using pre-computed aggregates, we’ve seen BI engine investments drive a 25% reduction in average query time—excellent ROI.
- Leverage Looker for large, longitudinal datasets. Since Looker supports a wide range of use cases, we see a broader range of performance — p50 is still under a second, but p95 can get as high as a minute. For these cases, we recommend modeling user patterns [first of month, first day of week] and dynamically allocating more slots for these periods while deprioritizing batch workloads in the key windows.
- Lean in heavily on the BQ cache for broad-based reporting. To avoid a Monday morning reporting lag, We use the BigQuery cache to avoid Monday morning report loading lags. Up to 30% of our Data Studio queries hit the BQ cache, ensuring our Data Studio p95 consistently stays under 10 seconds.
- Use slots-per-job to improve experience. In our reporting, we find that the most valuable view is slots-per-job. We look for dips in slots available for jobs as this situation often correlates strongly with poor user experiences. For example, our reporting showed us that Looker has the highest volumes of queries and users on Mondays and during each month’s first two business days. We used this information to scale up slots to support these periods of highest demand, delivering on performance SLAs to support business users.

- Get a global picture of usage. We manage slots in a central tool. Teams input their requirements into a calendar to indicate when they want higher or lower capacity to inform our flex slot purchases and annual commitments. It might seem like dozens of relatively inconsistent workloads at the team level, but the picture changes when you look at demand across a week (or our entire business). Understanding global usage makes it easy for us to model baseline capacity recommendations for serving year slots versus flexible demands.
Reaping the rewards of BigQuery
From our first initial undertaking with Google Cloud to transform our storefront, we had a lot of confidence in the underlying technology offerings and the teams that ran them and their ability to meet our unique requirements. But our experience using BigQuery for internal analytics at Wayfair has exceeded our already high expectations.
BigQuery’s fast, dynamic allocation of resources and ability to transform data in place are important to our mission of maintaining consistently high performance for our users while closely managing costs. Moreover, our visibility into query and dashboard performance through BigQuery’s DSP views and other performance metrics have helped us make clearer connections between performance goals and the costs required to meet them — and guide our analysts across the company towards attaining high performance on every project.

Upgrade Your Contact Center with Knowlarity’s AI-powered Speech Analytics for Higher CX
DOWNLOAD E-BOOK6204
Of your peers have already downloaded this article
7:00 Minutes
The most insightful time you'll spend today!
Did you know, everyday about 56 million hours worth of phone conversations, equalling to 420 billion spoken words are handled by contact centers? Knowlarity, a renowned cloud business communication service provider with nearly 6,000 customers and over a million virtual users, leverages AI-powered speech analytics that offer insights to gauge customer preferences and emotions, campaign performance, agent’s effectiveness and much more. Knowlarity’s programmatic speech analytics platform is built with Google Cloud to optimize contact center performance by transcribing and analyzing millions of calls to impact savings, operations, CX, customer loyalty and retention, and revenue generation.
Download the e-Book to learn more about Knowlarity’s speech analytics for your business’ contact centers and elevate your agents’ performance by leveraging ML, natural language processing (NLP) and AI capabilities.
Recommendations for Modelling SAP Data inside BigQuery

8408
Of your peers have already read this article.
4:00 Minutes
The most insightful time you'll spend today!
Over the past few years, many organizations have experienced the benefits of migrating their SAP solutions to Google Cloud. But this migration can do more than reduce IT maintenance costs and make data more secure. By leveraging BigQuery, SAP customers can complement their SAP investments and gain fresh insights by consolidating enterprise data and easily extending it with powerful datasets and machine learning from Google.
BigQuery is a leading cloud data warehouse, fully managed and serverless, and allows for massive scale, supporting petabyte-scale queries at super-fast speeds. It can easily combine SAP data with additional data sources, such as Google Analytics or Salesforce, and its built-in machine learning lets users operationalize machine learning models using standard SQL — all at a comparatively low cost.
If your SAP-powered organization is looking to supercharge its analytics with the strength of BigQuery, read on for considerations and recommendations for modeling with SAP data. These guidelines are based on our real-world implementation experience with customers and can serve as a roadmap to the analytics capabilities your business needs.
Considerations for data replication
Like most technology journeys, this one should start with a business objective. Keeping your intended business value and goals in mind is critical to making the right decisions in the early steps of the design process.
When it comes to replicating the data from an SAP system into BigQuery, there are multiple ways to do it successfully. Decide which method will work best for your organization by answering these questions:
- Does your business need real-time data? Will you need to time travel into past data?
- Which external datasets will you need to join with the replicated data?
- Are the source structures or business logic likely to change? Will you be migrating the SAP source systems any time soon? For instance, will you be moving from SAP ECC to SAP S/4HANA?
You’ll also need to determine whether replication should be done on a table-by-table basis or whether your team can source from pre-built logic. This decision, along with other considerations such as licensing, will influence which replication tool you should use.
Replicating on a table-by-table basis
Replicating tables, especially standard tables in their raw form, allows sources to be reused and ensures more stability of the source structure and functional output. For example, the SAP table for sales order headers (VBAK) is very unlikely to change its structure across different versions of SAP, and the logic that writes to it is also unlikely to change in a way that affects a replicated table.
Something else to consider: Reconciliation between the source system and the landing table in BigQuery is linear when comparing raw tables, which helps avoid issues in consolidation exercises during critical business processes, such as period-end closing. Since replicated tables aren’t aggregated or subject to process-specific data transformation, the same replicated columns can be reused in different BigQuery views. You can, for instance, replicate the MARA table (the material master) once and use it in as many models as needed.
Replicating pre-built logic
If you replicate pre-built models, such as those from SAP extractors or CDS views, you don’t need to build the logic in BigQuery, since you’re using existing logic. Some of these extraction objects have embedded delta mechanisms, which may complement a replication tool that can’t handle deltas. This will save initial development time, but it can also lead to challenges if you create new columns, or if customizations or upgrades change the logic behind the extraction.
It’s also important to note that different extraction processes may transform and load the same source columns multiple times, which creates redundancy in BigQuery and can lead to higher maintenance needs and costs. However, replicating pre-built models may still be a good choice, since doing so can be especially useful for logic that tends to be immutable, such as flattening a hierarchy, or logic that is highly complex.
How you approach replication will also depend on your long-term plans and other key factors — for example, the availability (and curiosity) of your developers, and the time or effort they can put into applying their SQL knowledge to a new data warehouse.
With either replication approach, bear in mind when designing your replication process that BigQuery is meant to be an append-always database — so post-processing of data and changes will be required in both cases.
Processing data changes
The replication tool you choose will also determine how data changes are captured (known as CDC – change data capture). If the replication tool allows for it (for example as SAP SLT does) the same patterns described in the CDC with BigQuery documentation also apply to SAP data.
Because some data, like transactions, are known to be less static than others (e.g., master data), you need to decide what should be scanned in real time, what will require immediate consistency, and what can be processed in batches to manage costs. This decision will be based on the reporting needs from the business.
Consider the SAP table BUT000, containing our example master data for business partners, where we have replicated changes from an SAP ERP system:
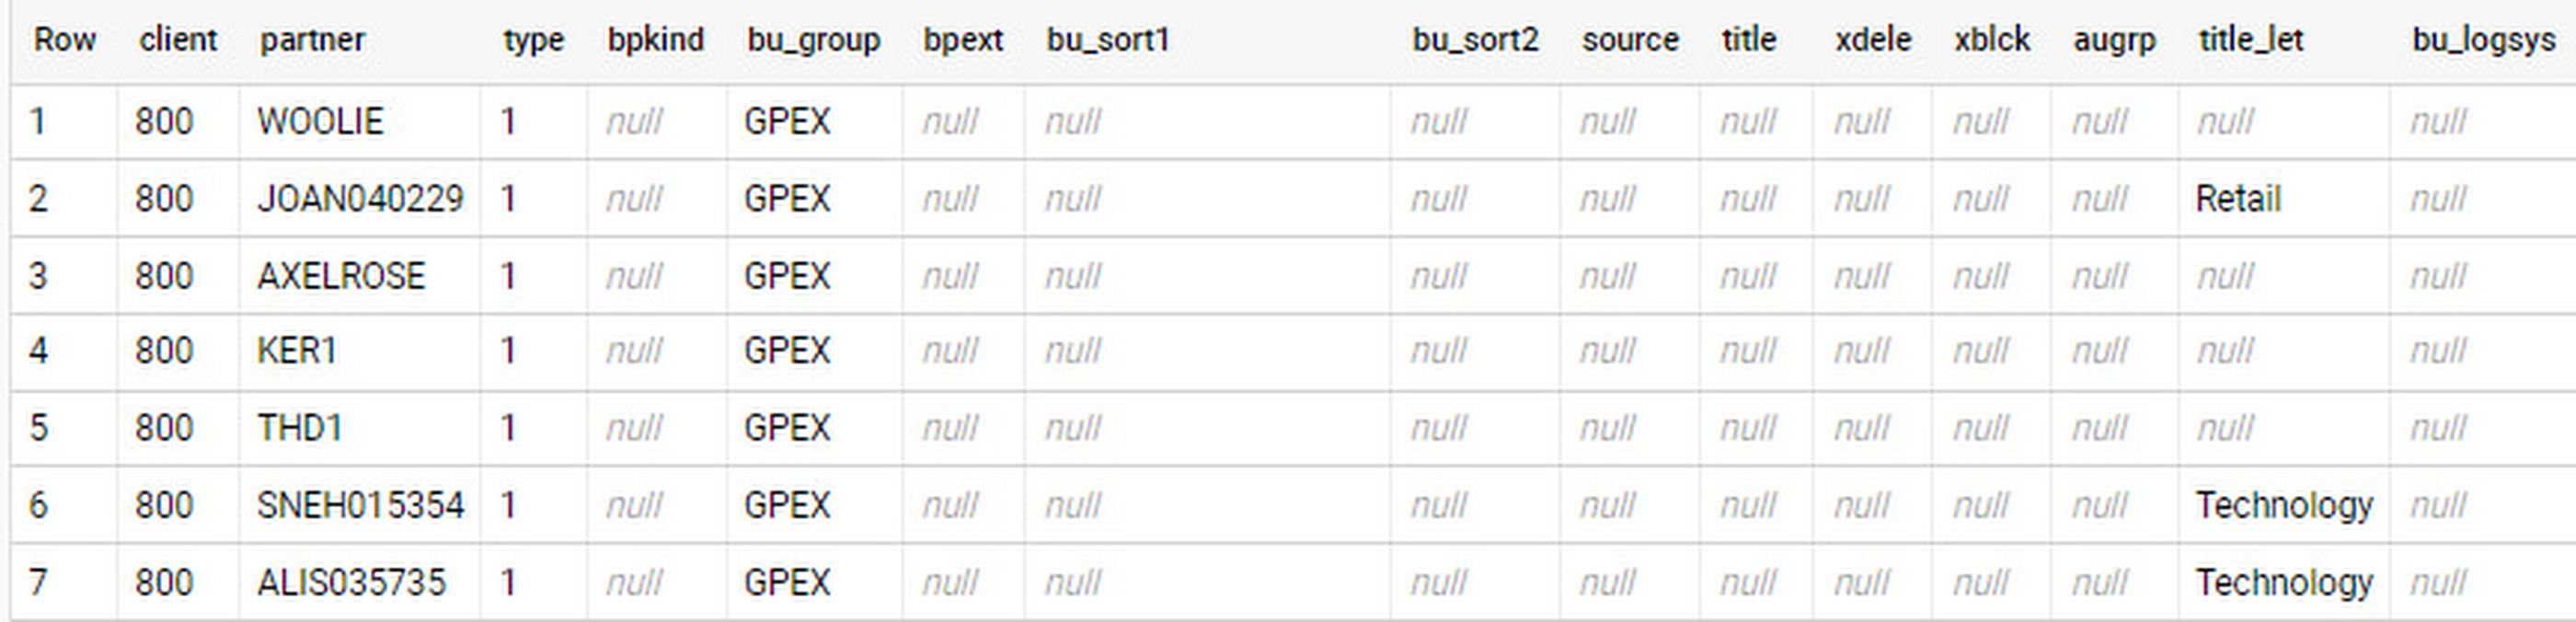
In an append-always replication in BigQuery, all updates are received as new records. For example, deleting a record in the source will be represented as a new record in BigQuery with a deletion flag. This applies to whether the records are coming from raw tables like BUT000 itself or pre-aggregated data, as from a BW extractor or a CDS view.
Let’s take a closer look at data coming particularly from the partners “LUCIA” and “RIZ”. The operation flag tells us whether the new record in BigQuery is an insert (I), update (U) or deletion (D), while the timestamps help us identify the latest version of our business partner.
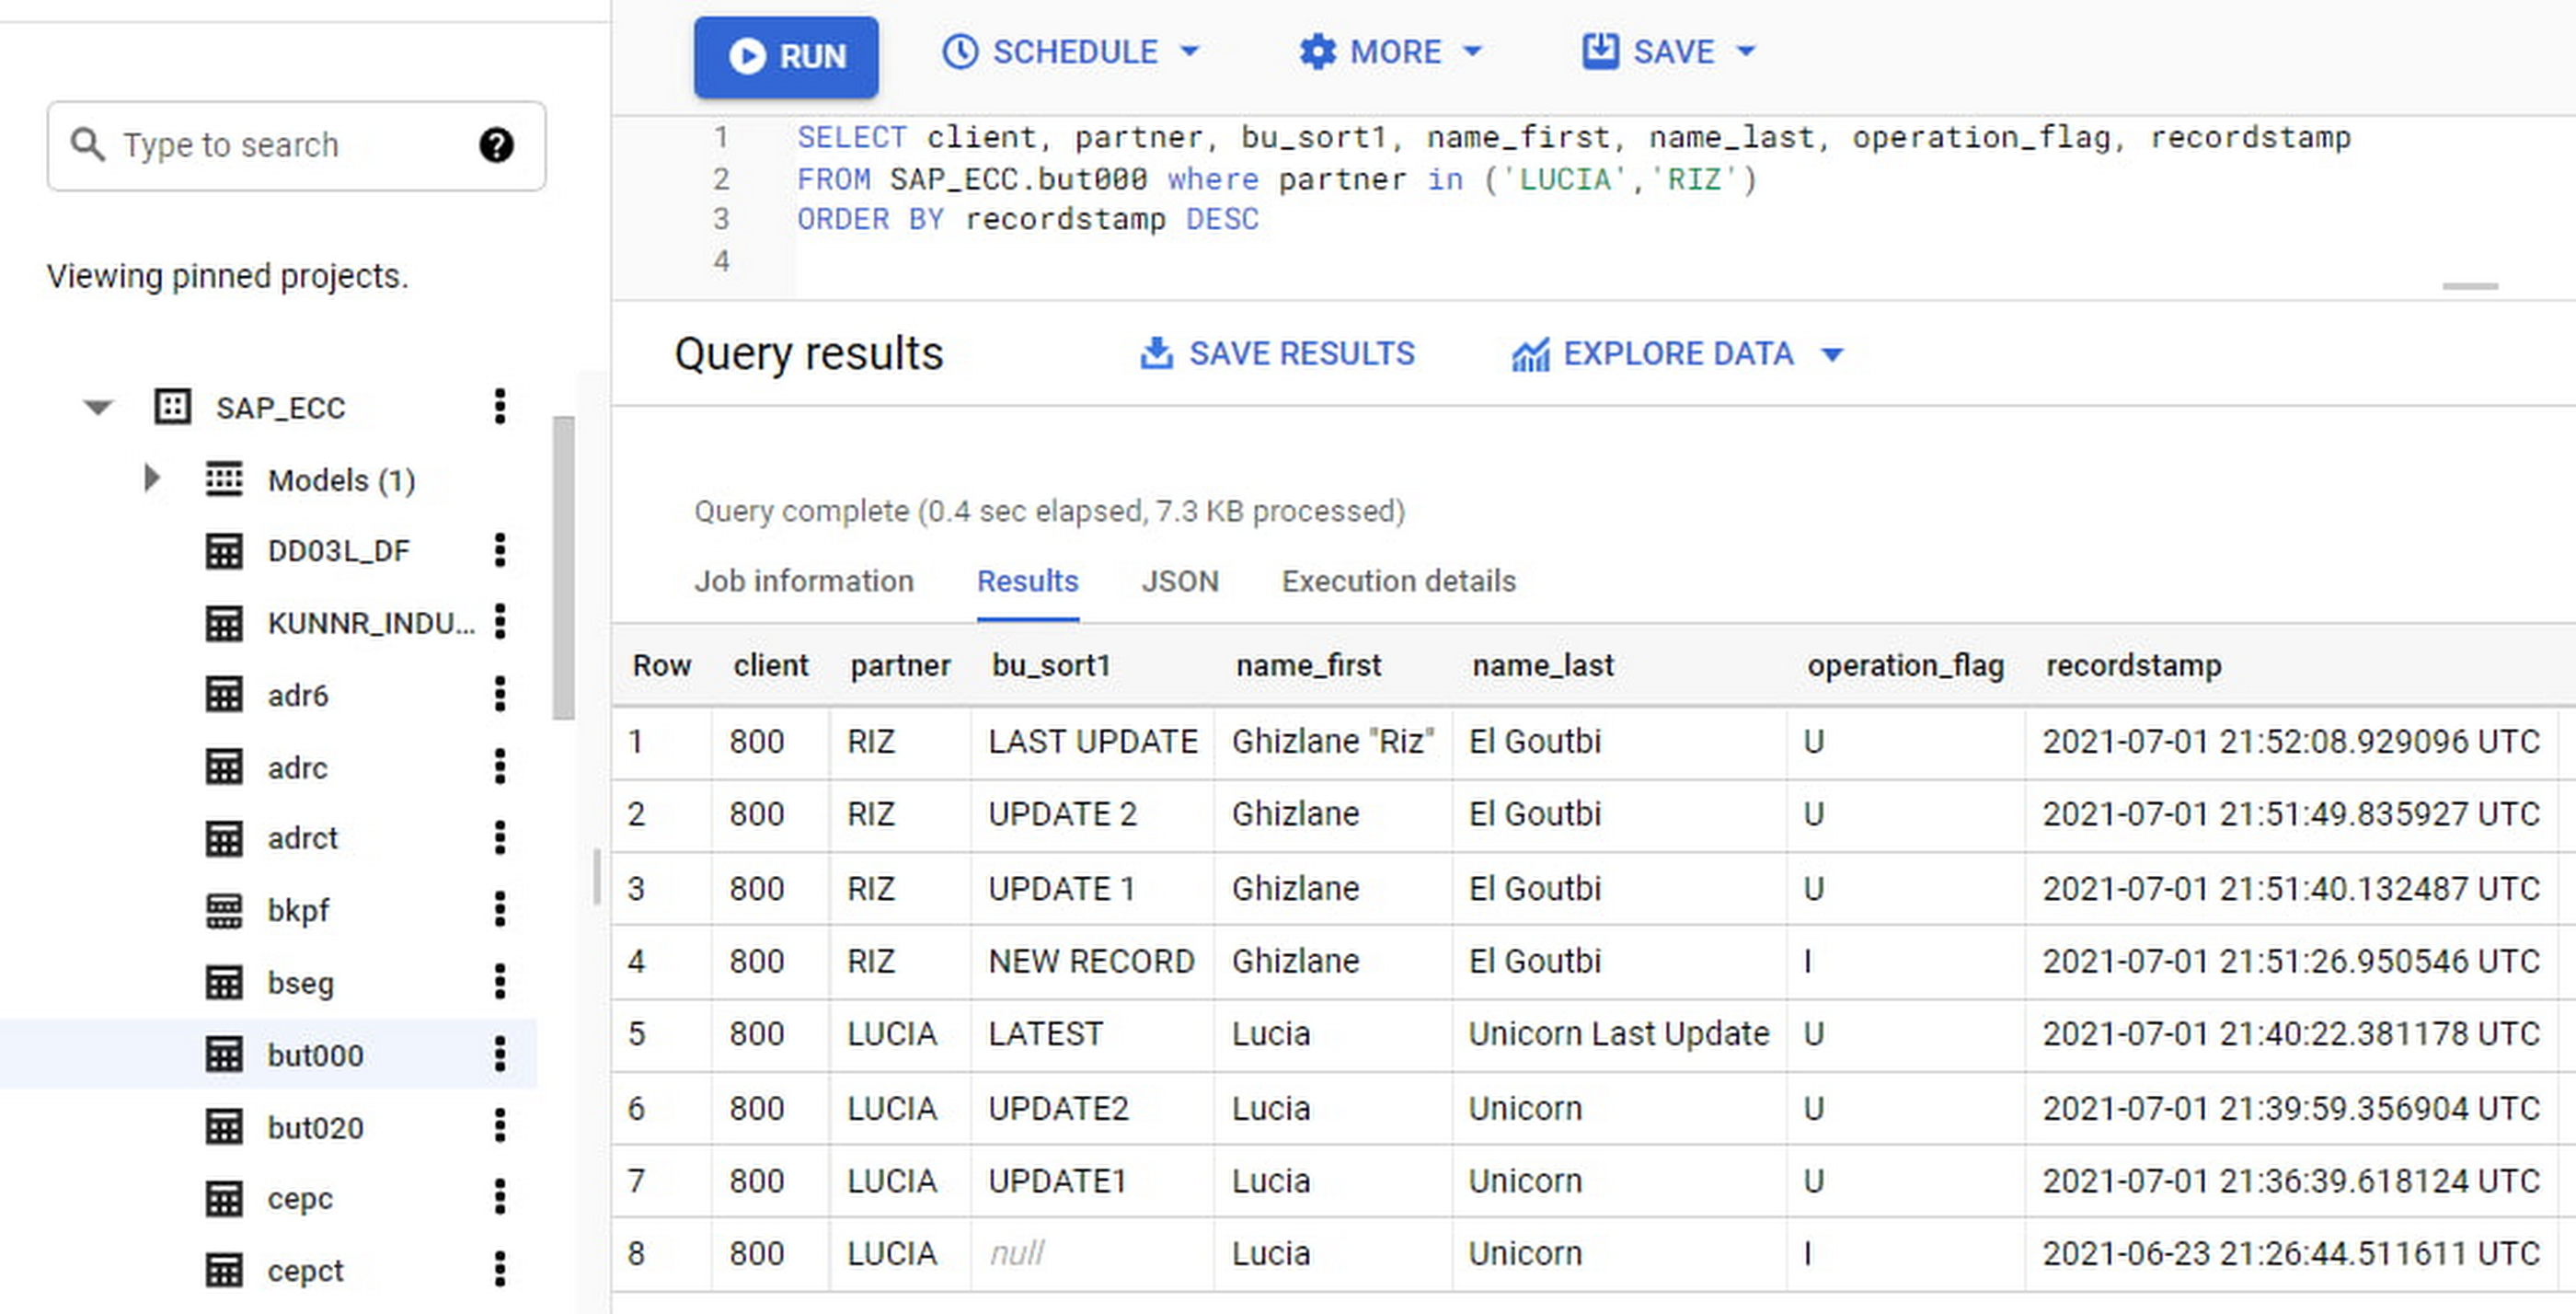
If we want to find the latest updated record for the partners LUCIA and RIZ, this is what the query would look like:
SELECT partner,ARRAY_AGG(i1 ORDER BY i1.recordstamp DESC LIMIT 1) AS rowFROM SAP_ECC.but000 i1WHERE partner in ('LUCIA','RIZ')GROUP BY partner
With the following result:
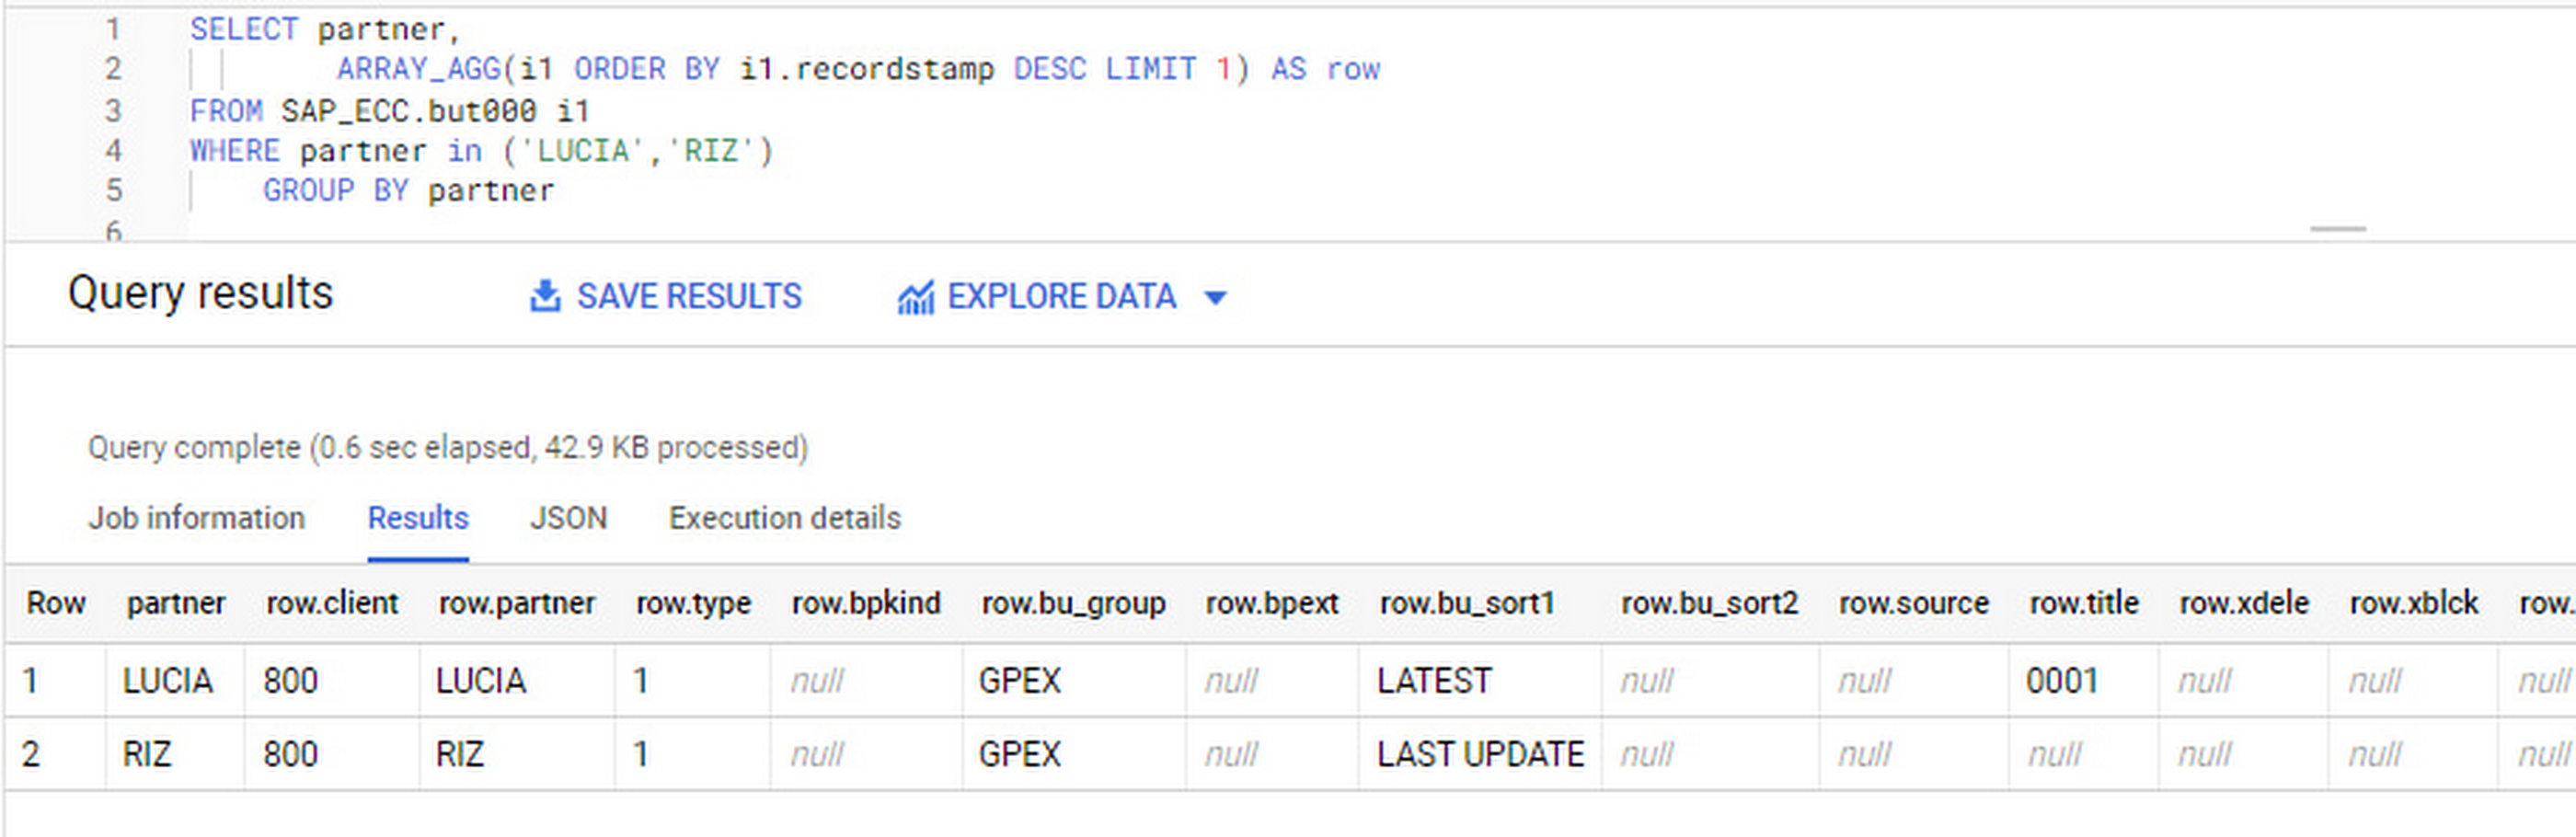
After identifying stale records for “LUCIA” and “RIZ” business partners, we can proceed to deleting all stale records for “LUCIA” if we do not want to retain the history. In this example, we are using a different table to which the same replication has been done, for the purpose of comparison and to check that all stale records have been deleted for the selection made and that we only kept last updated records. For example:
DELETE SAP_HANA.but000 i1WHEREi1.recordstamp < TIMESTAMP_SUB(CURRENT_TIMESTAMP(), INTERVAL 3 HOUR) ANDi1.recordstamp < (SELECT MAX(recordstamp) FROM SAP_HANA.but000 i2WHEREi1.partner = i2.partnerand partner="LUCIA")
You can also use the following query to retrieve stale records for “LUCIA” partner before moving forward with deletion
SELECT partner, operation_flag, recordstamp FROM SAP_HANA.but000 i1WHEREi1.recordstamp < TIMESTAMP_SUB(CURRENT_TIMESTAMP(), INTERVAL 3 HOUR)ANDi1.recordstamp < (SELECT MAX(recordstamp) FROM SAP_HANA.but000 i2WHEREi1.partner = i2.partnerand partner="LUCIA")
Which produces all of the records, except the latest update:

Partitioning and clustering
To limit the number of records scanned in a query, save on cost and achieve the best performance possible, you’ll need to take two important steps: determine partitions and create clusters.
Partitioning
A partitioned table is one that’s divided into segments, called partitions, which make it easier to manage and query your data. Dividing a large table into smaller partitions improves query performance and controls costs because it reduces the number of bytes read by a query.
You can partition BigQuery tables by:
- Time-unit column: Tables are partitioned based on a “timestamp,” “date,” or “datetime” column in the table.
- Ingestion time: Tables are partitioned based on the timestamp recorded when BigQuery ingested the data.
- Integer range: Tables are partitioned based on an integer column.
Partitions are enabled when the table is created, as in the example below. A great tip is to always include the partition filter as shown on the left-hand side of the query.

Clustering
Clustering can be created on top of partitioned tables by applying the fields that are likely to be used for filtering. When you create a clustered table in BigQuery, the table data is automatically organized based on the contents of one or more of the columns in the table’s schema. The columns you specify are then used to colocate related data.
Clustering can improve the performance of certain query types — for example, queries that use filter clauses or that aggregate data. It makes a lot of sense to use them for large tables such as ACDOCA, the table for accounting documents in SAP S/4HANA. In this case, the timestamp could be used for partitioning, and common filtering fields such as the ledger, company code, and fiscal year could be used to define the clusters.
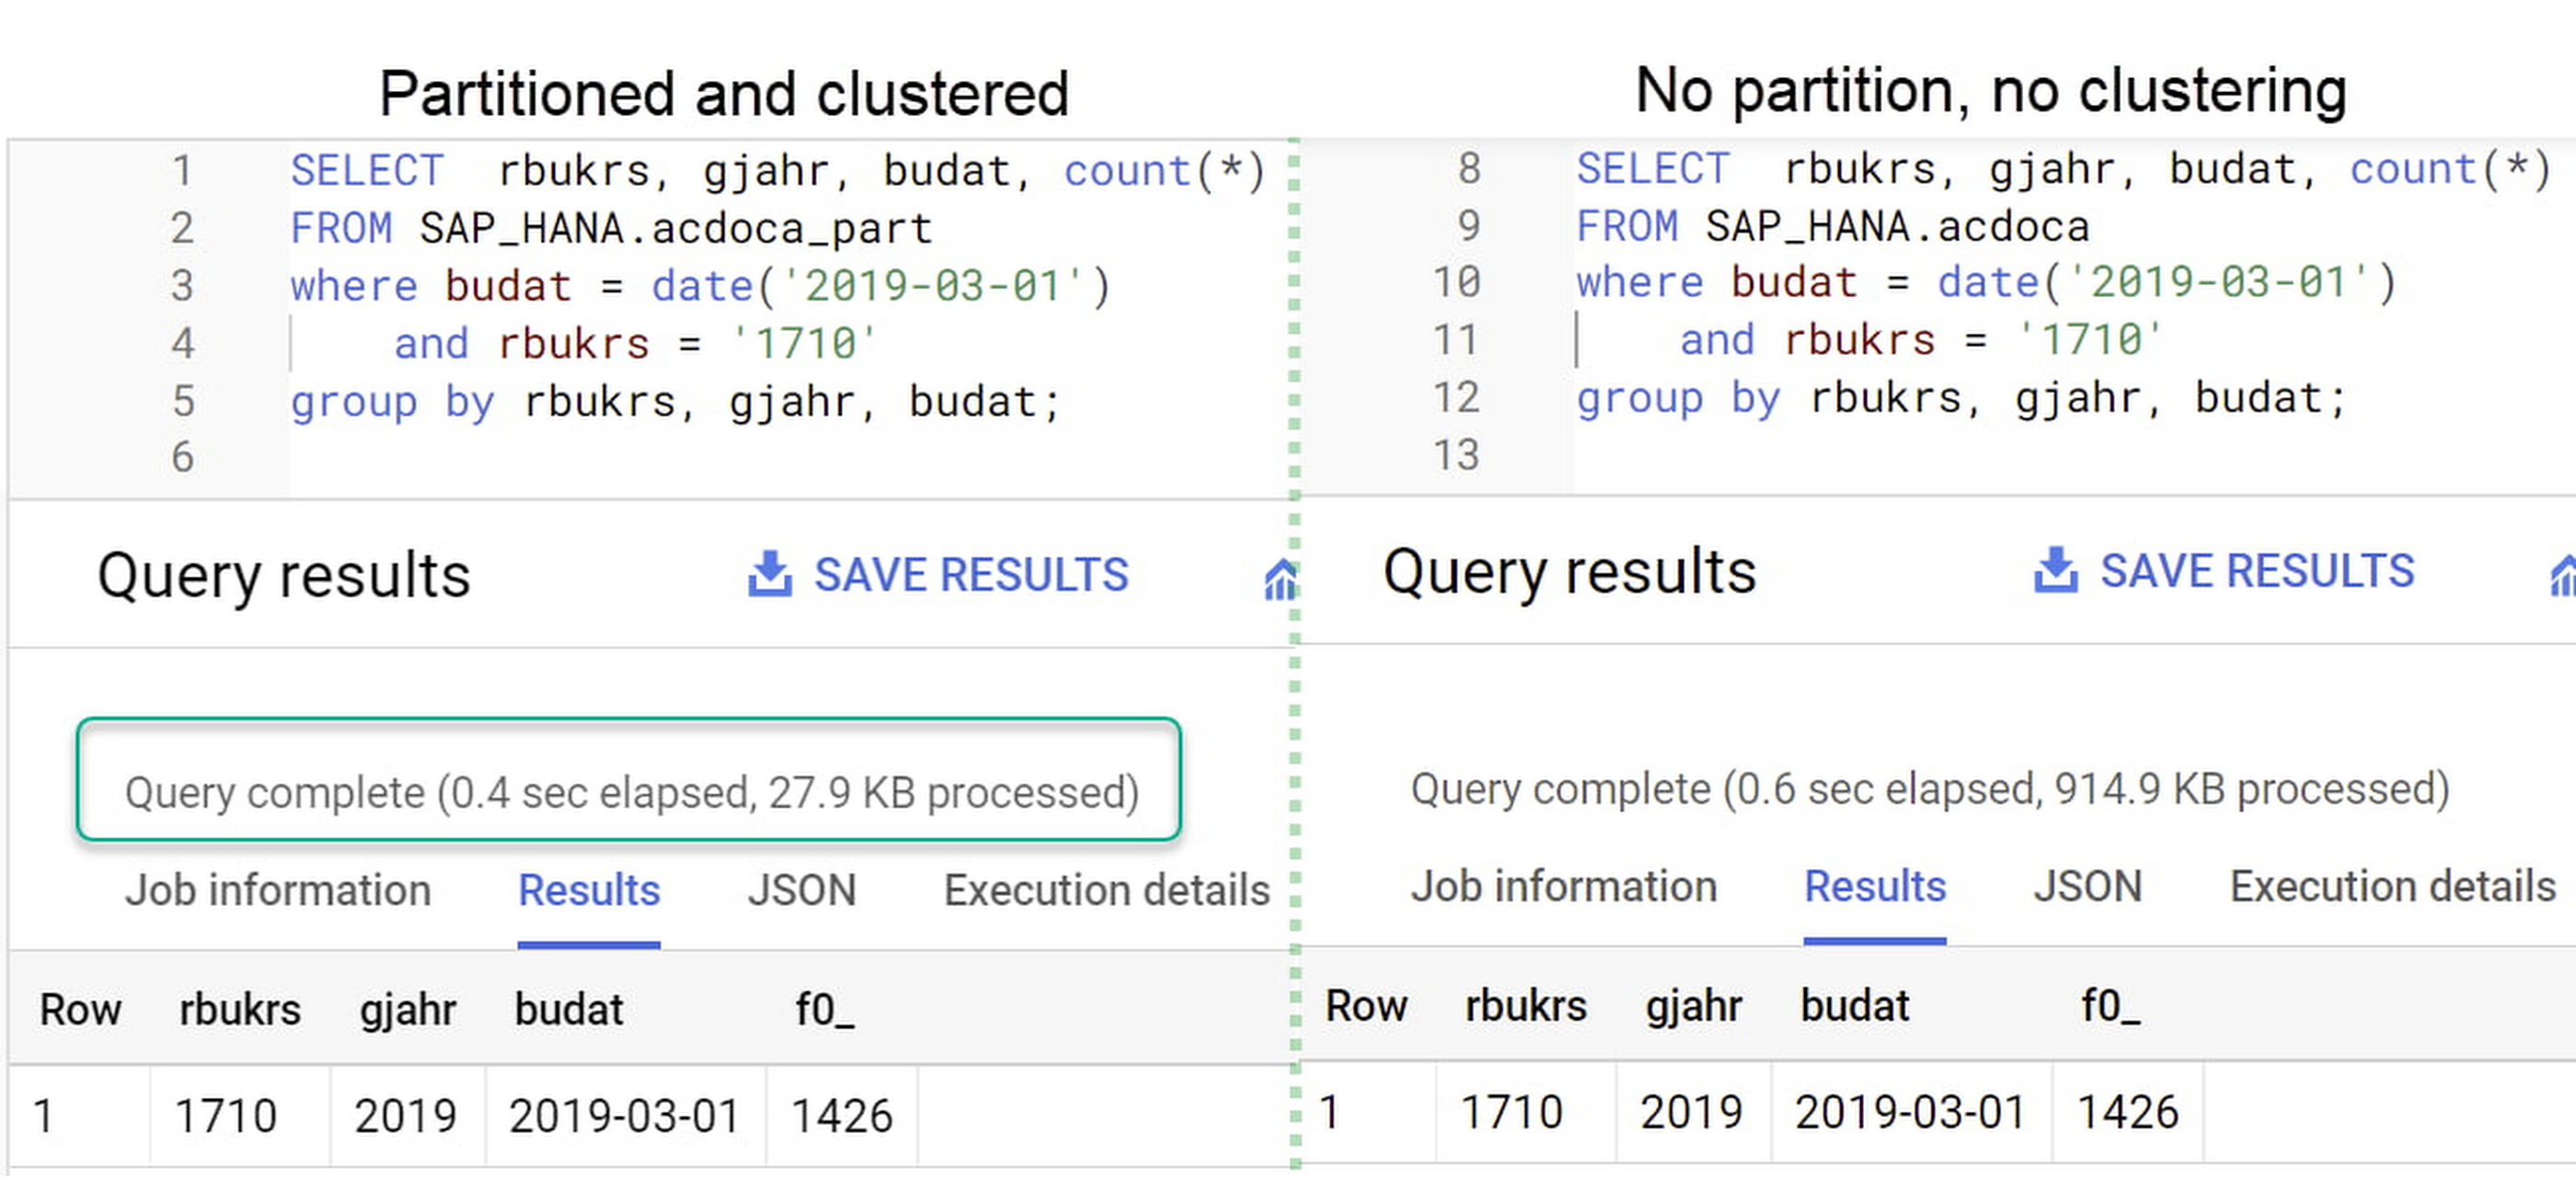
A great feature is that BigQuery will also periodically recluster the data automatically.
Materialized views
In BigQuery, materialized views are precomputed views that periodically cache the results of a query for better performance and efficiency. BigQuery uses precomputed results from materialized views and, whenever possible, reads only the delta changes from the base table to compute up-to-date results quickly. Materialized views can be queried directly or can be used by the BigQuery optimizer to process queries to the base table.
Queries that use materialized views are generally completed faster and consume fewer resources than queries that retrieve the same data only from the base table. If workload performance is an issue, materialized views can significantly improve the performance of workloads that have common and repeated queries. While materialized views currently only support single tables, they are very useful common and frequent aggregations like stock levels or order fulfillment.
Further tips on performance optimization while creating select statements can be found in the documentation for optimizing query computation.
Deployment pipeline and security
For most of the work you’ll do in BigQuery, you’ll normally have at least two delivery pipelines running — one for the actual objects in BigQuery and the other to keep the data staging, transforming, and updated as intended within the change-data-capture flows. Note that you can use most existing tools for your Continuous Integration / Continuous Deployment (CI/CD) pipeline — one of the benefits of using an open system like BigQuery. But, if your organization is new to CI/CD pipelines, this is a great opportunity to gradually gain experience. A good place to start is to read our guide for setting up a CI/CD pipeline for your data-processing workflow.
When it comes to access and security, most end-users will only have access to the final version of the BigQuery views. While row and column-level security can be applied, as in the SAP source system, separation of concerns can be taken to the next level by splitting your data across different Google Cloud projects and BigQuery datasets. While it’s easy to replicate data and structures across your datasets, it’s a good idea to define the requirements and naming conventions early in the design process so you set it up properly from the start.
Start driving faster and more insightful analytics
The best piece of advice we can give you is this: Try it yourself. Anyone with SQL knowledge can get started using the free BigQuery tier. New customers get $300 in free credits to spend on Google Cloud during the first 90 days. All customers get 10 GB storage and up to 1 TB queries/month, completely free of charge. In addition to discovering the massive processing capabilities, embedded machine learning, multiple integration tools, and cost benefits, you’ll soon discover how BigQuery can simplify your analytics tasks.
If you need additional assistance, our Google Cloud Professional Services Organization (PSO) and Customer Engineers will be happy to help show you the best path forward for your organization. For anything else, contact us at cloud.google.com/contact.
4530
Of your peers have already watched this video.
1:30 Minutes
The most insightful time you'll spend today!
AI-powered Cameras Help You Serve Your Pets Better. Learn How
Watch the video to learn how you can leverage Google Cloud platform and AI functions to build pet-detection cameras that can capture and send image-based alert messages on your phone to notify when your pets arrive or leave.
Fairygoodboss and Google Cloud Tied to Advancing Diversity and Female Leadership at Workplaces

5116
Of your peers have already read this article.
2:00 Minutes
The most insightful time you'll spend today!
May is Asian American Pacific Islander Heritage Month — a time for us to come together to celebrate and remember the important people and history of Asian and Pacific Island heritage. This feature highlights founder Georgene Huang and how her startup Fairygodboss uses easy to use Google Cloud tools to grow and innovate.
Coming from a male-dominated industry like Wall Street, I never thought much about my gender. I was so focused on work that I didn’t feel like I could focus on my identity as a woman of color. That all changed when I found myself thrust into the job market while two months pregnant.
Traditionally, job-seeking sites are built by – and geared towards – men and their professional needs. There was no recruiting site that broke down what candidates who identify as women might expect from a company, let alone women of color like myself. I founded Fairygodboss to create a space where women can crowdsource information about opportunities and employers in order to make informed career decisions.
Fairygodboss
Fair•y•god•boss (noun): A person who elevates women at work.
Fairygodboss is the largest career community for women. In researching potential employers, I had many questions surrounding company culture, maternity leave, and women in leadership positions. While sites like Glassdoor provide high-level details for job seekers, I wanted more concrete examples and data than general salary information and anecdotes about work-life balance.
Fairygodboss began as a job review site geared towards women, but has expanded significantly since our initial launch. In addition to providing free resources like career connections, job listings, virtual recruiting events, community advice, and real research on how companies treat women, we also proactively help companies improve gender diversity. Fairygodboss partners with hundreds of top employers to create a 360-degree recruiting and employer branding program designed to drive female applicants to job postings by showcasing a company’s track record of women in leadership within a company, and their diversity investments.

Google Cloud + Fairygodboss: Data defined
At our core, Fairygodboss is a data-driven company, and we rely on Google Cloud to help us process, store, and analyze user-driven events occurring on the site. As a highly scalable, serverless, and cost-effective data warehousing solution, BigQuery collect millions of events each day, helping us identify where traffic is coming from (and where it goes next), and it produces actionable insights to provide better recommendations, information, and opportunities for women visiting our platform.
After seamlessly connecting our BigQuery data to Data Studio, we have been able to visualize and make sense of all the data we receive on our platform. Unlike some other data visualization tools, Data Studio allows us to analyze data in real time. With tools like BigQuery, we are now able to identify trends and gain a deep understanding for how our users interact with our site.
Google for Startups Accelerator: Women Founders
In order to provide more accurate job recommendations for our users, the Fairygodboss team wanted to build a machine learning prototype to classify our users and jobs into categories to facilitate more effective matching. So we applied for the Google for Startups Accelerator: Women Founders, a three-month digital accelerator program for high-potential Seed to Series A tech startups based in the U.S. and Canada. Along with tailored mentorship and product support from Googlers and industry experts, the Google for Startups Accelerator provided $100K in Google Cloud credits to scale our businesses. The mentorship we received from the Google Cloud technical experts as part of the Accelerator – special shout out to Peter Novig! – empowered us to integrate Cloud AutoML into our systems and ultimately curate more accurate job suggestions for our users.
Not only did the Google for Startups Accelerator program help to achieve our business goals for the year, it was also extremely beneficial to be connected with a cohort of other women founders of color. While we are all building different kinds of businesses across different industries, the guidance around fundraising, scaling teams, and coping with the struggles of being a founder rang true for all of us.
Advancing the community
It can be daunting to launch your own business – and even more so as an AAPI woman. Throughout my career, I am certain I have experienced unconscious bias around my race. Specifically, there have likely been “model minority” stereotypes about my demeanor and math abilities, assumptions that I may be mild-mannered or agreeable. While frustrating, these unfair tropes actually inspired me to see myself beyond others’ perceptions. Why be either analytical or creative, meek or brash, inspiring or agreeable? It’s the ors of life that prevent us from seeing ourselves as truly multi-dimensional individuals. I aspired to be more instead of or, and want my company to be as well.
As an inclusion-focused business, it is extremely important that Fairygodboss mindfully engage with all underrepresented groups. Diversity can be sliced in many different ways, and these intersections lead to great opportunities for change. We have a team of volunteer ‘culture wizards’ at work that provide educational resources and videos for those wanting to learn more about different cultures and identities from members of under-represented groups. We also practice what we preach at Fairygodboss by prioritizing diverse slates and diversity in our own hiring process. We aim for the talent we hire to be representative of the diverse communities we support. It is imperative to take an intentional approach to hiring diverse talent, as it falls on all employers to promote equity and inclusion—there are always ways in which we can all improve. Fairygodboss looks forward to evolving with Google Cloud in 2021 and beyond as we work together to foster inclusive teams around the world.
If you want to learn more about how Google Cloud can help your startup, visit our Startup Program application page here and sign up for our monthly startup newsletter to get a peek at our community activities, digital events, special offers, and more.
More Relevant Stories for Your Company

Google Cloud’s Recommendation AI Helps Bazaarvoice with 60 Percent increase in CTR
Not long ago, building AI into recommendation engines was a daunting, expensive task that could take years to get off the ground. But as Bazaarvoice has shown, with the help of cloud services, the time from AI investment to business outcomes is shorter than ever. Bazaarvoice is the leading provider

Google Dataflow Named Leader in The 2021 Forrester Wave™: Streaming Analytics
We are excited to announce that Google has been named a Leader in The Forrester Wave™: Streaming Analytics, Q2 2021 report. Thank you to our strong community of customers and partners for working with us to deliver a customer focused product. We believe Forrester’s recognition is an acknowledgement of our leadership

Best Practices for ML Engineering: 43 Rules from the World’s Best
To make great products: do machine learning like the great engineer you are, not like the great machine learning expert you aren’t. Most of the problems you will face are, in fact, engineering problems. Even with all the resources of a great machine learning expert, most of the gains come



Hospitals Can Offer Interconnected Patient Experiences Using Google’s Natural Language Services
Machine Learning (ML) in healthcare helps extract data from conversations, medical records, forms, research reports, insurance claims and other documents across the care value-chain to help care providers have a holistic view of their patients to draw insights for diagnoses and treatments. With Natural Language Processing(NLP), healthcare organizations can program
