





Blue Apron: Offering a better recipe for modern analytics

1656
Of your peers have already read this article.
5:30 Minutes
The most insightful time you'll spend today!
When Blue Apron had issues running its data warehouse on another cloud provider, it built an analytics platform using Looker and Google BigQuery to enable faster business decisions about food inventory.
Blue Apron’s mission is to make incredible home cooking accessible to everyone. Launched in 2012, Blue Apron is reimagining the way that food is produced, distributed, and consumed.

Google Cloud Results
- Enables near real-time business decisions to better manage food inventory and delivery by reducing query times exponentially
- Helps improve customer service and optimize business processes with faster insights
- Reduces costs while reclaiming up to a week per month of engineering
The popularity of meal kit delivery services has surged in recent years as consumer attitudes toward home cooking and grocery shopping have shifted. As a pioneer in the category, Blue Apron helps its customers create incredible home cooking experiences by sending culinary-driven recipes with high-quality ingredients and step-by-step instructions straight to customers’ doors. Blue Apron also offers a monthly wine subscription service and a la carte culinary tools and products through its marketplace.
If that sounds simple, it isn’t. Ingredients for the meal kits must be sourced at the right time, quality, and price. Orders must be packed efficiently and in exactly the right proportions. Most importantly, meal kits must be delivered to the customer fresh and on time.
To meet these criteria and make data meaningful and intuitive to its managers, one of the tools Blue Apron relies on is Looker, an analytics platform that lets business users explore data and ask sophisticated questions using familiar terms.
A Google Cloud partner and winner of the 2016 Google Cloud Global Partner Award for Solution Innovation, Looker integrates its solution with Google Cloud Platform to help customers modernize their analytics.
Blue Apron previously used Looker with a single database instance hosted on another cloud provider. As data volumes grew and queries became more complex, it became difficult to scale. Blue Apron’s only options were choosing ever-larger server classes and increasing storage throughput by purchasing a higher number of provisioned IOPS. To improve speed, scalability, and cost efficiency, Blue Apron moved its data warehouse to Google BigQuery.
“The combination of Looker and Google BigQuery is powerful, allowing us to get data-hungry analysts essential information much faster,” says Sam Chase, Tech Lead, Data Operations at Blue Apron. “Because we choose to pay by the query, it’s also flexible and cost effective—plus storage is cheap, so we can just put data in and query what we need.”
The analytics platform of the future
When you’re making business decisions about a customer’s dinner, speed matters. Looker takes full advantage of the power of Google BigQuery, making it easy to build a data exploration platform. Blue Apron’s applications publish event data to Kafka—approximately 140 million events per day—and data is then streamed into Google BigQuery, which performs lightning-fast queries on both streamed and static data. Now, business users and analytics teams can make decisions based on near real-time information in Looker, instead of waiting until the next business day for results.
“After we moved to Google BigQuery, query time was reduced exponentially. It’s an astonishing difference, allowing us to run 300 queries per day,” says Sam.
Previously, Blue Apron spent up to a week out of every month optimizing its data warehouse to attempt to improve query performance. With Google BigQuery, all maintenance is handled by Google, reclaiming 25% of up to two engineers’ time. Even when multiple people are using Looker concurrently, query performance never degrades and storage never runs out.
“Because Google BigQuery is architected as a giant, shared cluster, growth is smooth,” says Lloyd Tabb, Founder and CTO of Looker. “Like a race car going from 0 to 120 mph, there are no shift points, just smooth acceleration. To us, it looks like the future.”
An empowering, integrated toolset
Looker takes advantage of aggressive caching and support for date-based table partitioning in Google BigQuery to increase performance, simplify the load process, and improve data manageability. By partitioning data by time, Blue Apron can also take advantage of better long-term storage pricing without sacrificing query performance. When using Google BigQuery with Looker, analysts can easily see how much data is going to be scanned before each query is run.
Blue Apron is also using Looker for Google BigQuery Data Transfer Service to provide actionable analytics for all of the company’s Google marketing data from Google AdWords and DoubleClick by Google in one place to understand campaign performance across channels, saving its data operations team months of work. Using Looker Blocks, marketers can quickly make sense of the data with reports and dashboards, and set alerts when campaign performance hits certain thresholds.
Looker Blocks for Google AdWords and DoubleClick by Google provide all the analysis you’d get straight from the Google console, plus additional value-add analysis that’s impossible to replicate without SQL. Complex metrics such as ROI on ad spend, flexible multi-touch attribution, and predictive lifetime value empower marketers with a better understanding of their customers and where to spend their next dollar.
In addition to these turnkey dashboards and pieces of analysis, marketers can customize views to meet their unique needs and workflows. These capabilities help the Blue Apron marketing team make decisions regarding the allocation of spend to maximize customer acquisition and retention.
“Everyone at Blue Apron is excited about using Google BigQuery with Looker,” says Sam. “Business users and marketers are more empowered to look for answers, instead of waiting for analytics teams. Because users know they can get results rapidly, our business processes are evolving and improving.”
For data cleansing and transformation, Blue Apron uses Google Cloud Dataproc to run fully managed Apache Spark clusters on Google Cloud Platform. It’s also leveraging Google BigQuery integration with Google Workspace to bring data into Google Sheets for further distribution and analysis.
“Transferring data between Google tools is fast because it all happens on the Google network,” says Sam. “We can pull data from Google BigQuery, run transformations with Spark, and then write it back to Google BigQuery. That’s very helpful in providing our business users and data analysts with the richest, most current data.”
A perfect match for better insights
As Blue Apron seeks to expand its reach and deepen its engagement with customers, it is making Google BigQuery and Looker available to more users, providing a high-quality interactive analytics experience. “Our ability to pull a lot of data in and compute fast results affects everyone in our company,” says Sam. “Using Google BigQuery and Looker to iterate quickly and build new models to make our operations more efficient will directly impact our customers.”
For Looker, Google BigQuery represents the next step in data warehouse evolution. “Google BigQuery is a perfect match for Looker, combining easy setup with near infinite scale-out and elasticity,” says Lloyd. “People can make smarter decisions faster that directly benefit their business and customers.”
The Query Execution Graph: Your Key to Better BigQuery Analytics

3098
Of your peers have already read this article.
2:30 Minutes
The most insightful time you'll spend today!
BigQuery offers strong query performance, but it is also a complex distributed system with many internal and external factors that can affect query speed. When your queries are running slower than expected or are slower than prior runs, understanding what happened can be a challenge.
The query execution graph provides an intuitive interface for inspecting query execution details. By using it, you can review the query plan information in graphical format for any query, whether running or completed.
You can also use the query execution graph to get performance insights for queries. Performance insights provide best-effort suggestions to help you improve query performance. Since query performance is multi-faceted, performance insights might only provide a partial picture of the overall query performance.
Execution graph
When BigQuery executes a query job, it converts the declarative SQL statement into a graph of execution, broken up into a series of query stages, which themselves are composed of more granular sets of execution steps. The query execution graph provides a visual representation of the execution stages and shows the corresponding metrics. Not all stages are made equal. Some are more expensive and time consuming than others. The execution graph provides toggles for highlighting critical stages, which makes it easier to spot the potential performance bottlenecks in the query.
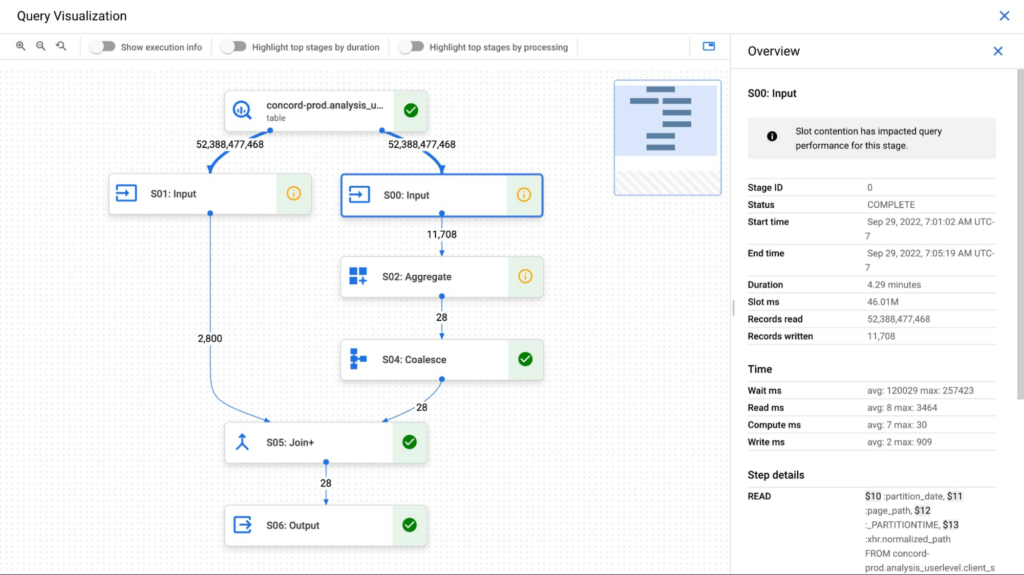
Query performance insights
In addition to the detailed execution graph BigQuery also provides specific insights on possible factors that might be slowing query performance.
Slot contention
When you run a query, BigQuery attempts to break up the work needed by your query into tasks. A task is a single slice of data that is input into and output from a stage. A single slot picks up a task and executes that slice of data for the stage. Ideally, BigQuery slots execute tasks in parallel to achieve high performance. Slot contention occurs when your query has many tasks ready for slots to start executing, but BigQuery can’t get enough available slots to execute them.
Insufficient shuffle quota
Before running your query, BigQuery breaks up your query’s logic into stages. BigQuery slots execute the tasks for each stage. When a slot completes the execution of a stage’s tasks, it stores the intermediate results in shuffle. Subsequent stages in your query read data from shuffle to continue your query’s execution. Insufficient shuffle quota occurs when you have more data that needs to get written to shuffle than you have shuffle capacity.
Data input scale change
Getting this performance insight indicates that your query is reading at least 50% more data for a given input table than the last time you ran the query and hence experiencing query slowness. You can use table change history to see if the size of any of the tables used in the query has recently increased.
What’s next?
We continue to work on improving the visualization of the graph. We are working on adding additional metrics to each step and adding more performance insights that will make query diagnosis significantly easier. We are just getting started.
3043
Of your peers have already watched this video.
24:00 Minutes
The most insightful time you'll spend today!
How to Modernize Your Data infrastructure and Analytics: Case Study
Data modernization is key to digital transformation. Legacy systems are slow, expensive and cannot keep up with changing requirements. Data teams often spend more time on data pipelines than they do on data analysis or data science.
in this video, Harish Ramachandraiah, Director Eng. & Analytics, Sunrun, speaks with Joel Mckelvey, Product Marketing Manager, Google Cloud. They discuss how Sunrun leveraged Looker and BigQuery to reduce the complexity of legacy extract-transform-load processes, improve database performance, and adapt quickly to changes in data.
Now Sunrun makes data accessible where it’s needed, in near-real time.
Mckelvey shows how a modern data stack helps companies simplify the data pipeline, consolidate vital data, and accelerate analytics performance while improving agility, efficiency, and data governance.
How TeamSnap Improved Return on Ad Spend Significantly

5623
Of your peers have already read this article.
3:30 Minutes
The most insightful time you'll spend today!
Anyone who has ever coached or played on a sports team, or had a child involved in sports, knows how difficult scheduling and logistics can be. From game and practice schedules, to uniforms and who’s bringing the snacks, it can be a lot for coaches, administrators, parents, and players to manage.
It’s no wonder that TeamSnap, a sports team, club, and tournament management app, has exploded in popularity worldwide. By syncing events to everyone’s personal calendars and providing messaging and payment tracking, TeamSnap makes communication and organization easy.
TeamSnap markets its app to coaches, players, and clubs via targeted YouTube ads. It also uses Google AdWords and DoubleClick to advertise on search results and run programmatic campaigns. These methods have been highly effective, helping TeamSnap grow to millions of users worldwide and become one of the most popular apps in the iOS app store.
As its business and data grew, TeamSnap was challenged to track ROI and measure the customer journey across channels and devices over time. The company’s marketing budget grew quickly, making it even more important to spend wisely. With data in Google Analytics 360, DoubleClick Campaign Manager, Google AdWords, and Salesforce, TeamSnap needed a way to link and correlate those data sources in a scalable, timely, and cost-effective way to understand the true impact of its digital marketing across websites and mobile apps.
To avoid the painstaking manual process of pulling data from multiple sources, TeamSnap began using Google Analytics 360, which integrates with Google BigQuery, to provide a fully managed big data analysis service. TeamSnap analyzes the data using Tableau, which connects directly to Google BigQuery for fast analytics and helps the company share and collaborate on that information with self-service ease.
The combination allows TeamSnap to easily track the activity of millions of users with self-service ease, without worrying about the scalability or availability of the big data platform.
“Before Google Analytics 360, Google BigQuery, and Tableau, tracking our return on ad spend was difficult because we had so much data,” says Ken McDonald, Chief Growth Officer at TeamSnap. “We didn’t always have insights to make the best choices. We don’t have that problem anymore because we’ve moved to real-time reporting. We find additional revenue growth opportunities almost daily.”
Making Ad Dollars Work Harder
TeamSnap now automatically imports unsampled Google Analytics 360 logs into the Google BigQuery data warehouse. To import data from other sources such as Google AdWords, DoubleClick, and YouTube, TeamSnap uses Google BigQuery Data Transfer Service. With all relevant data consolidated in Google BigQuery, TeamSnap can use Tableau to perform advanced analytics on its digital marketing, executing ad-hoc analyses in seconds, while eliminating data sampling issues, to improve accuracy. These analyses can also be reused and shared with internal and external stakeholders via Tableau Online, promoting governed reuse and consistency.
“Using Google Analytics 360 and Google BigQuery with Tableau to track our return on ad spend is ideal,” says Ken. “It’s easy to use SQL to query the data or explore it with drag-and-drop ease.”
With Google BigQuery, Ken and his team can bring all the data from the TeamSnap billing systems, internal CRM, and other Google services into one straightforward dataset that everyone uses. With Tableau, users are able to perform self-service analytics on this data and provision analyses via shared dashboards that communicate the same consistent truth across the company. These dashboards provide a single view of the business to discover new patterns and questions worth analyzing.
All of this results in enormous time savings because no one is re-inventing the wheel. “Using these tools, we immediately reallocated $300,000 of ad spend that was performing poorly, generating 200% ROI in the first two days,” says Ken.
Ken now spends his time analyzing data instead of trying to pull it all together, identifying pockets of inefficient spend in real time and reallocating those marketing dollars toward better performing campaigns.
“Before, we could only focus on the largest campaign-level datasets because it was so time consuming to pull the data,” he says. “With Google BigQuery and Tableau, we can examine our advertising ROI much more granularly and reallocate more than $10 million in ad spend annually to grow the company faster and more efficiently.”
More Effective A/B Testing
To make sure it is delivering the best customer experiences, TeamSnap uses Google Optimize to run A/B tests on its website. It uses Google BigQuery and Tableau to verify and supplement these findings by measuring longer-term customer behavior across devices, spanning both web and mobile apps.
By pulling in data from Google Optimize, Google Analytics 360, Salesforce, and in-house billing and CRM systems, and understanding it with Tableau, TeamSnap has increased the accuracy and effectiveness of its A/B testing, gaining a more complete picture of customer onboarding and activity. In some cases, it found that short-term indicators it previously trusted were actually poor predictors of long-term behavior.
“Integration between Google Analytics 360 and Google BigQuery is seamless, giving us much more confidence in our A/B testing,” says Ken. “We’re constantly finding new and interesting ways to use our digital marketing data. Often, making a simple change can increase revenue by hundreds of thousands of dollars a year.”
Improving Product Quality
TeamSnap also uses Google BigQuery and Tableau to improve its own product, tracking customer activity at such a granular level that usability and functionality issues can be exposed and addressed faster. It’s also increasing customer engagement by verifying that potential customers are coming in through the right onboarding path—for example, a coach versus a player, or a consumer versus a club or other sports business. Using A/B testing to make sure customers are routed to the appropriate flow, TeamSnap drove $4 million in additional customer value each year.
“We initially chose Google BigQuery and Tableau to help with marketing, but we realized quickly that they could help us on the product side as well,” says Ken. “Most of the testing we do is about making things better and easier for our customers, and we’re accelerating that process with Google BigQuery and Tableau.”
Zeotap Uses Big Data to Enable Personalized, Precision Marketing at Scale

3361
Of your peers have already read this article.
5:30 Minutes
The most insightful time you'll spend today!
Customers today expect brands to know what they want. In fact, Forbes cited that 71% of customers feel frustrated when the shopping experience is impersonal. From interests to purchase habits, companies need to target customers effectively in order to stand out from the plethora of competitors in the online marketplace.
“Our mission is to help brands engage customers with the most appropriate marketing messages at the right place and at the right time while respecting consumer privacy and ensuring regulatory compliance. The experience of Google Cloud in working with large-scale datasets makes the platform an excellent fit for us.”
—Projjol Banerjea, co-founder and Chief Product Officer, Zeotap
Leveraging first-, second-, and third-party data, Zeotap’s Customer Intelligence Platform (CIP)—a CDP with additional identity resolution and third-party data enrichment capabilities—allows brands to engage with their known and unknown users with tailored marketing messages and next best offers or actions. It also offers out-of-box algorithms for standard marketing use cases such as promoting a specific product that will resonate with audiences and custom algorithms for very niche and specific use cases.
“Our mission is to help brands engage customers with the most appropriate marketing messages at the right place and at the right time while respecting consumer privacy and ensuring regulatory compliance. The experience of Google Cloud in working with large-scale datasets makes the platform an excellent fit for us,” says Projjol Banerjea, co-founder and Chief Product Officer at Zeotap.
“With BigQuery, we are able to operate more efficiently, removing 80% of the operation load that we would otherwise have to manage on a different cloud provider. As a result, we get to build and deliver products faster.”
—Sathish K S, VP Engineering, Zeotap
Improving data processing to deliver products faster
The cloud-native company migrated from its previous provider to Google Cloud in October 2019 because it was attracted to the benefits of BigQuery as a serverless cloud data warehouse. This was a feature that wasn’t available with its previous provider.
Sathish K S, Engineering Vice-President at Zeotap says, “With BigQuery, we are able to operate more efficiently, removing 80% of the operation load that we would otherwise have to manage on a different cloud provider. As a result, we get to build and deliver products faster.” Since coming onboard BigQuery, Zeotap has been able to increase the speed of its product delivery by 40%.
BigQuery also offers a much higher query limit, which is helpful because Zeotap can converge all of its previous operation load across different platforms into one data warehouse without worrying about it being overloaded.
One of the key services Zeotap offers is customer relationship management (CRM) platform integration. Using Dataflow, Zeotap can easily stream first-party data into BigQuery at scale.
The data integration capabilities of Cloud Data Fusion also complements Dataflow to help Zeotap enhance its API offerings. To illustrate, an ecommerce company may use Zeotap’s internal API to understand their customer’s cart and check-out habits and add Zeotap’s extra layer of data intelligence to it, so they can improve their marketing efforts. Cloud Data Fusion enables a seamless flow of real-time data so that the company can deliver the relevant ads or suggest products just before they make a purchase, which increases the likelihood of them buying more.
Zeotap uses Dataproc and Pub/Sub to manage the large flow of data that goes in and out of its database. Because many of its customers are pushing data in real time, Pub/Sub acts as a queuing engine that feeds them into Dataflow. Likewise, the data from Dataflow is also being channeled back smoothly to the customer endpoints using Pub/Sub.
Being able to automate all of its processes benefitted the DevOps team, as they now have time to focus on developing and improving Zeotap’s product offerings instead of spending time and energy on operations.

Managing a full migration seamlessly
Today, all of Zeotap’s data is hosted on Google Cloud. The company began its lift and shift migration in October 2019 and was complete by April 2020. “We have close to 405 data pipelines, and even after the migration, we had to verify the right datasets. We had terabytes of data to move, and despite this, our operations were not affected,” says Aditya Chandra, Vice-President of Infrastructure and Security at Zeotap.
Apart from the BigQuery capabilities, there were other major things Zeotap looked out for in its decision to move to a new cloud provider. The functional parity of Google Cloud was important so that it did not have to rebuild many of its existing structures. Zeotap also didn’t want any drop in performance during and after the move to a new cloud provider. Finally, as a multi-region company, it used to have to spot instance problems and run them on demand, which had cost implications. With the move, it no longer had to face such issues.
“Whatever Spark code that was already running on our existing system had to be lifted and shifted into Dataproc without any library changes because 60% of our codebase is out of there. We’re glad that this was possible,” says Ameya Agnihotri, Chief Technology Officer.
Managing business continuity with a trusted partner
Zeotap now works with Rackspace Technology (Rackspace) as it continues to optimize its infrastructure operations. As a marketing and technology company, Zeotap needs niche expertise to manage big data processing issues.
Ameya Agnihotri shares, “Given its global expertise in dealing with on-premises as well as cloud solutions, Rackspace can really add value because they are better equipped to troubleshoot and handle complex data operations.” Zeotap has plans to explore more of Google Cloud’s artificial intelligence (AI) and machine learning (ML) capabilities, so having a partner in this journey will be valuable to the team.
With so much data on hand, security is paramount to Zeotap. It does a lot of internal security assessments daily. This is one of the areas where the team works with Rackspace to ensure that it adopts best practices and stays on top of the latest updates. With its ability to handle big data operations, Rackspace also acts as an extension of the Zeotap team that supports the infrastructure side of the business.
“The level of engagement from Google Cloud has been excellent, particularly the ability to bring in expertise from different parts of the organization. The personal touch meant we could reach product owners and managers of specific products. This kind of support is what we really value and appreciate.”
—Ameya Agnihotri , Chief Technology Officer, Zeotap
Future plans and collaboration with Google Cloud
Zeotap is currently exploring Cloud Bigtable and API Gateway as it continues to grow the business and explore new types of services to offer to its customers. Although it has a software-as-a-service (SaaS) offering for customers to self-serve, some may prefer to do a server-to-server integration so that they do not have to worry about the back end at all. For this reason, Zeotap is exploring the possibility of integrating these customers’ APIs in the back end of its API, using Google Cloud’s API Gateway features that are available out of the box. The company is also looking forward to the new features being released on BigQuery, as well as exploring more of the alerting and monitoring capabilities of Google Cloud.
“The level of engagement from Google Cloud has been excellent, particularly the ability to bring in expertise from different parts of the organization,” says Ameya. He shares that the team has had many fortnightly calls when there were issues to address, and the Google Cloud team would help to fix the problems. “The personal touch meant we could reach product owners and managers of specific products. This kind of support is what we really value and appreciate.”
With big plans ahead for Zeotap that include becoming a Google Cloud Technology Partner in the near future, Swapnasarit Sahu, Chief Data and Analytics Officer, is confident that the company has chosen the right cloud solution. “We see Google as one of the frontrunners in the space of AI and ML solutions, which can really help data scientists in developing new and more innovative products and solutions, and we look forward to building great products with them,” he says.

Analytics Hub for Secure Data Sharing and Analytics Unlocks True Data Value and Insights

6760
Of your peers have already read this article.
2:30 Minutes
The most insightful time you'll spend today!
Customers tell us that sharing and exchanging data with other organizations is a critical element of their analytics strategy, but it’s hamstrung by unreliable data and processes, and only getting harder with security threats and privacy regulations on the rise.
Furthermore, traditional data sharing techniques use batch data pipelines that are expensive to run, create late arriving data, and can break with any changes to the source data. They also create multiple copies of data, which brings unnecessary costs and can bypass data governance processes. These techniques do not offer features for data monetization, such as managing subscriptions and entitlements. Altogether, these challenges mean that organizations are unable to realize the full potential of transforming their business with shared data.
To address these limitations, we are introducing Analytics Hub, a new fully managed service, available in Q3, in preview, that helps you unlock the value of data sharing, leading to new insights and increased business value. With Analytics Hub you get:
- A rich data ecosystem by publishing and subscribing to analytics-ready datasets.
- Control and monitoring over how your data is being used, because data is shared in one place.
- A self-service way to access valuable and trusted data assets, including data provided by Google. For example, a unique dataset from Google Search Trends will be available, that you can query and combine with your own data.
- An easy way to monetize your data assets without the overhead of building and managing the infrastructure.
Built on a decade of cross-organizational sharing
While Analytics Hub is a new service, it builds on BigQuery, Google’s petabyte-scale, serverless cloud data warehouse. BigQuery’s unique architecture provides separation between compute and storage, enabling data publishers to share data with as many subscribers as you want without having to make multiple copies of your data. With BigQuery, there are no servers to deploy or manage, which means that data consumers get immediate value from shared data. Data can be provided and consumed in real-time using the streaming capabilities of BigQuery and you can leverage the built in machine learning, geospatial, and natural language capabilities of BigQuery or take advantage of the native business intelligence support with tools like Looker, Google Sheets, and Data Studio.
BigQuery has had cross-organizational, in-place data sharing capabilities since it was introduced in 2010. We took a look at usage metrics in BigQuery and found that over a 7 day period in April, we had over 3,000 different organizations sharing over 200 petabytes of data. These numbers don’t include data sharing between departments within the same organization.
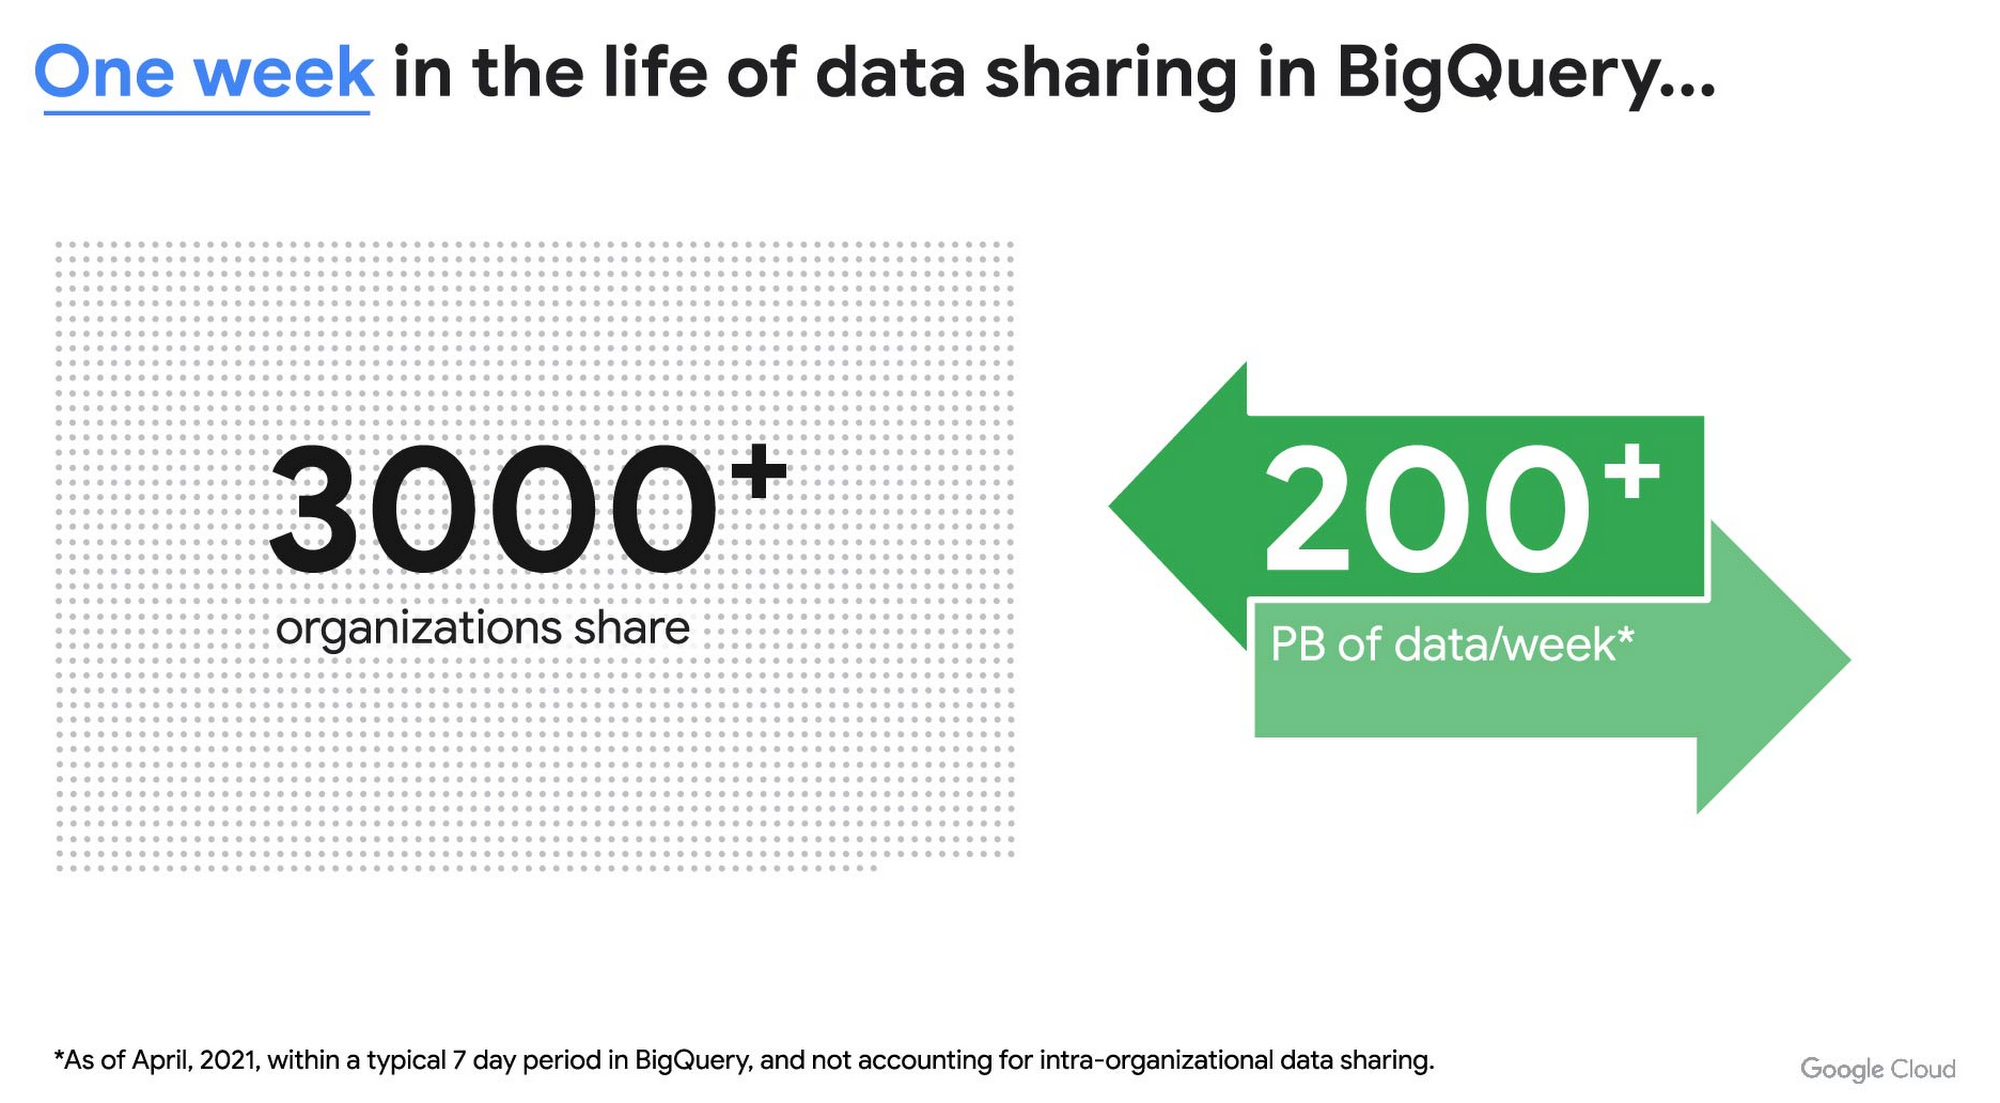
As you can see, data sharing in BigQuery is already popular. But we want to make it easier and even more scalable.
Raising the bar on data sharing
To make data sharing easier and more scalable in BigQuery, Analytics Hub introduces the concepts of shared datasets and exchanges. As a data publisher, you create shared datasets that contain the views of data that you want to deliver to your subscribers. Next, you create exchanges, which are used to organize and secure shared datasets. By default, exchanges are completely private, which means that only the users and groups that you give access to can view or subscribe to the data. You can also create internal exchanges or leverage public exchanges provided by Google. Finally, you publish shared datasets into an exchange to make them available to subscribers.
Data subscribers search through the datasets that are available across all exchanges for which they have access and subscribe to relevant datasets. This creates a linked dataset in their project that they can query and join with their own data. Subscribers pay for the queries that they run against the data while the publisher pays for the storage of the data. Data providers can add new data, new tables, or new columns to the shared dataset and these will be immediately available to subscribers. In addition, the publisher can track subscribers, disable subscriptions, and see aggregated usage information for the shared data.
Analytics Hub makes it easy for you to publish, discover, and subscribe to valuable datasets that you can combine with your own data to derive unique insights. Here are some types of data that will be available through Analytics Hub:
- Public datasets: Easy access to the existing repository of over 200 public datasets, including data about weather and climate, cryptocurrency, healthcare and life sciences, and transportation.
- Google datasets: Unique, freely-available datasets from Google. One example of this is the COVID-19 community mobility dataset. Another example is the forthcoming Google Trends dataset, which will provide the top 25 search terms and top 25 rising search terms over a 5 year window in 210 distinct locations in the US. Trends data can be used by everyone in the organization to gain insights into what customers care about.
- Commercial (paid for) datasets: We are working with leading commercial data providers to bring their data products to Analytics Hub. If you are interested in delivering your data via Analytics Hub, we’re also introducing Data Gravity, an initiative that provides storage benefits and new distribution paths for data published through Analytics Hub.
- Internal datasets: We know that data sharing can be challenging in larger organizations. Analytics Hub can be used for internal data, for example, to share standardized customer demographics with your sales engineering and data science teams.
Customers and partners using Analytics Hub

“Google Search Trends data has always been an important tool for our WPP agency data teams. At WPP we believe that data variety is a superpower which is why we are excited to use the new Trends dataset availability within BigQuery, plus the launch of Analytics Hub. The best creativity in the world is informed by data insights, and influenced by what people search for, so the operational efficiencies we’ll gain via the Analytics Hub and the insights we can drive with Trends data are just phenomenal.”
—Di Mayze Global Head of Data and AI, WPP

“Equifax Ignite is our shared data analytics environment within our Equifax data fabric. We are excited to partner with Google to leverage Analytics Hub and BigQuery to deliver data to over 400 statisticians and data modelers as well as securely sharing data with our partner financial institutions.”
—Kumar Menon, SVP Data Fabric and Decision Science, Equifax

“The flow of data and insights between our teams at Deloitte and our clients is paramount for building truly transformational data cultures. With its purpose-built architecture for secure data exchanges and sharing analytics resources, Google Cloud’s Analytics Hub can help provide significant operational efficiencies for how Deloitte teams support our clients’ data-driven initiatives within their industry ecosystems. It will also help minimize the worries about scale, privacy and security, or the administrative burden associated with each.”
—Navin Warerkar, Managing Director, Deloitte Consulting LLP, and US Google Cloud Data & Analytics GTM Lead

“Crux Informatics is proud to partner with Google to support the launch of Analytics Hub, removing friction for those who need access to analytics-ready data. With thousands of datasets from over 140 sources, Crux Informatics will accelerate access to data on Analytics Hub and together provide a more efficient and cost effective solution to deliver datasets in Google Cloud’s ecosystem.”
—Will Freiberg, CEO, Crux Informatics
Next steps for Analytics Hub
This is just the beginning for Analytics Hub. As we get to preview and general availability, we will be adding additional capabilities, including workflows for publishing and subscribing, publishing analytics assets (Looker Blocks, Data Studio reports, Connected Google Sheets) along with the shared data, the ability for data publishers to specify query restrictions on the usage of their data, and making it easy for data publishers to create sandbox environments for subscribers to work with their data, even if they are not yet on Google Cloud. We will provide features in Analytics Hub for monetization of data, including managing subscriptions, data entitlements, and billing.
Please sign up for the preview, which is scheduled to be available in the third quarter of 2021. In the meantime, you can learn more about BigQuery and how to leverage its built-in data sharing capabilities. Please go to g.co/cloud/analytics-hub to register your interest in Analytics Hub.
More Relevant Stories for Your Company




Haaretz on Google Cloud Guarantees Faster, Reliable & Responsive Services to its Audience
Israeli centenarian newspaper, Haaretz relied on on-prem infrastructure to serve readers digitally. As the need for scalability, security and business intelligence grew alongside their readership, Haaretz was looking for more than just a cloud-based solution to replace their infrastructure. Inon Gershovitz, CTO, Haaretz takes us through the journey of recreating

Largest Beauty Retailer in the US Powers Digital Transformation with Google Cloud Smart Analytics
Digital technology offers increasing flexibility and choice to consumers. As a result, the retail industry is dramatically shifting toward more tailored and personalized experiences for shoppers, and businesses are rethinking how they deliver value to customers. This couldn’t be more true for the beauty retailing industry where leading companies are


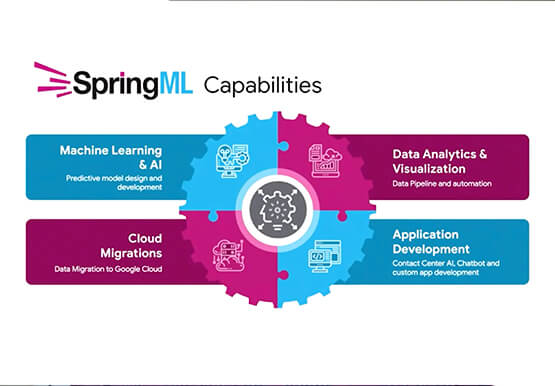
Scaling Data-Driven Insights Across a Complex Global Organization with Looker and BigQuery
In this video, SpringML and Iron Mountain share how migrating data to Google Cloud not only saved hundreds of thousands of dollars in licensing consolidation but allows stakeholders across a complex global organization to: Consolidate 1,200 data management applications into one data lakeUnify information governance practices across disparate corporate verticals

Google Cloud’s Virtual Appointment Scheduling Tool (VAST) Helps State of Arizona Recover from Unemployment Situation
When the world was forced to go primarily online, state governments also faced the reality of needing to provide community services without the health risk of meeting in person. Old systems that relied on interpersonal contact could not keep up. An unprecedented number of displaced workers swamped every unemployment system.
