






4981
Of your peers have already downloaded this article
2:35 Minutes
The most insightful time you'll spend today!
Making Streaming Analytics Simpler and More Cost-Effective With Cloud Dataflow

3892
Of your peers have already read this article.
8:30 Minutes
The most insightful time you'll spend today!
Streaming analytics helps businesses to understand their customers in real time and adjust their offerings and actions to better serve customer needs. It’s an important part of modern data analytics, and can open up possibilities for faster decisions.
For streaming analytics projects to be successful, the tools have to be easy to use, familiar, and cost-effective. Since its launch in 2015, Cloud Dataflow, Google’s fully managed streaming analytics service, has been known for its powerful API available in Java and Python. Businesses have almost unlimited customization capabilities for their streaming pipelines when they use these two languages, but these capabilities come at the cost of needing programming skills that are sometimes hard to find.
To advance Google Cloud’s streaming analytics further, Google Cloud is announcing new features available in the public preview for Cloud Dataflow SQL, as well as the general availability of Cloud Dataflow Flexible Resource Scheduling (FlexRS) for a very cost-effective way of batch processing of events. These new features make streaming analytics easier and more accessible to data engineers, particularly those with database experience.
Here’s more detail about each of these new features:
Cloud Dataflow SQL to create streaming (and batch) pipelines using SQL
We know that SQL is the standard for defining data transformations, and that you want more GUI-based tools for creating pipelines. With that in mind, several months ago we launched a public preview of Cloud Dataflow SQL, an easy way to use SQL queries to develop and run Cloud Dataflow jobs from the BigQuery web UI. Today, we are launching several new features in Cloud Dataflow SQL, including Cloud Storage file support and a visual schema editor.
Cloud Dataflow SQL allows you to join Cloud Pub/Sub streams with BigQuery tables and Cloud Storage files. It also provides several additional features:
- Using Streaming SQL extensions for defining time windows and calculating window-based statistics;
- Integration with Cloud Data Catalog for storing the schema of Cloud Pub/Sub topics and Cloud Storage file sets—a key enabler for using SQL with streaming messages;
- A simple-to-use graphical editor available in the BigQuery web UI. If you are familiar with BigQuery’s SQL editor, you can create Cloud Dataflow SQL jobs.
To switch the BigQuery web UI to Cloud Dataflow SQL editing mode, open the BigQuery web UI, go to More>Query settings and select “Cloud Dataflow” as the query engine.
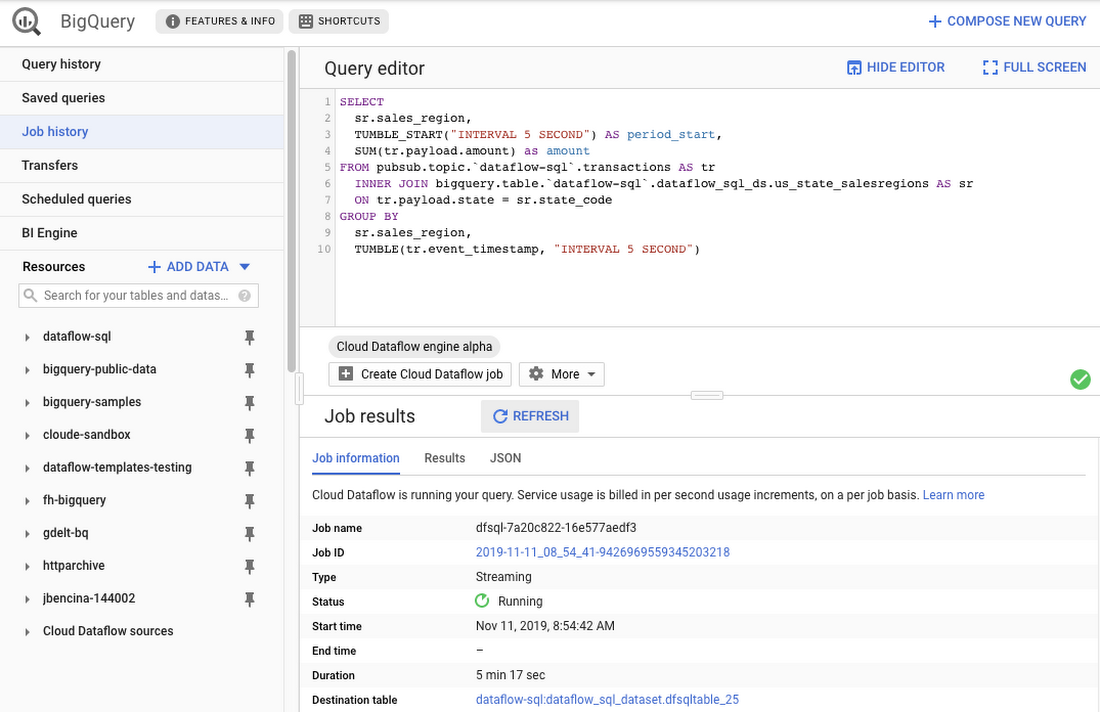
As an example, let’s say you have a Cloud Pub/Sub stream of sales transactions, and you want to build a real-time dashboard for the sales managers of your organization showing them the up-to-date stats of the sales in their regions. You can accomplish this in a few steps: write a SQL statement like the following one, launch a Cloud Dataflow SQL job, direct the output to a BigQuery table, then use one of the many supported dashboarding tools, including Google Sheets, Data Studio, and others, to visualize the results.
SELECTsr.sales_region,TUMBLE_START("INTERVAL 5 SECOND") AS period_start,SUM(tr.payload.amount) as amountFROM pubsub.topic.`dataflow-sql`.transactions AS trINNER JOIN bigquery.table.`dataflow-sql`.dataflow_sql_ds.us_state_salesregions AS srON tr.payload.state = sr.state_codeGROUP BYsr.sales_region,TUMBLE(tr.event_timestamp, "INTERVAL 5 SECOND")
In this example, we are joining the “transactions” Cloud Pub/Sub topic in the “dataflow-sql” project with a metadata table in BigQuery called “us_state_salesregions.” This table contains a mapping between the state codes (present in the “transactions” Cloud Pub/Sub topic) and the sales regions “Region_1”, “Region_2”, .., “Region_N” that are relevant to the sales managers in our example organization. In addition to the join, we’ll do a streaming aggregation of our data, using one of the several windowing functions supported by Cloud Dataflow. In our case, we will use TUMBLE windows, which will divide our stream into fixed five-second time intervals, group all the data in those time windows by the sales_region field, and calculate the sum of sales in the sales region. We also want to preserve the start of each time window, via TUMBLE_START("INTERVAL 5 SECOND"), to plot sales amounts as a time series.
To start a Cloud Dataflow job, click on “Create Cloud Dataflow job” in the BigQuery web UI.
When data starts flowing into the destination table, it will contain three fields: the sales_region, the timestamp of the period start, and the amount of sales.
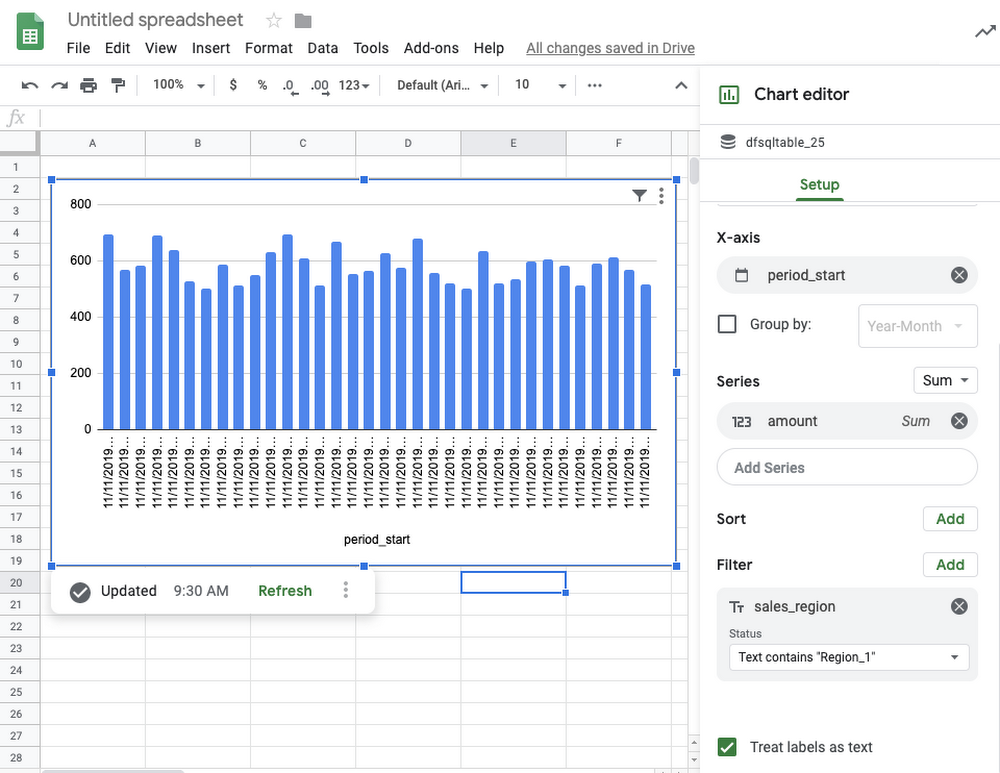
In the next step, we will create a BigQuery Connected Sheet that shows a column chart of sales in “Region_1” over time. Select the destination BigQuery table in the nav tree. In our case, it’s the dfsqltable_25 table.
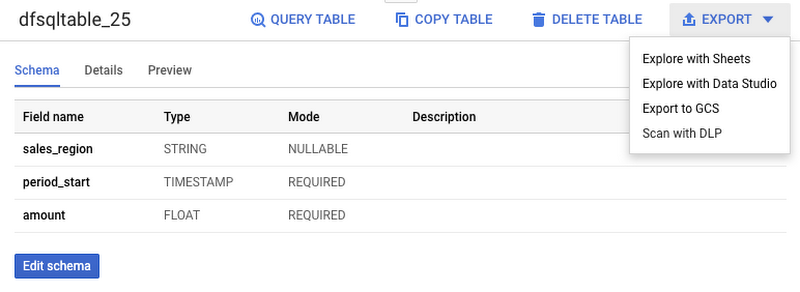
Then, select Export>Explore with Sheets to chart your data. Do it from the tab where your BigQuery table is shown, and not from the tab where your original Cloud Dataflow SQL was. In Sheets, create the column chart using the data connection to BigQuery, and choose period_start for the X-axis, amount as your data series, and add a sales_region filter. This is all you have to do to build a chart in Sheets that visualizes streaming data.
Mixing and joining data in Cloud Pub/Sub and BigQuery helps solve many real-time dashboarding cases, but quite a few customers have also asked for support of their Cloud Storage files to join those files with events in Cloud Pub/Sub or with tables in BigQuery. This is now possible in Dataflow SQL, enabled by our integration with Data Catalog’s Cloud Storage file sets.
In the following example, you’ll see an archive of transactions stored in CSV files in the “transactions_archive” Cloud Storage bucket.
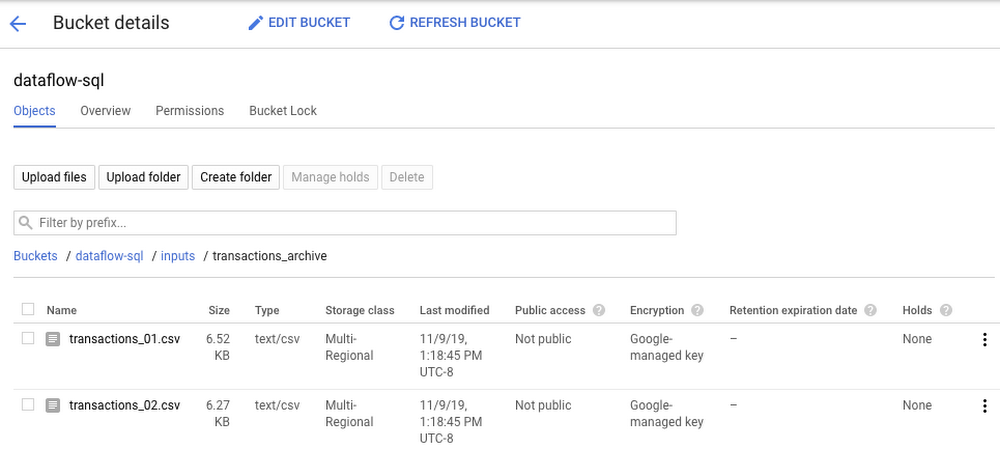
Two gcloud commands can define a Cloud Storage file set and entry group in Data Catalog.
#Create a GCS entrygroupgcloud beta data-catalog entry-groups create transactions_archive_eg --location=us-central1#Create the filesetgcloud beta data-catalog entries create transactions_archive_fs --location=us-central1 --entry-group=transactions_archive_eg --gcs-file-patterns=gs://dataflow-sql/inputs/transactions_archive/*.csv --description="Historical Archive of Transactions"
Notice how we defined the file pattern “gs://dataflow-sql/inputs/transactions_archive/*.csv” as part of the file set entry definition. This pattern is what will allow Cloud Dataflow to find the CSV files once we write the SQL statement that references this file set.
We can even specify the schema of this transactions_archive_fs file set using a GUI editor. For that, go to the BigQuery web UI (make sure it is running in Cloud Dataflow mode), select “Add Data” in the left navigation and choose “Cloud Dataflow sources.” Search for your newly added Cloud Storage file set and add it to your active datasets in the BigQuery UI.
This will allow you to edit the schema of your file set after you select it in the nav tree. The “Edit schema” button is right there on the “Schema” tab. The visual schema editor is new and works for both Cloud Storage file sets as well as for Cloud Pub/Sub topics.
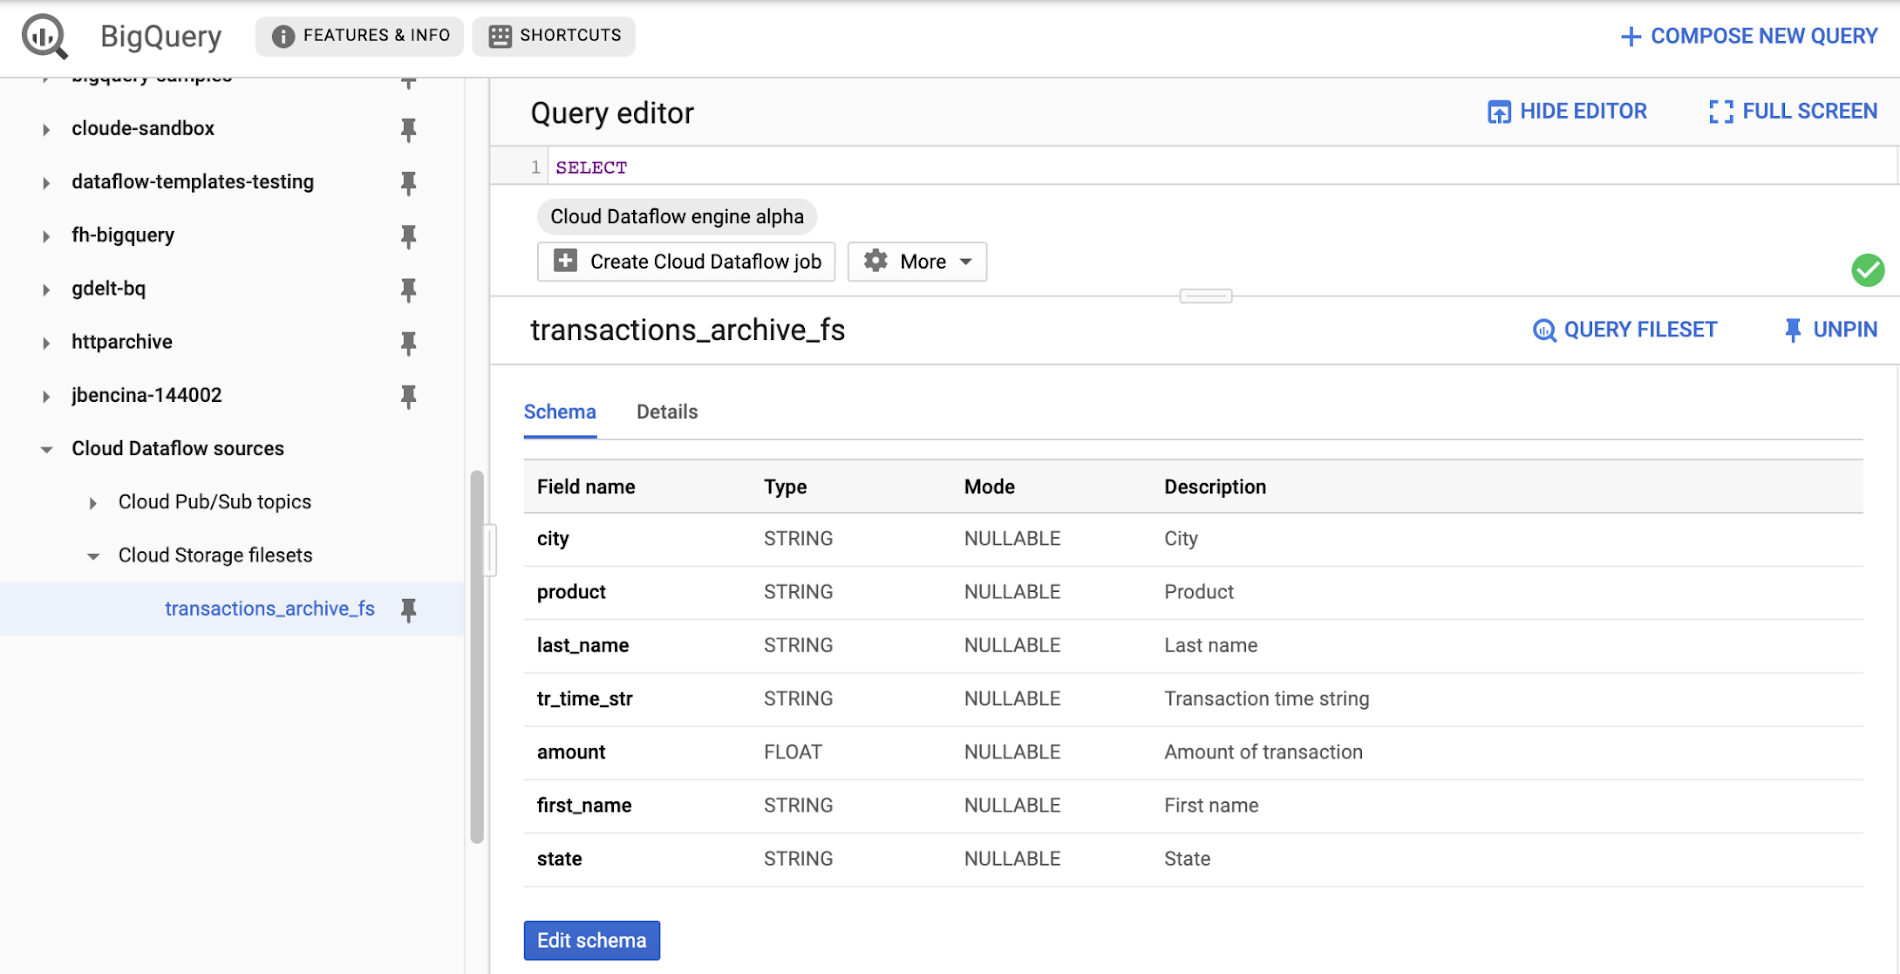
Once you’ve registered the file set in Data Catalog and defined a schema for it, you can query it in Cloud Dataflow SQL. In the next example, we’ll join the transactions archive in Cloud Storage with the metadata mapping table in BigQuery.
SELECTsr.sales_region,TUMBLE_START("INTERVAL 5 SECOND") AS period_start,SUM(tr.amount) as amountFROM datacatalog.entry.`dataflow-sql`.`us-central1`.transactions_archive_eg.transactions_archive_fs AS trINNER JOIN bigquery.table.`dataflow-sql`.dataflow_sql_ds.us_state_salesregions AS srON tr.state = sr.state_codeGROUP BYsr.sales_region,TUMBLE(CAST(tr.tr_time_str AS TIMESTAMP), "INTERVAL 5 SECOND")
Notice how similar this SQL statement is to the one that queries Cloud Pub/Sub. The TUMBLE window function even works on Cloud Storage files, although we will define the windows based on a field “tr_time_str” that is inside the files (the Cloud Pub/Sub SQL statement used the tr.event_timestamp attribute of the Cloud Pub/Sub stream). The only other difference is the reference to the Cloud Storage file set. We accomplish this by specifying datacatalog.entry.`dataflow-sql`.`us-central1`.transactions_archive_eg.transactions_archive_fs AS tr
Because both of the job inputs are bounded (batch) sources, Cloud Dataflow SQL will create a batch job (instead of a streaming job created for the first SQL statement using a Cloud Pub/Sub source) which will join your Cloud Storage files with the BigQuery table, and write the results back to BigQuery.
And now you have both a streaming pipeline feeding your real-time dashboard from a Cloud Pub/Sub topic, as well as a batch pipeline capable of onboarding historical data from CSV files. Check out the SQL Pipelines tutorial to start applying your SQL skills for developing streaming (and batch) Cloud Dataflow pipelines.
FlexRS for cost-effective batch processing of events
While real-time streaming processing is an exciting use case that’s growing rapidly, many streaming practitioners know that every stream processing system needs a sprinkle of batch processing (as you saw in the SQL example). When you bootstrap a streaming pipeline, you usually need to onboard historical data, and this data tends to reside in files stored in Cloud Storage. When streaming events need to be reprocessed due to changes in business logic (i.e., time windows get readjusted, or new fields are added), this reprocessing is also better done in batch mode.
The Apache Beam SDK and the Cloud Dataflow managed service are well-known in the industry for their unified API approach to batch and streaming analytics. The same Cloud Dataflow code can run in either mode with just minimal changes (usually replacing the data source from Cloud Pub/Sub to Cloud Storage). Remember our SQL example, where switching the SQL statement from a streaming source to a batch source was no trouble at all? And while it’s easy to go back and forth between streaming and batch processing in Cloud Dataflow, an important factor influencing the processing choice is cost. Customers who gravitate to batch processing have always looked to find the right balance between the speed of execution and costs. In many cases, that may mean you can be flexible with the amount of time it takes to process a dataset if the overall cost of processing is reduced in a significant fashion.
Our new Cloud Dataflow FlexRS feature reduces batch processing costs by up to 40% using advanced resource scheduling techniques and a mix of different virtual machine (VM) types (including the preemptible VM instances) to decrease processing costs while providing the same job completion guarantees as regular Cloud Dataflow jobs. FlexRS uses the Cloud Dataflow Shuffle service, which allows it to handle the preemption of worker VMs better because the Cloud Dataflow service does not have to redistribute unprocessed data to the remaining workers.
Using FlexRS requires no code changes in your pipeline and can be accomplished by simply specifying the following pipeline parameter:
--flexRSGoal=COST_OPTIMIZED
Running Cloud Dataflow jobs with FlexRS requires autoscaling, a regional endpoint in the intended region, and specific machine types, so you should review the recommendations for other pipeline settings. While Cloud Dataflow SQL does not yet support FlexRS, it will in the future.
Simultaneously with launching FlexRS in general availability, we are also extending its availability to five additional regions, covering all regions now where we have regional endpoints and Cloud Dataflow Shuffle:
- us-central1
- us-east1
- us-west1
- europe-west1
- europe-west4
- asia-east1
- asia-northeast1
To learn more about Cloud Dataflow SQL, check out our tutorial and try creating your SQL pipeline using the BigQuery web UI. Visit our documentation site for additional FlexRS usage and pricing information.
Check out other recently launched streaming and batch processing features:
- We deployed Cloud Dataflow Shuffle and Cloud Dataflow Streaming Engine to three additional regions, bringing total availability to seven regions.
- We launched the ability to protect your pipeline state with customer-managed encryption keys.
Python streaming support from Cloud Dataflow is now generally available.
3805
Of your peers have already watched this video.
8:00 Minutes
The most insightful time you'll spend today!
Target Leverages Google Cloud to Create Market-defining Online Experience
In the hyper-competitive world of online retail sales, ease-of-use and transaction speed can make or break business outcomes. However, a few years ago US Retail giant Target was going through a period of uncertainty.
While the company had over 1800 stores across the US with an estimated 85% of US consumers shopping at a Target store and over 25 million people visiting the Target website or using its app each month, it was still losing ground.
In spite of having millions of loyal customers, the company was dangerously late on digital and its technology wasn’t keeping pace with unstable systems to boot. The company faced the twin challenges of trying to operate today’s business as efficiently as possible and creating tomorrow’s business as quickly as possible. On the one hand it needed productivity and stability and on the other it wanted speed and disruption. Not an easy task to accomplish.
That’s when Target decided to use Google Cloud to solve its challenges. See how Target leveraged Google Cloud to create a market-defining online experience that has made customers happier and more loyal.

8005
Of your peers have already downloaded this article
20:30 Minutes
The most insightful time you'll spend today!
These business and technology innovators are leveraging cloud computing, machine learning, APIs, collaborative platforms, among others to advance healthcare, financial services, retail, media and entertainment, manufacturing, and government.
They include some of the biggest brands in the world, as well as some you’ve probably never heard of. But they all have one thing in common: They are astounding in their idea, scope and execution.
Every story has a short–and a longer–version. Scan through them and choose to dive deeper into stories that reflect challenges that your company or your industry is facing. You’ll find solutions to problems you previously thought impossible to solve.
Data to Business Outcomes with Google’s Data Analytics Design Pattern

6750
Of your peers have already read this article.
1:30 Minutes
The most insightful time you'll spend today!
Companies today are inundated with vast amounts of data from various sources. This overwhelming amount of data is meant to benefit the company, but often leaves data teams feeling overwhelmed, which can create data bottlenecks and result in a slow time to value. In fact, only twenty seven percent of companies agree that data and analytics projects produce insights and recommendations that are highly actionable (Accenture). This means that nearly 3 in 4 companies are not unlocking value in their data, which poses a huge challenge for organizations trying to move the needle and drive real business results. We at Google Cloud, however, saw opportunity in this challenge, which is why we created Data Analytics Design Patterns: cross-product technical solutions designed to accelerate a customer’s path to value realization with their data. These industry solutions bring together product capabilities alongside design methodology, open source deployable code, data models, and reference architectures to accelerate your business outcomes.

With Data Analytics Design Patterns, you get access to more than 30 ready-to-deploy data analytics solutions. Design patterns leverage the best of Google and our rich partner ecosystem, including Technology Partners & System Integrators. In this blog, we will cover 3 examples on how a design pattern can be applied to unlock the value of data:
- Improve mobile app experience with Unified App Analytics
- Maximize digital shop’s revenue with Price Optimization
- Protect internal systems from security and malware threat with Anomaly Detection
Unified App Analytics
If mobile apps are part of your go-to-market strategy, you have several data sources that can provide invaluable customer insights. In addition to tools such as CRM (e.g. Salesforce) and customer care (e.g. Zendesk), you likely use Google Analytics to log app events and Firebase Crashlytics to gather data about app errors. But can you easily combine back-end server data with app front-end data to unlock customer insights?
The Unified App Analytics design pattern makes it easy to plug all the disparate data sources into a single warehouse (BigQuery) and start analyzing it with a Business Intelligence tool (Looker). Once you have a complete and real time view of your customer experience with your app, you can take action. For example, if you notice an increase in app errors, you can quickly combine your Crashlytics data with your CRM data to narrow down the crashes with the highest revenue impact and prioritize their resolution. Further, you can automate your issue resolution workflow by creating a rule for any future crash that impacts a subset of VIP customers.

With the Unified App Analytics design pattern, you’ll gain access to valuable insights about your user experience with your app so you can inform your future app strategy. For example, NPR, an American media company, increased user engagement by showing content that better mapped to listener interests and behaviors.
Price Optimization
In a competitive and hectic global marketplace, strategic pricing matters more than ever, but often projects are consumed by the tedium of standardizing, cleaning, and preparing data—from transactions, inventory, demand, among other sources.
Price Optimization solution allows retailers to build a data driven pricing model. The solution consists of three main components:
- Dataprep by Trifacta: integrates different data sources into a single Common Data Model (CDM). Dataprep is an intelligent data service for visually exploring, cleaning, and preparing structured and unstructured data for analysis, reporting, and machine learning.
- BigQuery: allows you to create and store pricing models in a consistent and scalable way as a serverless Cloud Data Warehouse service
- Looker dashboards: surface insights and enable business teams to take action with enterprise ready BI platform
With the Price Optimization design pattern from Google Cloud and our partner Trifacta, you’ll be able to rapidly unify multiple data sources and create a real-time and ML-powered analysis, leveraging predictive models to estimate future sales. For example, PDPAOLA, an online jewelry company, doubled sales with dynamic pricing adjustments enabled by a single data view.

Anomaly Detection
Organizations need to anticipate and act on risks and opportunities to stay competitive in a digitally transforming society. Anomaly detection helps organizations identify and respond to data points and data trends in high velocity, high volume data sets that deviate from historical standards and expected behaviors, allowing them to take action on changing user needs, mitigate malicious actors and behaviors, and prevent unnecessary costs and monetary losses.
The Anomaly Detection design pattern uses Google Pub/Sub, BigQuery, Dataflow, and Looker to:
- Stream events in real time
- Process the events, extract useful data points, train the detection algorithm of choice
- Apply the detection algorithm in near-real time to the events to detect anomalies
- Update dashboards and/or send alerts
The challenge of finding the important insights and anomalies in vast amounts of data applies to organizations across all industries and lines of business, but is especially important to protecting the security of an organization. For example, TELUS, a national communications company, modernized their security analytics platform leveraging this pattern, allowing them to detect anomalies in near real time to detect and mitigate suspicious activity.
Get started
Turn your data into business outcomes with Google Cloud and our broad partner ecosystem by deploying Data Analytics Design Patterns at your organization. There are more than 30 Data Analytics Design Patterns ready for you to use. We have more than 200+ more ideas in the pipeline, so be sure to check in regularly as new patterns will be added soon.
To dive deeper and find out more about how Data Analytics Design Patterns can help your organization accelerate use cases and create faster time to value, check out this video.
4541
Of your peers have already watched this video.
1:30 Minutes
The most insightful time you'll spend today!
AI-powered Cameras Help You Serve Your Pets Better. Learn How
Watch the video to learn how you can leverage Google Cloud platform and AI functions to build pet-detection cameras that can capture and send image-based alert messages on your phone to notify when your pets arrive or leave.
More Relevant Stories for Your Company

World’s Largest Online-only Grocery Retailer Uses AI to Figure Which Customers Need Most Attention
In the United Kingdom, the popularity of online grocery shopping is expected to surge from about 6% of the market today to 9% by 2021, according to market research firm Mintel. One of the pioneers of online-only grocery retailing is Ocado, based in Hatfield, Hertfordshire in the U.K. Since starting commercial deliveries

Google Cloud and Univision Partnership to Up the Ante in UX for Spanish-speaking Audience
The past year has given everyone lots to think about—about our priorities as people and as businesses. As the world retreated behind closed doors, we saw how shared interests and experiences can bring us together. As the world grappled with a common enemy, we witnessed just how differently individuals, communities

Recommendations for Modelling SAP Data inside BigQuery
Over the past few years, many organizations have experienced the benefits of migrating their SAP solutions to Google Cloud. But this migration can do more than reduce IT maintenance costs and make data more secure. By leveraging BigQuery, SAP customers can complement their SAP investments and gain fresh insights by consolidating enterprise




Quick Demo: How to Push Data to PubSub, Dataflow, and BigQuery to Improve Customer Experience
How can you use big data to raise your business' customer experience levels? It’s a question many organizations ask themselves. Some of the more forward-looking ones already know which data points can be leveraged—they just don’t know how to put together the different pieces of the big data puzzle together.
