





Data to Business Outcomes with Google’s Data Analytics Design Pattern

6725
Of your peers have already read this article.
1:30 Minutes
The most insightful time you'll spend today!
Companies today are inundated with vast amounts of data from various sources. This overwhelming amount of data is meant to benefit the company, but often leaves data teams feeling overwhelmed, which can create data bottlenecks and result in a slow time to value. In fact, only twenty seven percent of companies agree that data and analytics projects produce insights and recommendations that are highly actionable (Accenture). This means that nearly 3 in 4 companies are not unlocking value in their data, which poses a huge challenge for organizations trying to move the needle and drive real business results. We at Google Cloud, however, saw opportunity in this challenge, which is why we created Data Analytics Design Patterns: cross-product technical solutions designed to accelerate a customer’s path to value realization with their data. These industry solutions bring together product capabilities alongside design methodology, open source deployable code, data models, and reference architectures to accelerate your business outcomes.

With Data Analytics Design Patterns, you get access to more than 30 ready-to-deploy data analytics solutions. Design patterns leverage the best of Google and our rich partner ecosystem, including Technology Partners & System Integrators. In this blog, we will cover 3 examples on how a design pattern can be applied to unlock the value of data:
- Improve mobile app experience with Unified App Analytics
- Maximize digital shop’s revenue with Price Optimization
- Protect internal systems from security and malware threat with Anomaly Detection
Unified App Analytics
If mobile apps are part of your go-to-market strategy, you have several data sources that can provide invaluable customer insights. In addition to tools such as CRM (e.g. Salesforce) and customer care (e.g. Zendesk), you likely use Google Analytics to log app events and Firebase Crashlytics to gather data about app errors. But can you easily combine back-end server data with app front-end data to unlock customer insights?
The Unified App Analytics design pattern makes it easy to plug all the disparate data sources into a single warehouse (BigQuery) and start analyzing it with a Business Intelligence tool (Looker). Once you have a complete and real time view of your customer experience with your app, you can take action. For example, if you notice an increase in app errors, you can quickly combine your Crashlytics data with your CRM data to narrow down the crashes with the highest revenue impact and prioritize their resolution. Further, you can automate your issue resolution workflow by creating a rule for any future crash that impacts a subset of VIP customers.

With the Unified App Analytics design pattern, you’ll gain access to valuable insights about your user experience with your app so you can inform your future app strategy. For example, NPR, an American media company, increased user engagement by showing content that better mapped to listener interests and behaviors.
Price Optimization
In a competitive and hectic global marketplace, strategic pricing matters more than ever, but often projects are consumed by the tedium of standardizing, cleaning, and preparing data—from transactions, inventory, demand, among other sources.
Price Optimization solution allows retailers to build a data driven pricing model. The solution consists of three main components:
- Dataprep by Trifacta: integrates different data sources into a single Common Data Model (CDM). Dataprep is an intelligent data service for visually exploring, cleaning, and preparing structured and unstructured data for analysis, reporting, and machine learning.
- BigQuery: allows you to create and store pricing models in a consistent and scalable way as a serverless Cloud Data Warehouse service
- Looker dashboards: surface insights and enable business teams to take action with enterprise ready BI platform
With the Price Optimization design pattern from Google Cloud and our partner Trifacta, you’ll be able to rapidly unify multiple data sources and create a real-time and ML-powered analysis, leveraging predictive models to estimate future sales. For example, PDPAOLA, an online jewelry company, doubled sales with dynamic pricing adjustments enabled by a single data view.

Anomaly Detection
Organizations need to anticipate and act on risks and opportunities to stay competitive in a digitally transforming society. Anomaly detection helps organizations identify and respond to data points and data trends in high velocity, high volume data sets that deviate from historical standards and expected behaviors, allowing them to take action on changing user needs, mitigate malicious actors and behaviors, and prevent unnecessary costs and monetary losses.
The Anomaly Detection design pattern uses Google Pub/Sub, BigQuery, Dataflow, and Looker to:
- Stream events in real time
- Process the events, extract useful data points, train the detection algorithm of choice
- Apply the detection algorithm in near-real time to the events to detect anomalies
- Update dashboards and/or send alerts
The challenge of finding the important insights and anomalies in vast amounts of data applies to organizations across all industries and lines of business, but is especially important to protecting the security of an organization. For example, TELUS, a national communications company, modernized their security analytics platform leveraging this pattern, allowing them to detect anomalies in near real time to detect and mitigate suspicious activity.
Get started
Turn your data into business outcomes with Google Cloud and our broad partner ecosystem by deploying Data Analytics Design Patterns at your organization. There are more than 30 Data Analytics Design Patterns ready for you to use. We have more than 200+ more ideas in the pipeline, so be sure to check in regularly as new patterns will be added soon.
To dive deeper and find out more about how Data Analytics Design Patterns can help your organization accelerate use cases and create faster time to value, check out this video.
3421
Of your peers have already watched this video.
19:30 Minutes
The most insightful time you'll spend today!
Data vs. COVID-19: How public data is helping flatten the curve
The outbreak of COVID-19 has changed the reality of millions of lives around the world. Communities around the world began social distancing, events were cancelled, and healthcare efforts redirected to fight the pandemic.
Hear how public data and the Google Cloud COVID-19 Public Datasets Program is helping combat the pandemic and informing individual decision-making to help everyone make informed decisions about the spread and risks of the virus, and how cooperative efforts could help flatten the curve.
In this presentation, Javier de la Torre, Founder and Chief Strategy Officer of Carto, and Shane Glass, Developer Advocate, Google Cloud demonstrate how the Carto platform is contributing to spatial analysis and understanding for how the outbreak evolved over time as government policies and social distancing measures were put into place.
They also show how to access these public datasets, what is included in the COVID-19 Public Datasets Program, and how you can use these datasets to develop maps and dashboards that will help us continue to combat the pandemic.
3170
Of your peers have already watched this video.
23:00 Minutes
The most insightful time you'll spend today!
Best Practices from Experts to Maximize BigQuery Performance (Featuring Twitter)
If you have made the decision to run your data analytics on BigQuery’s serverless platform, you are in good company.
Now, as you deploy complex workloads on your data, you want to be able to maximize the performance of all data operations from data loading to data analytics.
In this video Jagan Athreya, Product Manager, Google Cloud and Gary Steelman, Senior Software Engineer, Twitter discuss the best practices from speeding up your data ingest into BigQuery to learning the tips and tricks from the BigQuery engineering team to maximize query performance of your data warehouse.
The session is roughly divided into five areas:
- The architecture that enables the performance of BigQuery
- An example of a typical query
- How to write fast and efficient queries
- The best way to ingest data
- Twitter case study

4972
Of your peers have already downloaded this article
2:35 Minutes
The most insightful time you'll spend today!
One of the toughest challenges for data scientists, and big data engineers is gathering, preparing, and transforming data, and creating data pipelines.
Gathering data for a machine learning or big data initiative can be hard work. The mere act of getting it all together can leave data teams so excited that they can overlook critical safeguards. The result? You could have data that’s skewed, or biased, or data sets that are too small to generate accurate models.
This is why it’s important to have a pre-ML data checklist. A pre-machine-learning data checklist will ensure you have the right data sets for your models, thereby improving your chances of success.
Here are some other benefits:
You waste less time: A checklist allows you to save the time you would normally spend trying to work through your own mental checklist.
Fewer errors: A pre-ML data checklist ensures you have don’t overlook obvious mistakes, and have relevant, unbiased, and representative data.
Lower cognitive load: By using a checklist, you remove the burden of unnecessary cognitive load. This enables you to free up the brain power required for more productive tasks such as model selection and tuning.
What Swiggy and You Can Learn From This Company’s Use of ML to Engage Customers

9633
Of your peers have already read this article.
1:45 Minutes
The most insightful time you'll spend today!
The app economy has enabled a huge range of unique business models to flourish. One such model is online food ordering and delivery services, in which apps leverage geo-location data to aggregate local food choices and offer personalized options to consumers.
A leading company in this space is Just Eat. Launched in the UK in 2001 with a vision of ‘serving the world’s greatest menu. Brilliantly.’ The company has capitalized on the popularity of online food delivery and grown its presence across 12 markets.
Just Eat acts as an intermediary between take-out food outlets and hungry customers, giving local restaurants access to a broader base of potential diners, while providing consumers with an easy and secure way to order and pay for food from their favourite restaurants.
Today the company helps 27 million customers find food from more than 112,000 restaurants—everything from homemade Italian pasta, to Chinese noodle bowls, to fish-and-chips.
Data is the fuel of Just Eat’s rapid growth, but it wasn’t always looked at that way. In its early days, Just Eat struggled with the deluge of information and faced fragmentation across its systems. In fact, the company realized its legacy data vendor wasn’t capable of ingesting 90 percent of the data produced by its food platform. This was incredibly frustrating for Just Eat’s analysts and data scientists, who had to waste time cleaning up sources instead of leveraging the data to create a better user experience.
Just Eat turned to Google Cloud, and now uses machine learning (ML) to power sophisticated consumer recommendations on both its app and website. It also makes heavy use of features offered by Google Cloud Platform, including BigQuery for running analytics on its customer data set and Cloud Pub/Sub for messaging app users with relevant offers in real-time.
Having all of Just Eat’s data in one platform has translated into real value for its customers. With Google Cloud tools, Just Eat has created its own proprietary Customer Ontology framework, which today contains 5.5 billion features that better understand consumers’ behavior and food habits, and provides insights into previous visits.
Just Eat recently created an “Adventurous Index” to map its customers according to their ordering habits, enabling them to tailor their marketing and user experiences. For example, mid-adventurous customers are shown a choice of restaurants that serve their most ordered cuisine, while adventurous customers can choose from restaurants that serve a wider variety. This not only has prompted consumers to be more adventurous with their choices, but also has led to more business at a more diverse set of restaurants.
Matt Cresswell, Director of Customer Platforms at Just Eat said that Google Cloud has become integral to its product delivery: “Consumer food choice is a hugely nuanced topic. We know that individuals have their own unique journeys when they use Just Eat. We’ve sought to create a truly one-to-one relationship with every customer. The changes we’ve made to the platform mean they can access the dishes they enjoy at the touch of a fingertip, and find inspiration to discover new dishes they’ll love. We’re grateful to Google Cloud for helping us support our customers on their culinary explorations.”

4887
Of your peers have already downloaded this article
1:30 Minutes
The most insightful time you'll spend today!
Artificial intelligence and machine learning are already transforming the technological landscape. From digital assistants to image-recognition software to self-driving cars, what was once the stuff of science fiction is now becoming a reality. But what exactly does it mean for marketing and advertising executives?
It could get us closer to one of advertising’s most-sought goals: relevance at scale. Before then, we’re going to see changes to the way we do business.
Technological advances have always created new opportunities for storytelling and marketing. Just as the advent of TV brought an era of truly mass advertising and reach, and the internet and mobile brought a new level of targeting and context, AI will change how people interact with information, technology, brands, and services.
A big part of the opportunity for marketers is how AI will help us fully realize personalization—and relevance—at scale. With platforms like Search and YouTube reaching billions of people everyday, digital ad platforms finally can achieve communication at scale. This scale, combined with customization possible through AI, means we’ll soon be able to tailor campaigns to consumer intent in the moment. It will be like having a million planners in your pocket.
Find out how you can achieve relevance at scale. Download now!
More Relevant Stories for Your Company


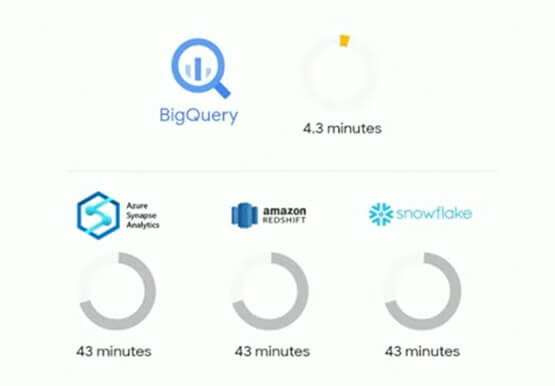

What’s New in BigQuery, Google Cloud’s Modern Data Warehouse
The demands that today's enterprise has from data go far beyond the capabilities of traditional data warehousing. For many leaders, the need to digitally transform their businesses is a key driver for data analytics spending. Businesses want to make real-time decisions from fresh information as well as make predictions from

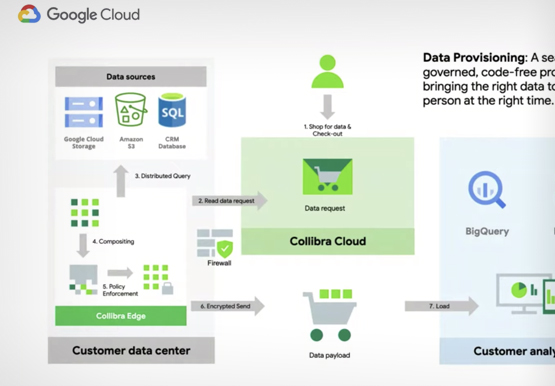
How to Manage Data Governance, at Scale, in a Multi-cloud World
Fears around security, data loss and regulatory compliance are still some of the largest reasons holding back enterprises from embracing the cloud. In a hybrid or multi-cloud paradigm, how do you avoid data access bottlenecks, security blindspots, data leakage, or missed opportunities? Restricting access to data and tightening data security,



Introduction to Cloud Shell Editor
Watch the video to understand how Google's Cloud Shell Editor and its powerful features-packed environment can streamline your development workflows.

How Vertex AI NAS is Suitable for Most Advanced ML Workloads
Vertex AI launched with the premise “one AI platform, every ML tool you need.” Let’s talk about how Vertex AI streamlines modeling universally for a broad range of use cases. The overall purpose of Vertex AI is to simplify modeling so that enterprises can fast track their innovation, accelerate time to market,
