





Case Study: When Database Choice Powers New Revenue-driving Product Features

4170
Of your peers have already read this article.
4:30 Minutes
The most insightful time you'll spend today!
Editor’s note: Streak makes a CRM add-on for Gmail, and recently adopted Cloud Spanner to take advantage of its scalability and SQL capabilities to implement a graph data model. Read on to learn about their decision, what they love about the system, and the ways in which it still needs work.]
Streak is a customer relationship management (CRM) tool built directly into Gmail. It is used for sales, marketing, hiring, and just about anything else you can think of.
We built it because out of the box, email is actually a really crummy team sharing system. By adding a layer of organization on top of email, Streak lets you add email threads directly into its spreadsheet view, making it useful as a workflow tool with capabilities including task creation, email template management, and easy data entry.
Streak has been integrated with G Suite (originally Google Apps For Your Domain) since its inception so when choosing a cloud, it made sense to colocate our server stack with Google Cloud.
Likewise, Streak was on Google App Engine from the start, and we slowly added other GCP services as the offerings improved or as our use cases became more complex.
In addition to App Engine, we use Google Kubernetes Engine to run a bunch of our compute workload, including both application servers and our offline processes like indexers and task queue consumers.
We use Cloud Dataflow for both streaming event processing and logs ETL, and BigQuery for all of our analytics queries. We use Cloud Pub/Sub for interacting with the Gmail watch API, as well as Stackdriver (logging, tracing, monitoring, errors) and OpenCensus to dig into any operational issues as they arise.
Then, on the database front, we recently started using Cloud Spanner, Google Cloud’s scalable relational database service. Before that, we stored most of our business data in Cloud Datastore, Google Cloud’s NoSQL document database.
Partially, that was historical, since Cloud Datastore was GCP’s only managed database when we wrote the Streak backend. And we’ve been very happy with how easy Cloud Datastore is to maintain. Between Google App Engine and Cloud Datastore, we’ve never had to have an explicit infrastructure on-call rotation.
But as more users rely on Streak to collaborate with larger and larger teams, we were feeling the pain of not having a fully relational database. We found ourselves having to manually join data in our application, which increased application latency and increased the time developers spent coding workarounds and debugging that complexity.
We found we needed two things out of our database: a scalable relational store and a graph store that could power next-gen Streak features. At the same time, we wanted a single database that could handle both use cases and wouldn’t increase our operational burden. This meant finding a managed service to give us more query flexibility, so we decided to give Cloud Spanner a try.
Of course, we didn’t want to migrate our existing stack to a new data platform without first testing it out (never a smart strategy). But since most of our existing data model required transactional updates with other entities, pulling out a single entity to test was challenging. We did have a feature in our pipeline that necessitated a graph data store and that was removed from our other data: our email metadata indexing system.
How your client software handles email metadata indexing can make or break the useability of a system. Think about how many times somebody forgets to reply-all or that you receive a forwarded thread with thirty emails in reverse-chronological order. Within our own inboxes, we rely on Gmail’s UI to nicely organize email threads, but that organization breaks down when working with a team or across organizational boundaries.
We decided to fix that in the Streak product by organizing metadata (i.e., headers but not message content) from users’ email by using Cloud Spanner as a graph database. Using a graph database lets us answer questions like “What are all the emails on this thread in the inboxes of everybody on my team?” and “Who on my team has previously talked with the organization that this prospect works at?”
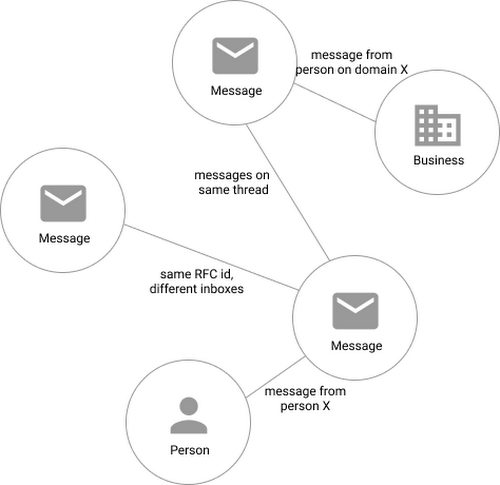
In our model, the nodes of the graph are either an email message, a person (email address) or a company (a domain). Then we have four different types of “edges”— properties by which nodes in a graph connect to one another:
- Message to message (thread): messages that are on the same thread have an edge between them. The reason we do this is because we want to show users a list of threads to answer their questions, not messages, so we need to be able to get the spanning set of messages.
- Message to message (same RFC id): A core value proposition of Streak is being able to see the “unified” version of a thread that shows each person on a team’s version of the email thread. To make sure we are getting each user’s version of a thread when we issue a query, there needs to be an edge between a message in the queryer’s inbox and the same message in their team’s inbox. In case you’re curious, Streak uses the RFC message id to determine that two messages across inboxes are actually the same.
- Email address to message: a message has an edge to an email address if it was either the from, to, cc, or bcc on the message. This edge is crucial for queries that start with: “Show me all threads between this person and our team.”
Domain to message: a message has an edge to a domain if the domain is present in any of the from, to, cc, or bcc addresses on the message. This edge is similarly used for queries that start with “Show me all threads between this company and our team.”
Using Cloud Spanner’s distributed SQL capabilities and scalability to build a graph database also let us answer the important follow-up question: “Which threads have I been granted permission to view?” And while a lot of these questions could be answered per-user by a traditional relational database, scale limitations have to be taken into consideration, especially as we plan for 10x or more data volume growth as both our user base grows and as their inboxes accumulate more emails. A graph database model is simply a better fit for Streak’s collaboration model with many-to-many mappings between users and teams, and will allow us to query the data in any number of configurations, without worrying about scale limitations or having to manually shard a relational database. Cloud Spanner gives us queryability and scalability.
Taking the Cloud Spanner plunge
With so many advantages to it, we went ahead and began building out our metadata system with Cloud Spanner as a back-end.
Adopting Cloud Spanner has been great. Here are some of the high points:
- The fast distributed queries and transactions are absolutely real. We have global indexes across our entire dataset and we haven’t had to spend very much time at all thinking about co-locating data. In particular, we only use interleaved tables for values that would be repeated fields in Cloud Datastore, and that hasn’t been a problem for us yet.
- We haven’t had any reliability problems whatsoever, despite averaging 20K writes/sec in steady state.
- Once we optimized our queries on realistic data, Cloud Spanner scaled up in a surprisingly predictable way. You need to run queries after you’ve populated data, do the explain to figure out how the query planner is executing the query, and add indexes/modify queries to make sure they’re performant.
- Compared to the hoops some traditional relational databases make you jump through, Cloud Spanner’s online schema changes and index builds are magical. There is no downtime for these operations.
Overall, the experience has been encouraging, and we’re planning to move 20 TB of existing data in Cloud Datastore to Cloud Spanner as well. We built out an ORM library for Java on top of Cloud Spanner called Ratchet and are testing a framework for dual-writing entities to both Cloud Datastore and Cloud Spanner to support the rest of the migration. We now store about 40 TB of email metadata in Cloud Spanner, which makes us a large user of Cloud Spanner.
In short, if you’re starting to outgrow your NoSQL database, and want to move to a managed SQL database, give Cloud Spanner a try. You definitely want to model out your costs and try out a proof of concept, both to see how it works on your workload and to get familiar with the quirks of the system. But you don’t need to spend much time worrying about the reliability of the product: it’s there.
Soundtrack Your Brand: Delivering Sound That Stands Out From the Crowd with BigQuery

2845
Of your peers have already read this article.
6:00 Minutes
The most insightful time you'll spend today!
Editor’s note: Soundtrack Your Brand is an award-winning streaming service with the world’s largest licensed music catalog built just for businesses, backed by Spotify. Today, we hear how BigQuery has been a foundational component in helping them transform big data into music.
Soundtrack Your Brand is a music company at its heart, but big data is our soul. Playing the right music at the right time has a huge influence on the emotions a brand inspires, the overall customer experience, and sales. We have a catalog of over 58 million songs and their associated metadata from our music providers and a vast amount of user data that helps us deliver personalized recommendations, curate playlists and stations, and even generate listening schedules. As an example, through our Schedules feature our customers can set up what to play during the week. Taking that one step further, we provide suggestions on what to use in different time slots and recommend entire schedules.
Using BigQuery, we built a data lake to empower our employees to access all this content and metadata in a structured way. Ensuring that our data is easily discoverable and accessible allows us to build any type of analytics or machine learning (ML) use case and run queries reliably and consistently across the complete data set. Today, our users are benefiting from this advanced analytics through the personalized recommendations we offer across our core features: Home, Search, Playlists, Stations, and Schedules.
Fine-tuning developer productivity
The biggest business value that comes from BigQuery is how much it speeds up our development capabilities and allows us to ship features faster. In the past 3 years, we have built more than 150 pipelines and more than 30 new APIs within our ML and data teams that total about 10 people. That is an impressive rate of a new pipeline every week and a new API every month. With everything in BigQuery, it’s easy to simply write SQL and have it be orchestrated within a CI/CD toolchain to automate our data processing pipelines. An in-house tool built as a github template, in many ways very similar to Dataform, helps us build very complex ETL processes in minutes, significantly reducing the time spent on data wrangling.
BigQuery acts as a cornerstone for our entire data ecosystem, a place to anchor all our data and be our single source of truth. This single source of truth has expanded the limits of what we can do with our data. Most of our pipelines start from a data lake, or end at a data lake, increasing re-usability of data and collaboration. For example, one of our interns built an entire churn prediction pipeline in a couple of days on top of existing tables that are produced daily. Nearly a year later, this pipeline is still running without failure largely due to its simplicity. The pipeline is BigQuery queries chained together into a BigQuery ML model running on a schedule with Kubeflow Pipelines.
Once we made BigQuery the anchor for our data operations, we discovered we could apply it to use cases that you might not expect, such as maintaining our configurations or supporting our content management system. For instance, we created a Google Sheet where our music experts are able to correct genre classification mistakes for songs by simply adding a row to a Google Sheet. Instead of hours or days to create a bespoke tool, we were able to set everything up in a few minutes.
BigQuery’s ability to consume Excel spreadsheets allows business users who play key roles in improving our recommendations engine and curating our music, such as our content managers and DJs, to contribute to the data pipeline.
Another example is our use of BigQuery as an index for some of our large Cloud Storage buckets. By using cloud functions to subscribe to read/write events for a bucket, and writing those events to partitioned tables, our pipelines can easily and in a natural way quickly search and access files, such as downloading and processing the audio of new track releases. We also make use of Log Events when a table is added to a dataset to trigger pipelines that process data on demand, such as JSON/CSV files from some of our data providers that are newly imported into BQ. Being the place for all file integration and processing, BQ allows new data to be quickly available to our entire data ecosystem in a timely and cost effective manner while allowing for data retention, ETL, ACL and easy introspection.
BigQuery makes everything simple. We can make a quick partitioned table and run queries that use thousands of CPU hours to sift through a massive volume of data in seconds — and only pay a few dollars for the service. The result? Very quick, cost-effective ETL pipelines.
In addition, centralizing all of our data in BigQuery makes it possible to easily establish connections between pipelines providing developers with a clear understanding of what specific type of data a pipeline will produce. If a developer wants a different outcome, she can copy the github template and change some settings to create a new, independent pipeline.
Another benefit is that developers don’t have to coordinate schedules or sync with each other’s pipelines: they just need to know that a table that is updated daily exists and can be relied on as a data source for an application. Each developer can progress their work independently without worrying about interfering with other developers’ use of the platform.
Making iteration our forte
Out of the box, BigQuery met and exceeded our performance expectations, but ML performance was the area that really took us by surprise. Suddenly, we found ourselves going through millions of rows in a few seconds, where the previous method might have taken an hour. This performance boost ultimately led to us improving our artist clustering workload from more than 24 hours on a job running 100 CPU workers to 10 minutes on a BigQuery pipeline running inference queries in a loop until convergence. This more than 140x performance improvement also came at 3% of the cost.
Currently we have more than 100 Neural Network ML models being trained and run regularly in batch in BQML. This setup has become our favorite method for both fast prototyping and creating production ready models. Not only is it fast and easy to hypertune in BQML, but our benchmarks show comparable performance metrics to using our own Tensorflow code. We now use Tensorflow sparingly. Differences in input data can have an even greater impact on the experience of the end user than individual tweaks to the models.
BigQuery’s performance makes it easy to iterate with the domain experts who help shape our recommendations engine or who are concerned about churn, as we are able to show them the outcome on our recommendations from changes to input data in real-time. One of our favorite things to do is to build a Data Studio report that has the ML.predict query as part of its data source query. This report shows examples of good/bad predictions in the report along with bias/variance summaries and a series of drop-downs, thresholds and toggles to control the input features and the output threshold. We give that report to our team of domain experts to help manually tune the models, putting the model tuning right in the hands of the domain experts. Having humans in the loop has become trivial for our team. In addition to fast iteration, the BigQuery ML approach is also very low maintenance. You don’t need to write a lot of Python or Scala code or maintain and update multiple frameworks—everything can be written as SQL queries run against the data store.
Helping brands to beat the band—and the competition
BigQuery has allowed us to establish a single source of truth for our company that our developers and domain experts can build on to create new and innovative applications that help our customers find the sound that fits their brand.
Instead of cobbling together data from arbitrary sources, our developers now always start with a data set from BigQuery and build forward. This guarantees the stability of our data pipeline and makes it possible to build outward into new applications with confidence. Moreover, the performance of BigQuery means domain experts can interact with the analytics and applications that developers create more easily and see the results of their recommended improvements to ML models or data inputs quickly. This rapid iteration drives better business results, keeps our developers and domain experts aligned, and ensures Soundtrack Your Brand keeps delivering sound that stands out from the crowd.
Updating Twitter’s Ad Engagement Analytics Platform for the Modern Age

3108
Of your peers have already read this article.
3:30 Minutes
The most insightful time you'll spend today!
As part of the daily business operations on its advertising platform, Twitter serves billions of ad engagement events, each of which potentially affects hundreds of downstream aggregate metrics. To enable its advertisers to measure user engagement and track ad campaign efficiency, Twitter offers a variety of analytics tools, APIs, and dashboards that can aggregate millions of metrics per second in near-real time.
In this post, you’ll get details on how the Twitter Revenue Data Platform engineering team, led by Steve Niemitz, migrated their on-prem architecture to Google Cloud to boost the reliability and accuracy of Twitter’s ad analytics platform.
Deciding to migrate
Over the past decade, Twitter has developed powerful data transformation pipelines to handle the load of its ever-growing user base worldwide. The first deployments for those pipelines were initially all running in Twitter’s own data centers. The input data streamed from various sources into Hadoop Distributed File System (HDFS) as LZO-compressed Thrift files in an Elephant Bird container format. The data was then processed and aggregated in batches by Scalding data transformation pipelines. Then, aggregation results were output into Manhattan, Twitter’s homegrown distributed key-value store, for serving. Additionally, a streaming system using Twitter’s homegrown systems Eventbus (a messaging tool built on top of DistributedLog), Heron (a stream processing engine), and Nighthawk (a sharded Redis deployment) powered the real-time analytics that Twitter had to provide, filling the gap between the current time and the last batch run.
While this system consistently sustained massive scale, its original design and implementation was starting to reach some limits. In particular, some parts of the system that had grown organically over the years were difficult to configure and extend with new features. Some intricate, long-running jobs were also unreliable, leading to sporadic failures. The legacy end-user serving system was very expensive to run and couldn’t support large queries.
To accommodate for the projected growth in user engagement over the next few years and streamline the development of new features, the Twitter Revenue Data Platform engineering team decided to rethink the architecture and deploy a more flexible and scalable system in Google Cloud.
Platform modernization: First iteration
In the middle of 2017, Steve and his team tackled the first redesign iteration of its advertising data platform modernization, leading to Twitter’s collaboration with Google Cloud.
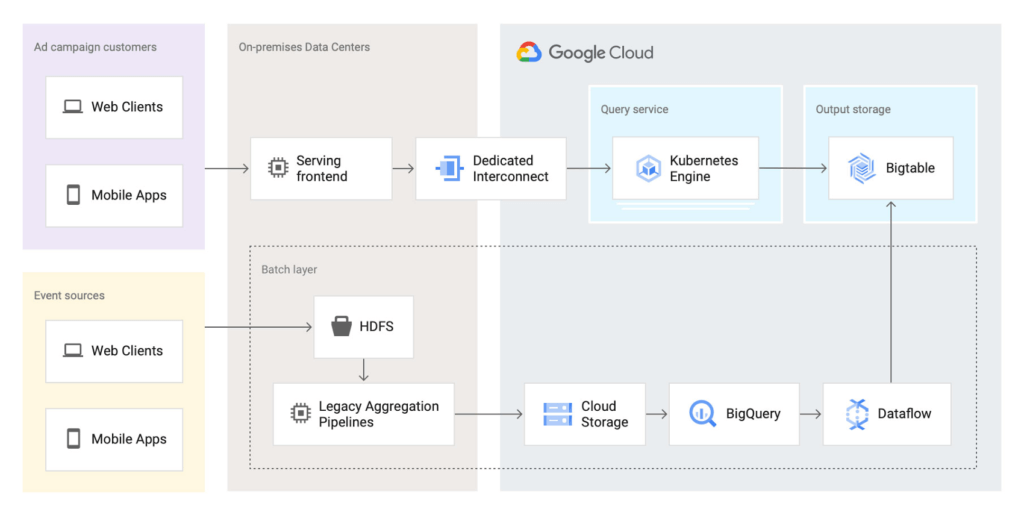
At first, the team left the data aggregation legacy Scalding pipelines unchanged and continued to run them in Twitter’s data centers. But the batch layer’s output was switched from Manhattan to two separate storage locations in Google Cloud:
- BigQuery—Google’s serverless and highly scalable data warehouse, to support ad-hoc and batch queries.
- Cloud Bigtable—Google’s low-latency, fully managed NoSQL database, to serve as a back end for online dashboards and consumer APIs.
The output aggregations from the Scalding pipelines were first transcoded from Hadoop sequence files to Avro on-prem, staged in four-hour batches to Cloud Storage, and then loaded into BigQuery. A simple pipeline deployed on Dataflow, Google Cloud’s fully managed streaming and batch analytics service, then read the data from BigQuery and applied some light transformations. Finally, the Dataflow pipeline wrote the results into Bigtable.
The team built a new query service to fetch aggregated values from Bigtable and process end-user queries. They deployed this query service in a Google Kubernetes Engine (GKE) cluster in the same region as the Bigtable instance to optimize for data access latency.
Here’s a look at the architecture:
This first iteration already brought many important benefits:
- It de-risked the overall migration effort, letting Twitter avoid migrating both the aggregation business logic and storage at the same time.
- The end-user serving system’s performance improved substantially. Thanks to Bigtable’s linear scalability and extremely low latency for data access, the serving system’s P99 latencies decreased from 2+ seconds to 300ms.
- Reliability increased significantly. The team now rarely, if ever, gets paged for the serving system anymore.
Platform modernization: second iteration
With the new serving system in place, in 2019 the Twitter team began to redesign the rest of the data analytics pipeline using Google Cloud technologies. The redesign sought to solve several existing pain points:
- Because the batch and streaming layers ran on different systems, much of the logic was duplicated between systems.
- While the serving system had been moved into the cloud, the existing pain points of the Hadoop aggregation process still existed.
- The real-time layer was expensive to run and required significant operational attention.
With these pain points in mind, the team began evaluating technologies that could help solve them. They considered several open-source stream processing frameworks initially: Apache Flink, Apache Kafka Streams, and Apache Beam. After evaluating all possible options, the team chose Apache Beam for a few key reasons:
- Beam’s built-in support for exactly-once operations at extremely large scale across multiple clusters.
- Deep integration with other Google Cloud products, such as Bigtable, BigQuery, and Pub/Sub, Google Cloud’s fully managed, real-time messaging service.
- Beam’s programming model, which unifies batch and streaming and lets a single job operate on either batch inputs (Cloud Storage), or streaming inputs (Pub/Sub).
- The ability to deploy Beam pipelines on Dataflow’s fully managed service.
The combination of Dataflow’s fully managed approach and Beam’s comprehensive feature set let Twitter simplify the structure of its data transformation pipeline, as well as increase overall data processing capacity and reliability.
Here’s what the architecture looks like after the second iteration:
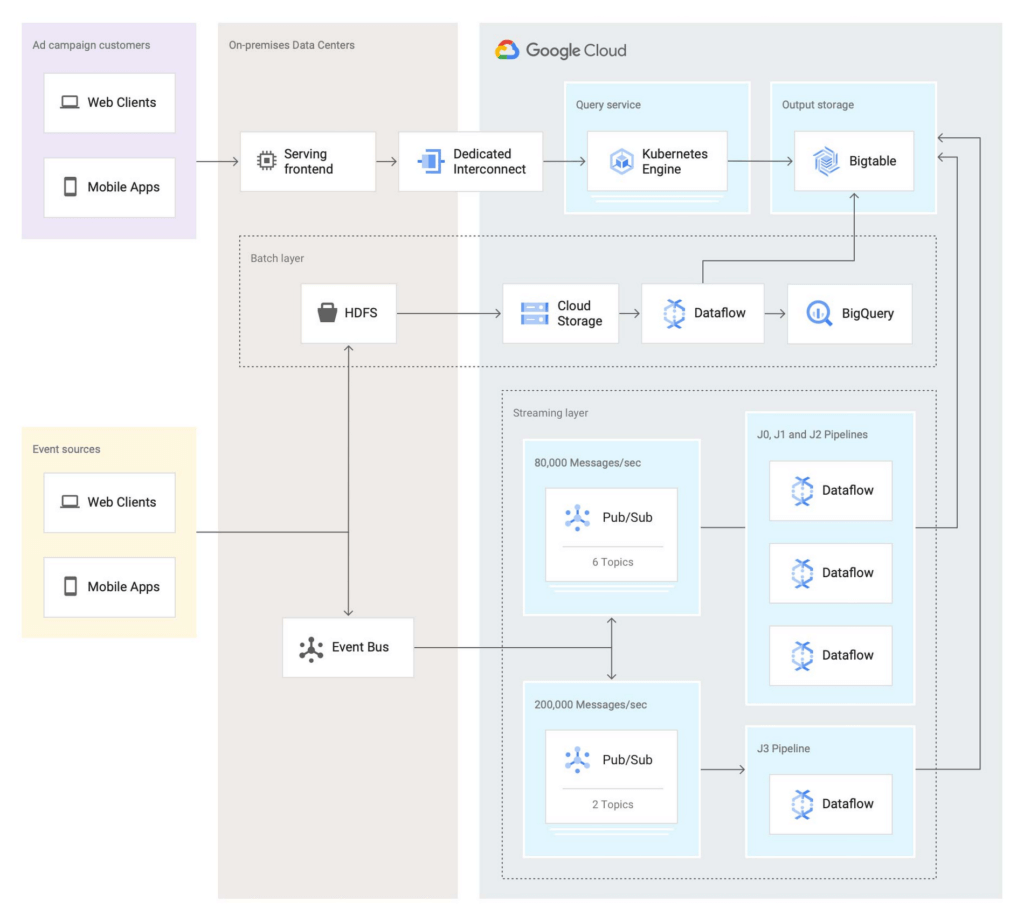
In this second iteration, the Twitter team re-implemented the batch layer as follows: Data is first staged from on-prem HDFS to Cloud Storage. A batch Dataflow job then regularly loads the data from Cloud Storage, processes the aggregations, and dual-writes the results to BigQuery for ad-hoc analysis and Bigtable for the serving system.
The Twitter team also deployed an entirely new streaming layer in Google Cloud. For data ingestion, an on-prem service now pushes two different streams of Avro-formatted messages to Pub/Sub. Each message contains a bundle of multiple raw events and affects between 100 and 1,000 aggregations. This leads to more than 3 million aggregations per second performed by four Dataflow jobs (J0-3 in the diagram above). All Dataflow jobs share the same topology, although each job consumes messages from different streams or topics.
One stream, which contains critical data, enters the system at a rate of 200,000 messages per second and is partitioned in two separate Pub/Sub topics. A Dataflow job (J3 in the diagram) consumes those two streams, performs 400,000 aggregations per second, and outputs the results to a table in Bigtable.
The other stream, which contains less critical but higher volume data, enters the system at a rate of around 80,000 messages per second and is partitioned into six separate topics. Three Dataflow jobs (J0, J1, and J2) share the processing of this larger stream, with each of them handling two of the available six topics in parallel, then also outputting the results to a table in Bigtable. In total, those three jobs process over 2 million aggregations/second.
Partitioning the high-volume stream into multiple topics offers a number of advantages:
- The partitioning is organized by applying a hash function on the aggregation key and then dividing the function’s result by the number of available partitions (in this case, six). This guarantees that any per-key grouping operation in downstream pipelines is scoped to a single partition, which is required for consistent aggregation results.
- When deploying updates to the Dataflow jobs, admins can drain and relaunch each job individually in sequence, allowing the remaining pipelines to continue uninterrupted and minimizing impact on the end users.
- The three jobs can each handle two topics without issue currently, and there is still room to scale horizontally up to six jobs if needed. The number of topics (six) is arbitrary, but is a good balance at the moment based on current needs and potential spikes in traffic.
To assist with job configuration, Twitter initially considered using Dataflow’s template system, a powerful feature that enables the encapsulation of Dataflow pipelines into repeatable templates that can be configured at runtime. However, since Twitter needed to deploy jobs with topologies that might change over time, the team decided instead to implement a custom declarative system where developers can specify different parameters for their jobs in a pystachio DSL: tuning parameters, data sources to operate on, sink tables for aggregation outputs, and the jobs’ source code location. A new major version of Dataflow templates, called Flex Templates, will remove some of the previous limitations with the template architecture and allow any Dataflow job to be templatized.
For job orchestration, the Twitter team built a custom command line tool that processes the configuration files to call the Dataflow API and submit jobs. The tool also allows developers to submit a job update by automatically performing a multi-step process, like this:
- Drain the old job:
- Call the Dataflow API to identify which data sources are used in the job (for example, a Pub/Sub topic reader).
- Initiate a drain request.
- Poll the Dataflow API for the watermark of the identified sources until the maximum watermark is hit, which indicates that the draining operation is complete.
- Launch the new job with the updated code.
This simple, flexible, and powerful system allows developers to focus on their data transformation code without having to be concerned about job orchestration or the underlying infrastructure details.
Looking ahead
Six months after fully transitioning its ad analytics data platform to Google Cloud, Twitter has already seen huge benefits. Twitter’s developers have gained in agility as they can more easily configure existing data pipelines and build new features much faster. The real-time data pipeline has also greatly improved its reliability and accuracy, thanks to Beam’s exactly-once semantics and the increased processing speed and ingestion capacity enabled by Pub/Sub, Dataflow, and Bigtable.
Twitter engineers have enjoyed working with Dataflow and Beam for several years now, since version 2.2, and plan to continue expanding their usage. Most importantly, they’ll soon merge the batch and streaming layers into a single, authoritative streaming layer.
Throughout this project, the Twitter team collaborated very closely with Google engineers to exchange feedback and discuss product enhancements. We look forward to continuing this joint technical effort on several ongoing large-scale cloud migration projects at Twitter. Stay tuned for more updates!
Cloud Bigtable brings database stability and performance to Precognitive

5729
Of your peers have already read this article.
3:40 Minutes
The most insightful time you'll spend today!
At Precognitive, we were able to start with a blank technology slate to support our fraud detection software products. When we started building the initial version of our platform in 2017, we had some decisions to make: What coding language to use? What cloud infrastructure provider to choose? What database to use? The majority of the decisions were straightforward, but we struggled to decide upon a database. We had plenty of collective experience with relational databases, but not with a wide-column database like Cloud Bigtable—which we knew we’d need to scale our behavior and device workloads. At launch, our products were supported by a self-managed database, but we quickly migrated to Cloud Bigtable, and we love it.
To efficiently support our bursty, real-time fraud detection workloads, we needed a cloud database that could satisfy the following key requirements:
- Stability to keep up with increased adoption of our products
- Intelligent scaling that avoids bottlenecks
- Native integrations with BigQuery and Cloud Dataproc
- Managed services that free up our engineers’ time to work on our products
Adding Cloud Bigtable as our performance database
As we scaled our services and added customers, our data collection services for our Device Intelligence and Behavioral Analytics products were seeing thousands of events per second. Cloud Bigtable provided a stable managed database that could handle the volume we were receiving during peak hours. We weren’t always able to handle this scale, as an early version of our product utilized a self-managed database.
Every month, two or three engineers spent hours managing the database instances. Whenever the instances crashed, it would cost at least one engineer a day or two of productivity attempting to restore the instances and recovering any data from our backup database. Managing this database internally was taking precious time away from product development.
We circled back to Cloud Bigtable. After two weeks of R&D, we decided to switch the Device Intelligence and Behavioral Analytics services to Cloud Bigtable.
Cloud Bigtable solved our scaling issues. Cloud Bigtable had been attractive to us from the start because it was fully managed, and offered regional replication and other features we were lacking in our own managed instances. Cloud Bigtable provides horizontal scaling and automatically rebalances row keys (equivalent to a shard key) over time to prevent “hot” nodes. In addition, Cloud Bigtable provides a connector to BigQuery and Cloud Dataproc that allows us to analyze the terabytes of data we are processing and use that data for unsupervised machine learning.
The perks of using Cloud Bigtable
After the migration to Cloud Bigtable, we noticed a number of additional benefits: improved I/O performance, a significant cost reduction, and a sizable decrease in hours spent on database maintenance.
We measured some of our typical metrics before and after implementing Cloud Bigtable. Our request latency dropped by about 30 ms on average (to sub-10 ms) for API requests. Prior to the change, we were seeing latencies of 40+ ms on average. This latency drop on our Behavioral Analytics and Device Intelligence products allowed us to trim about an additional 10 to 15 ms off our average response time across all dependent services.
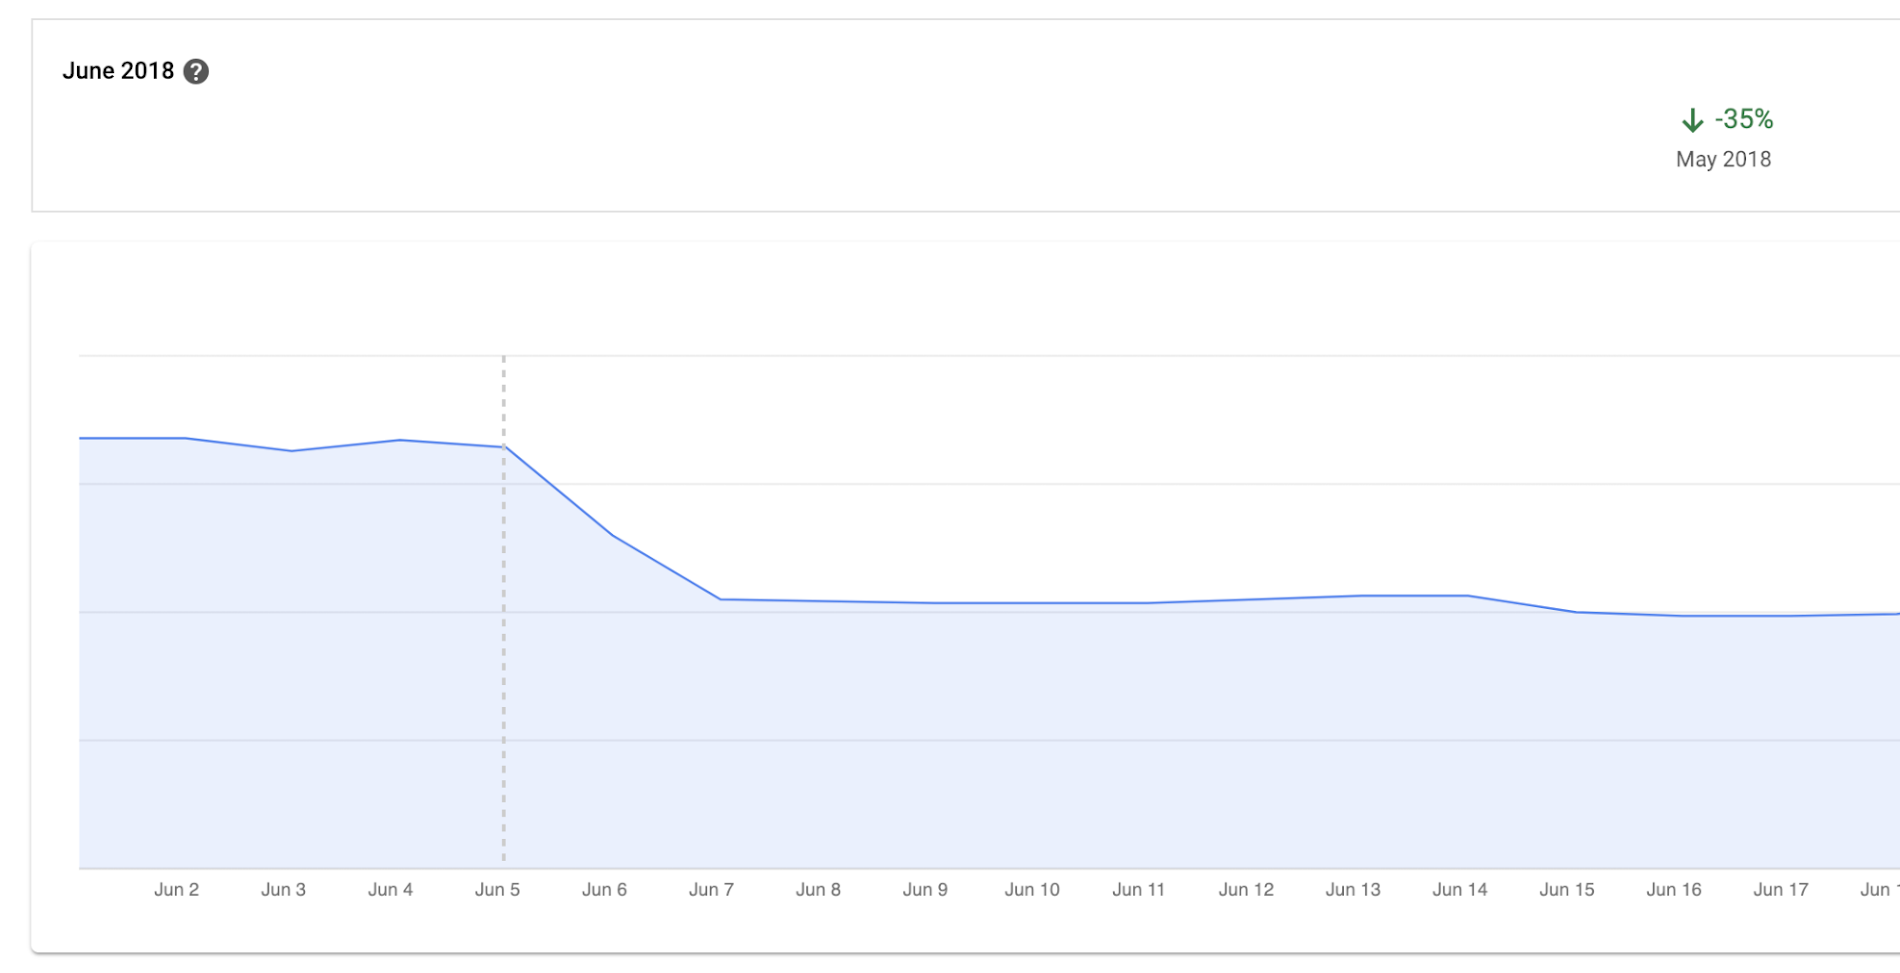
Before we moved to Cloud Bigtable, we had to scale our database instances every time a new customer was onboarded. We were over-scaling in an attempt to avoid constantly resizing our database servers. By sunsetting our self-managed database and switching to Cloud Bigtable, we cut database infrastructure costs by approximately 35% and can now scale as needed, with a couple of clicks, during onboarding.
We have spent zero hours managing a Cloud Bigtable database since launch, and we put the time we are saving every month toward product development.
Moving forward with Cloud Bigtable
As an engineering team, we love working with Cloud Bigtable. We are not only seeing improved developer experience and reduced latency, which keeps the engineers happy, but also reduced costs, which keeps the business happy. We’re able to build more product, too, with the time we’ve saved by switching to Cloud Bigtable. Stay tuned to our engineering blog for more on the lessons we’ve learned and our contributions to the wider Cloud Bigtable community.
Revolutionizing Healthcare Operations with Data Engine Accelerators

1435
Of your peers have already read this article.
3:00 Minutes
The most insightful time you'll spend today!
Healthcare leaders are increasingly challenged to drive operational improvements throughout their facilities, and inefficiencies can cost organizations both time and money and impact patient outcomes. Additionally, staffing shortages and employee burnout remain a major concern in healthcare. Addressing these challenges can help healthcare providers improve organizational operations, patient experiences and care. However, the information that they need to solve these problems is siloed and challenging to access, buried deep in the patient record or spread across IT systems that don’t speak to one another.
To generate a longitudinal patient view and improve patient care, healthcare providers need to reduce fragmentation, unify, and standardize data across siloed systems of records, care facilities and ultimately make it interoperable. This is the heart of Google Cloud’s Healthcare Data Engine.
In partnership with customers, we are prioritizing a ‘use case’ approach to accelerate the adoption of data interoperability. We initially introduced these accelerators a few months ago, and the response has been overwhelmingly positive. Since then, we have been incorporating feedback from early adopters and making improvements to ensure that these accelerators deliver the best possible value to our customers.
The accelerators are deployable use-case configured ‘starter-kits’ within Healthcare Data Engine designed to quickly surface tailored insights with the goal of enabling higher quality of care. Focused on patient flow, transition of care, and social determinants of health, the accelerators provide aggregated data and visualizations to help customers understand a broad range of facility efficiency metrics, patient insight and health equity measures across their patient populations:
- Patient Flow Explorer: Enables health systems to surface a range of facility efficiency metrics to identify trends and potential drivers of bottlenecks, manage patient admissions, transfers and length of stay, while optimizing departmental capacity management.
- Transition of Care Explorer: Provides medical professionals a consolidated view into a patient’s detail and medical history, illustrating their journeys in different settings within the health system and helps caregivers prioritize patient treatment.
- Social Determinants of Health Explorer: Leverages Healthcare Data Engine and social determinants of health data to identify at risk populations of patients in near-real-time and improve care in under-served communities.
The first three accelerator use cases were designed in collaboration with industry healthcare leaders including Highmark Health, Lifepoint Health, and others, helping organizations address common industry challenges.
“Interoperability is at the heart of Highmark Health’s Living Health strategy and we intend to leverage our blended structure of payor and provider to deliver a differentiated health experience for our patients and members,” said Richard Clarke, chief data and analytics officer, Highmark Health. “Healthcare Data Engine is a central component to enabling that strategy and we are excited about the new accelerators being announced today as they will speed up time-to-value for our members.”
“Google Cloud’s solution-oriented approach brings the best of technology and healthcare together to help improve quality, increase access and ensure equitable care for patients no matter where they live,” said Jessica Beegle, senior vice president and chief innovation officer of Lifepoint Health. “Instead of giving us building blocks that need to be assembled, they are delivering custom-built solutions to help us efficiently tackle key problems in our markets and provide more useful data for our clinical teams to take better care of their patients. Lifepoint is proud to partner with Google Cloud and bring the best of Silicon Valley to communities of all sizes across the United States.”
At Google Cloud, we will continue our partnership with healthcare leaders to identify the most impactful Healthcare Data Engine use cases to support, to help organizations accelerate their data transformations to bring better, more timely care to patients and communities. To learn more about Healthcare Data Engine and other solutions tailored to the healthcare and life sciences space, visit cloud.google.com/healthcare.
Qlik and Google Cloud Combo: Extending Integration of SAP Data on BigQuery
5481
Of your peers have already read this article.
2:00 Minutes
The most insightful time you'll spend today!
If your organization is one of the 52% of SAP customers whose top analytics pain point is data integration1, Google Cloud has got you covered. By working with partners like Qlik, we are expanding our integration options and bringing real-time replication capability for SAP to BigQuery.
Integrated data for accelerated insights
BigQuery—our fully managed, enterprise data warehouse that can scale up to petabytes on demand and execute queries in seconds—allows SAP customers to consolidate enterprise data silos and confidently derive more use and value from their data. Customers can accelerate and simplify the delivery of SAP data on BigQuery with the latest Qlik Data Integration platform offering for Google Cloud which allows data integration using an automated, near real-time data pipeline through Qlik Replicate, whether data originates from legacy SAP environments, SAP HANA, or SAP application servers. Additionally, Qlik Compose for Data Warehouses can be used to easily generate and automate logical data models from SAP directly in BigQuery freeing up more time for data analysts to leverage advanced built-in capabilities such as BigQuery ML to derive greater value and insights using standard SQL without the need for advanced programming expertise.
Delivering faster results with real-time
Traditional extract-transform-load (ETL) solutions operate on a batch basis, pulling data sets from SAP daily, hourly, or every minute. These tools often require manual mapping of multiple data fields so that data flows accurately. Given SAP’s highly complex table relationships, in which a single transaction can result in multiple changes, this can be a time consuming and tedious process. ETL can also increase the burden on your SAP systems.
Qlik Replicate simplifies this with its intuitive user interface where you can set up real-time data replication between SAP and BigQuery, eliminating the need for manual coding. And, to prevent system overhead, as soon as a new transaction is entered into SAP, the resulting data is replicated into BigQuery in a process known as change data capture (CDC) from SAP’s log layer. This means that data transfer can benefit from high performance with minimal impact on the source system’s resources. Read our latest white paper to learn how to extract SAP data into BigQuery leveraging Qlik Replicate.
Solution expertise for all core SAP workloads
It doesn’t matter what database your SAP system runs on, Qlik Replicate supports all core SAP systems. It automates real-time data replication and decodes SAP’s complex, application-specific data structures into formats that flow smoothly into BigQuery. This ensures that anyone who depends on data analytics has the most current and relevant SAP data they need. For its robust solution capabilities Qlik has received a new “SAP on Google Cloud Expertise” designation for supporting:
- Fast onboarding and accelerated replication of SAP data into Google Cloud
- Real-time and continuous data replication from SAP applications to BigQuery
- Support for all core SAP modules and a broad set of data sources
- Automated data integration, which cuts resource requirements for initial delivery and ongoing maintenance
Proven customer results
Many SAP customers have experienced the benefits of leveraging Qlik alongside BigQuery for data analytics and AI at scale, including German luxury department store chain Breuninger. In order to meet its customers’ growing and changing expectations,Breuninger needed to accelerate its time to insight from data sources across a highly dispersed landscape of on-premises databases and systems, including SAP. The company uses Qlik Replicate to feed corporate data from modules in its SAP system into BigQuery and integrate its varying on-premises databases with the Google Cloud environment. This has yielded game-changing, real-time customer insights for the retailer.
What could your business do with faster, more integrated insights? Learn more about BigQuery for SAP customers and also how Qlik and Google Cloud can help you modernize and automate data integration and analytics.
More Relevant Stories for Your Company

Transform Your Customer Experience with Latest Database Innovations
We’re all accustomed to Google magic in our daily lives. When we need information like the time a store closes, the best route to a destination, help cooking a favorite recipe — we just ask Google. Google is known for providing useful information everywhere, wherever you are. But for business,

Quick Recap on Google Cloud: Latest News, Launches, Updates, Events and More
Want to know the latest from Google Cloud? Find it here in one handy location. Check back regularly for our newest updates, announcements, resources, events, learning opportunities, and more. Tip: Not sure where to find what you’re looking for on the Google Cloud blog? Start here: Google Cloud blog 101: Full list

How AI-powered ML Models Helps Run Unemployment Claims Verification at Scale
With unemployment application submissions reaching record numbers over the past year, state and local agencies in the United States have faced the challenge of processing unprecedented numbers of claims per week. The digital infrastructure most agencies have in place is unable to handle this volume, resulting in constituents waiting longer,

Lending DocAI Shortens Borrowers’ Journey on Roostify
The home lending journey entails processing an immense number of documents daily from hundreds of thousands of borrowers. Currently, home lending document processing relies on some outdated digital models and a high dependency on manual labor, resulting in slow processing times and higher origination costs. Scaling a business that sorts
