





5919
Of your peers have already watched this video.
33:30 Minutes
The most insightful time you'll spend today!
How Spotify Serves Personalized Music Recommendations
Music for everyone. That’s Spotify’s promise. And it lives up to it by serving over 140 million music lovers across the world. Every day it renders personalized music recommendations to hundreds of millions of happy customers.
“Spotify is a global business with a global user base. Being able to provide a great audio experience to our users is a key priority for us,” said Niklas Gustavsson, chief architect at Spotify.
To be able to do that, Spotify needed a system that would scale and enable personalization and provide a seamless customer experience. That’s why it moved its infrastructure to Google Cloud and Cloud Bigtable. This allows Spotify to deliver recommendations at scale, roll out experiments quickly, and ingest terabytes every day via Cloud Dataflow.
“With Cloud Bigtable clusters in Asia, Europe, and the United States, we’re able to get low-latency data access all over the world, enabling Spotify to provide a seamless experience for our users. We’re also pleased with the continuous collaboration and deep engagement with Google’s product teams to accelerate both our businesses, ” says Gustavsson.
In this video, Peter Sobot, Senior Engineer, Personalization, Spotify talks about how Cloud Bigtable is helping Cloud Bigtable personalize recommendations, including tips about how to design a good schema, how to avoid latency when ingesting new data, and effective caching strategies to scale to tens of millions of data points per second.
Cloud Bigtable brings database stability and performance to Precognitive

5705
Of your peers have already read this article.
3:40 Minutes
The most insightful time you'll spend today!
At Precognitive, we were able to start with a blank technology slate to support our fraud detection software products. When we started building the initial version of our platform in 2017, we had some decisions to make: What coding language to use? What cloud infrastructure provider to choose? What database to use? The majority of the decisions were straightforward, but we struggled to decide upon a database. We had plenty of collective experience with relational databases, but not with a wide-column database like Cloud Bigtable—which we knew we’d need to scale our behavior and device workloads. At launch, our products were supported by a self-managed database, but we quickly migrated to Cloud Bigtable, and we love it.
To efficiently support our bursty, real-time fraud detection workloads, we needed a cloud database that could satisfy the following key requirements:
- Stability to keep up with increased adoption of our products
- Intelligent scaling that avoids bottlenecks
- Native integrations with BigQuery and Cloud Dataproc
- Managed services that free up our engineers’ time to work on our products
Adding Cloud Bigtable as our performance database
As we scaled our services and added customers, our data collection services for our Device Intelligence and Behavioral Analytics products were seeing thousands of events per second. Cloud Bigtable provided a stable managed database that could handle the volume we were receiving during peak hours. We weren’t always able to handle this scale, as an early version of our product utilized a self-managed database.
Every month, two or three engineers spent hours managing the database instances. Whenever the instances crashed, it would cost at least one engineer a day or two of productivity attempting to restore the instances and recovering any data from our backup database. Managing this database internally was taking precious time away from product development.
We circled back to Cloud Bigtable. After two weeks of R&D, we decided to switch the Device Intelligence and Behavioral Analytics services to Cloud Bigtable.
Cloud Bigtable solved our scaling issues. Cloud Bigtable had been attractive to us from the start because it was fully managed, and offered regional replication and other features we were lacking in our own managed instances. Cloud Bigtable provides horizontal scaling and automatically rebalances row keys (equivalent to a shard key) over time to prevent “hot” nodes. In addition, Cloud Bigtable provides a connector to BigQuery and Cloud Dataproc that allows us to analyze the terabytes of data we are processing and use that data for unsupervised machine learning.
The perks of using Cloud Bigtable
After the migration to Cloud Bigtable, we noticed a number of additional benefits: improved I/O performance, a significant cost reduction, and a sizable decrease in hours spent on database maintenance.
We measured some of our typical metrics before and after implementing Cloud Bigtable. Our request latency dropped by about 30 ms on average (to sub-10 ms) for API requests. Prior to the change, we were seeing latencies of 40+ ms on average. This latency drop on our Behavioral Analytics and Device Intelligence products allowed us to trim about an additional 10 to 15 ms off our average response time across all dependent services.
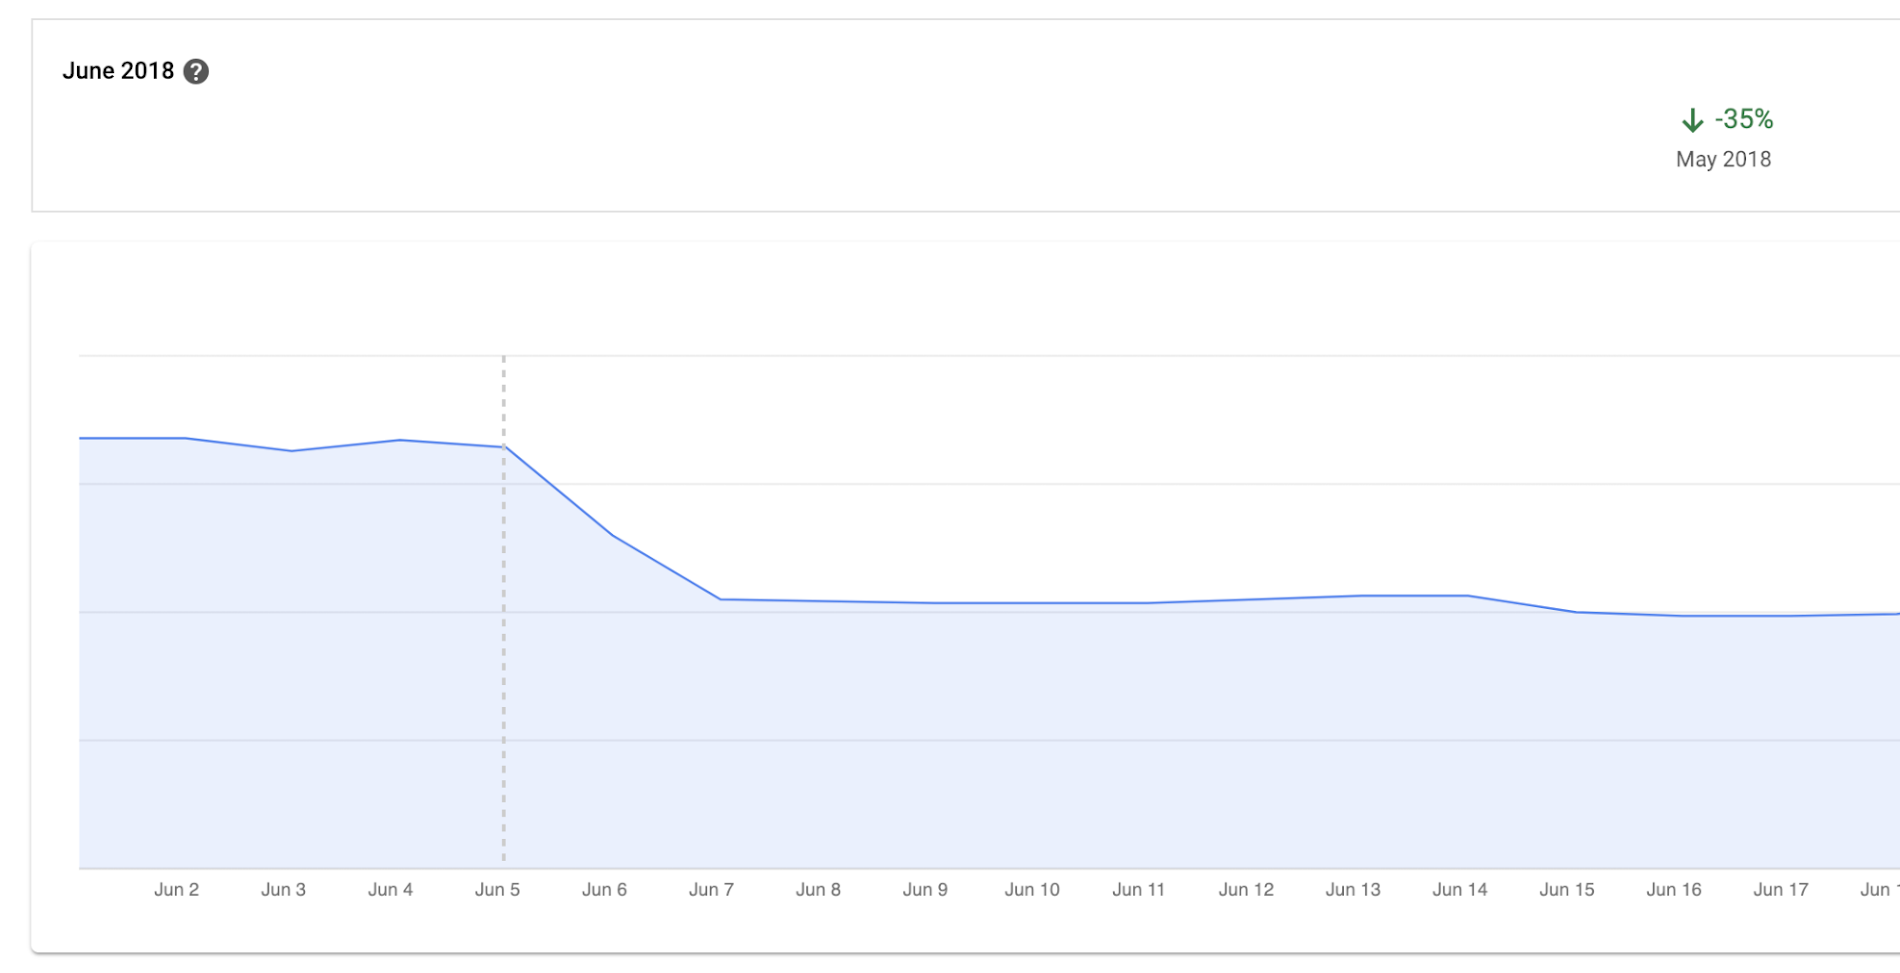
Before we moved to Cloud Bigtable, we had to scale our database instances every time a new customer was onboarded. We were over-scaling in an attempt to avoid constantly resizing our database servers. By sunsetting our self-managed database and switching to Cloud Bigtable, we cut database infrastructure costs by approximately 35% and can now scale as needed, with a couple of clicks, during onboarding.
We have spent zero hours managing a Cloud Bigtable database since launch, and we put the time we are saving every month toward product development.
Moving forward with Cloud Bigtable
As an engineering team, we love working with Cloud Bigtable. We are not only seeing improved developer experience and reduced latency, which keeps the engineers happy, but also reduced costs, which keeps the business happy. We’re able to build more product, too, with the time we’ve saved by switching to Cloud Bigtable. Stay tuned to our engineering blog for more on the lessons we’ve learned and our contributions to the wider Cloud Bigtable community.
11992
Of your peers have already watched this video.
3:26 Minutes
The most insightful time you'll spend today!
How L&T Financial Services Processes 95% of Motorcycle Loans in Less Than Two Minutes
L&T Financial Services is one of the largest lenders in India. India’s demonetization policy in recent years has led to a shift from cash transactions to digital payments. In 2016, the government withdrew 500 and 1000 rupee notes from circulation and encouraged a heavily cash-based population to deposit their canceled notes in banks. Financial institutions needed to pivot to a new way of doing business to stay competitive. L&T Financial Services modernized its IT infrastructure to keep up with changes and capture digital opportunities.
“Working capital is crucial to stimulate growth in rural communities. Our role as a lender is to provide access to funds. We don’t want to burden borrowers with the complexities of getting a loan. Towards this end, digitization is an important step,” says Dinanath Dubhashi, Managing Director and CEO at L&T Financial Services. “Google Cloud helps us streamline service delivery and identify the right customers. By offering the fastest processing time in the industry, we want to be the go-to lender for all customers.”
L&T Financial Services considered multiple cloud providers before choosing Google Cloud. According to Dinanath, Google Cloud understands both the need for businesses to move fast and the need for IT to modernize at different speeds. “We weren’t forced to abandon existing IT systems and migrate lock, stock, and barrel to Google Cloud on day one.”
L&T Financial Services engaged Google Cloud Professional Services to guide its digital transformation journey. The smooth migration from proof of concept to full-scale deployment on Google Cloud took a matter of months.
“Collaboration: a small idea with big opportunities. G Suite helps us connect remote branches with the head office, easily access shared files to submit and track approvals, and conduct face-to-face discussions to accelerate approval processes.”
—Dinanath Dubhashi, MD and CEO, L&T Financial Services
Digitizing the workforce with G Suite
The move to the cloud at L&T Financial Services started in 2017 when the company introduced G Suite to its 14,500 employees. The legacy email system was cumbersome to use, especially for frontline staff who need email access while they are on the road. Using Gmail, employees can connect with customers and co-workers from anywhere, on any device. Employees save time by scheduling meetings with Calendar, collaborating on Docs, and conducting video calls using Hangouts Meet.
Converting data into credit insights using BigQuery
Taking data intelligence one step further, L&T Financial Services adopts a responsible lending approach by applying algorithm-based data analytics to improve credit standards. Beyond traditional data such as credit score and credit payment history, the company also considers macro-economic indicators for risk audits. For example, a farmer’s ability to pay off the loan of his new tractor depends on a successful planting and harvest. So L&T Financial Services feeds long-term data into BigQuery and runs queries to predict loan defaults based on rainfall and crop yield.
Real-time analytics for on-time delivery: Mercado Libre

3038
Of your peers have already read this article.
1:30 Minutes
The most insightful time you'll spend today!
Iteration and innovation fuel the data-driven culture at Mercado Libre. In our first post, we presented our continuous intelligence approach, which leverages BigQuery and Looker to create a data ecosystem on which people can build their own models and processes.
Using this framework, the Shipping Operations team was able to build a new solution that provided near real-time data monitoring and analytics for our transportation network and enabled data analysts to create, embed, and deliver valuable insights.
The challenge
Shipping operations are critical to success in e-commerce, and Mercado Libre’s process is very complex since our organization spans multiple countries, time zones, and warehouses, and includes both internal and external carriers. In addition, the onset of the pandemic drove exponential order growth, which increased pressure on our shipping team to deliver more while still meeting the 48-hour delivery timelines that customers have come to expect.
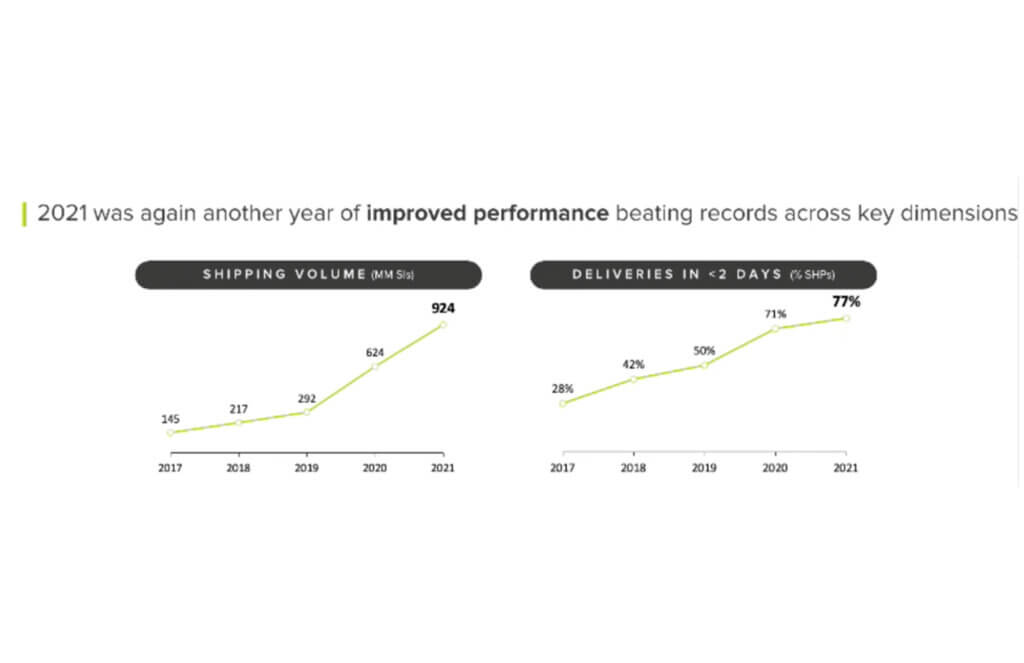
This increased demand led to the expansion of fulfillment centers and cross-docking centers, doubling and tripling the nodes of our network (a.k.a. meli-net) in the leading countries where we operate. We also now have the largest electric vehicle fleet in Latin America and operate domestic flights in Brazil and Mexico.
We previously worked with data coming in from multiple sources, and we used APIs to bring it into different platforms based on the use case. For real-time data consumption and monitoring, we had Kibana, while historical data for business analysis was piped into Teradata. Consequently, the real-time Kibana data and the historical data in Teradata were growing in parallel, without working together. On one hand, we had the operations team using real-time streams of data for monitoring, while on the other, business analysts were building visualizations based on the historical data in our data warehouse.
This approach resulted in a number of problems:
- The operations team lacked visibility and required support to build their visualizations. Specialized BI teams became bottlenecks.
- Maintenance was needed, which led to system downtime.
- Parallel solutions were ungoverned (the ops team used an Elastic database to store and work with attributes and metrics) with unfriendly backups and data bounded for a period of time.
- We couldn’t relate data entities as we do with SQL.
Striking a balance: real-time vs. historical data
We needed to be able to seamlessly navigate between real-time and historical data. To address this need, we decided to migrate the data to BigQuery, knowing we would leverage many use cases at once with Google Cloud.
Once we had our real-time and historical data consolidated within BigQuery, we had the power to make choices about which datasets needed to be made available in near real-time and which didn’t. We evaluated the use of analytics with different time windows tables from the data streams instead of the real-time logs visualization approach. This enabled us to serve near real-time and historical data utilizing the same origin.
We then modeled the data using LookML, Looker’s reusable modeling language based on SQL, and consumed the data through Looker dashboards and Explores. Because Looker queries the database directly, our reporting mirrored the near real-time data stored in BigQuery. Finally, in order to balance near real-time availability with overall consumption costs, we analyzed key use cases on a case-by-case basis to optimize our resource usage.
This solution prevented us from having to maintain two different tools and featured a more scalable architecture. Thanks to the services of GCP and the use of BigQuery, we were able to design a robust data architecture that ensures the availability of data in near real-time.
Streaming data with our own Data Producer Model: from APIs to BigQuery
To make new data streams available, we designed a process which we call the “Data Producer Model” (“Modelo Productor de Datos” or MPD) where functional business teams can serve as data creators in charge of generating data streams and publishing them as related information assets we call “data domains”. Using this process, the new data comes in via JSON format, which is streamed into BigQuery. We then use a 3-tiered transformation process to convert that JSON into a partitioned, columnar structure.
To make these new data sets available in Looker for exploration, we developed a Java utility app to accelerate the development of LookML and make it even more fun for developers to create pipelines.
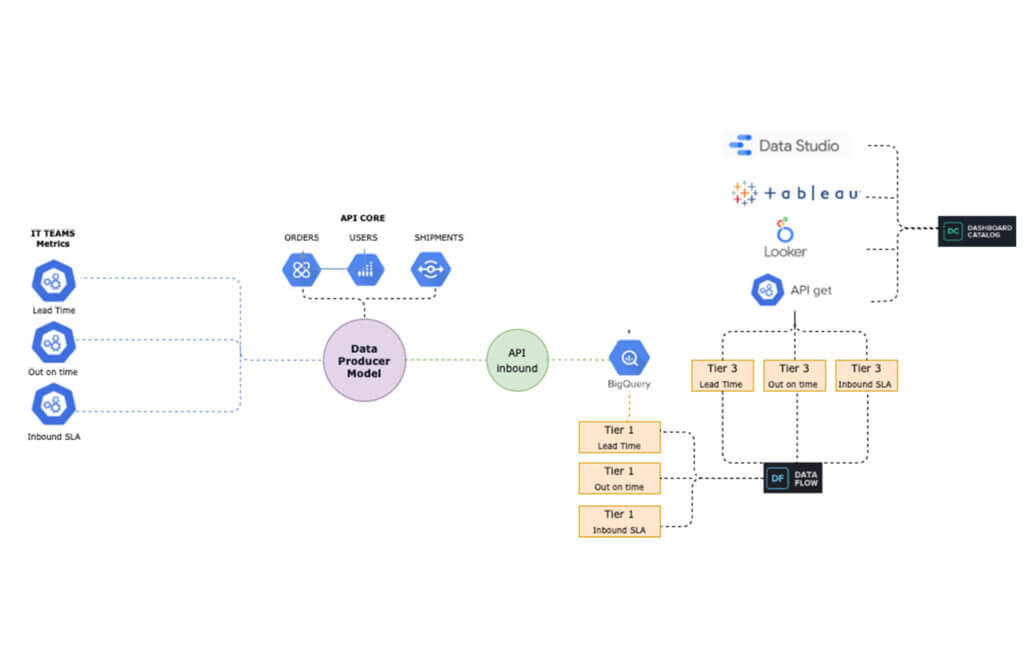
The complete “MPD” solution results in different entities being created in BigQuery with minimal manual intervention. Using this process, we have been able to automate the following:
- The creation of partitioned, columnar tables in BigQuery from JSON samples
- The creation of authorized views in a different GCP BigQuery project (for governance purposes)
- LookML code generation for Looker views
- Job orchestration in a chosen time window
By using this code-based incremental approach with LookML, we were able to incorporate techniques that are traditionally used in DevOps for software development, such as using Lams to validate LookML syntax as a part of the CI process and testing all our definitions and data with Spectacles before they hit production. Applying these principles to our data and business intelligence pipelines has strengthened our continuous intelligence ecosystem. Enabling exploration of that data through Looker and empowering users to easily build their own visualizations has helped us to better engage with stakeholders across the business.
The new data architecture and processes that we have implemented have enabled us to keep up with the growing and ever-changing data from our continuously expanding shipping operations. We have been able to empower a variety of teams to seamlessly develop solutions and manage third party technologies, ensuring that we always know what’s happening – and more critically – enabling us to react in a timely manner when needed.
Outcomes from improving shipping operations:
Today, data is being used to support decision-making in key processes, including:
- Carrier Capacity Optimization
- Outbound Monitoring
- Air Capacity Monitoring
This data-driven approach helps us to better serve you -and everyone- who expects to receive their packages on-time according to our delivery promise. We can proudly say that we have improved both our coverage and speed, delivering 79% of our shipments in less than 48 hours in the first quarter of 2022.
Here is a sneak peek into the data assets that we use to support our day-to-day decision making:
a. Carrier Capacity: Allows us to monitor the percentage of network capacity utilized across every delivery zone and identify where delivery targets are at risk in almost real time.
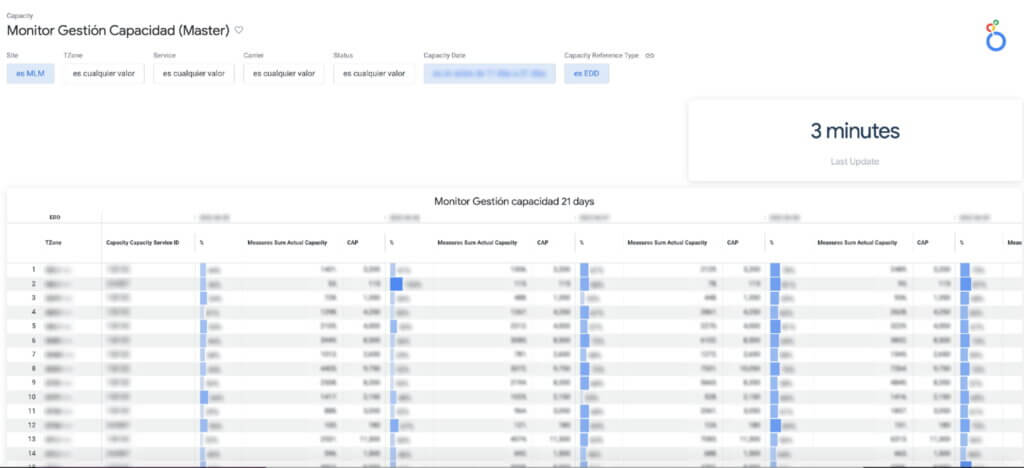
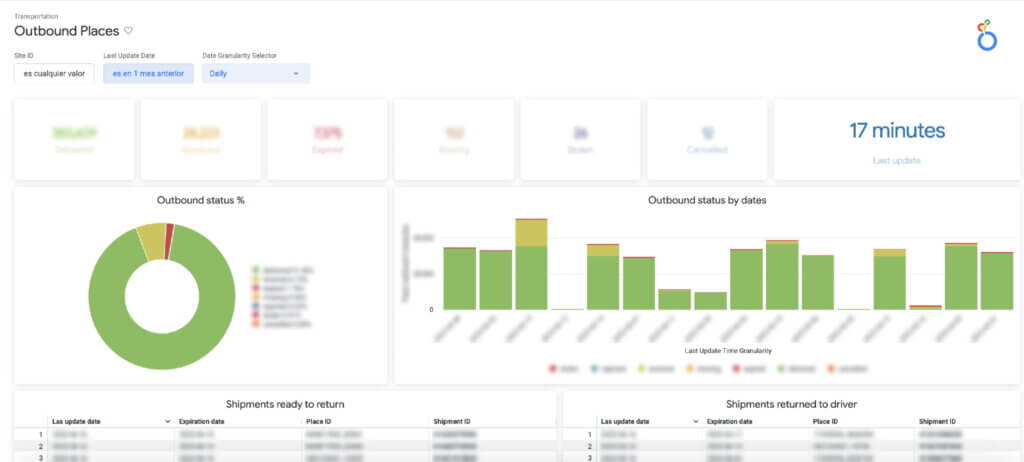
b. Outbound Places Monitoring: Consolidates the number of shipments that are destined for a place (the physical points where a seller picks up a package), enabling us to both identify places with lower delivery efficiency and drill into the status of individual shipments.
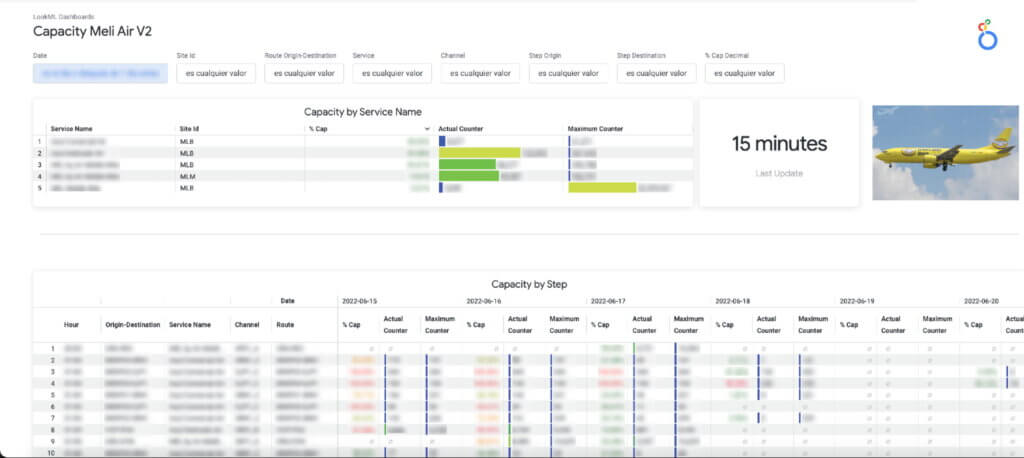
c. The Air Capacity Monitoring: Provides capacity usage monitoring for our aircrafts running each of our shipping routes.
Costs into the equation
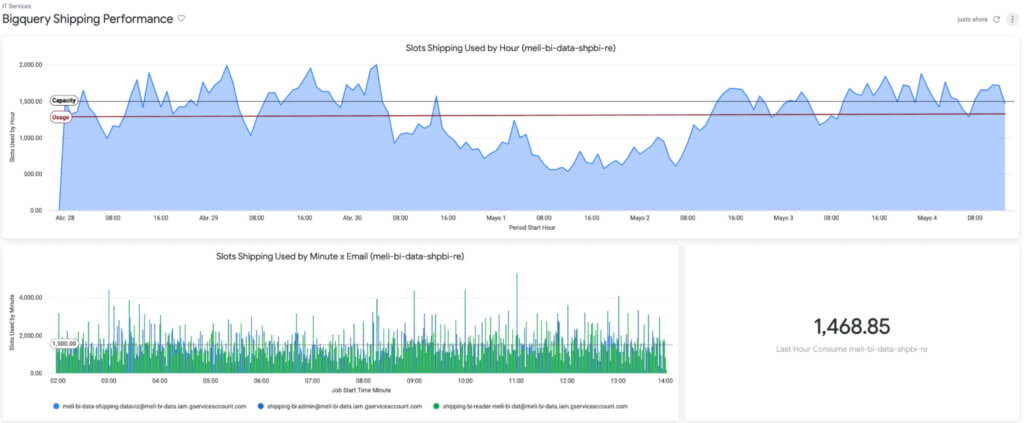
The combination of BigQuery and Looker also showed us something we hadn’t seen before: overall cost and performance of the system. Traditionally, developers maintained focus on metrics like reliability and uptime without factoring in associated costs.
By using BigQuery’s information schema, Looker Blocks, and the export of BigQuery logs, we have been able to closely track data consumption, quickly detect underperforming SQL and errors, and make adjustments to optimize our usage and spend.
Based on that, we know the Looker Shipping Ops dashboards generate a concurrency of more than 150 queries, which we have been able to optimize by taking advantage of BigQuery and Looker caching policies.
The challenges ahead
Using BigQuery and Looker has enabled us to solve numerous data availability and data governance challenges: single point access to near real-time data and to historical information, self-service analytics & exploration for operations and stakeholders across different countries & time zones, horizontal scalability (with no maintenance), and guaranteed reliability and uptime (while accounting for costs), among other benefits.
However, in addition to having the right technology stack and processes in place, we also need to enable every user to make decisions using this governed, trusted data. To continue achieving our business goals, we need to democratize access not just to the data but also to the definitions that give the data meaning. This means incorporating our data definitions with our internal data catalog and serving our LookML definitions to other data visualizations tools like Data Studio, Tableau or even Google Sheets and Slides so that users can work with this data through whatever tools they feel most comfortable using.
If you would like a more indepth look at how we made new data streams available from a process we designed called the “Data Producer Model” (“Modelo Productor de Datos” or MPD) register to attend our webcast on August 31.
While learning and adopting new technologies can be a challenge, we are excited to tackle this next phase, and we expect our users will be too, thanks to a curious and entrepreneurial culture. Are our teams ready to face new changes? Are they able to roll out new processes and designs? We’ll go deep on this in our next post.
How One Company Uses AI and Data Analysis to Boost Revenue

9437
Of your peers have already read this article.
4:30 Minutes
The most insightful time you'll spend today!
AI, deep learning, and image recognition is transforming the shopping experience. These technologies enable consumers to use product images or screenshots rather than text to search for similar products. This improves the customer experience and enables retailers with online and offline outlets to provide a genuine omnichannel experience.
The lack of complexity and the ease of use of BigQuery has enabled ViSenze to reduce its data infrastructure and management costs by 30%–50%, and scale up without incurring downtime.
—Renjie Yao, Data Platform Lead, ViSenze
Visual commerce provider ViSenze is helping some of the world’s leading retailers improve conversion rates through image-based search.
The business’s products also enable media companies to use the platform to turn images and videos into engagement opportunities—driving new and incremental revenues.
Created through NExT—a research center established by the National University of Singapore and Tsinghua University of China—ViSenze now operates in the United States, United Kingdom, India, China, and Singapore. The business is backed by Japan-based internet and ecommerce company Rakuten and cross-border investment specialist WI Harper Group.
Growth in SMB and Mobiles
Renjie Yao, Data Platform Lead at ViSenze, sees opportunities for growth in the small-to-medium business sector, where companies do not have the resources to build similar technologies, and with mobile device OEMs to integrate ViSenze natively on smartphones.
Phone owners can activate a “shopping lens” on camera and gallery apps to capture an image of a product. They then receive matching results from more than 800 partner merchants and retailers and can then click through to product pages on partner apps or mobile websites. Alternatively, they may use a photo to compare products sold on different sites or shop matching styles.
“Our research found Google Cloud provided a complete, integrated ecosystem rather than a disparate collection of tools and components, and so was ideal for our needs.”
—Renjie Yao, Data Platform Lead, ViSenze
The ViSenze API analyzes the contents of a selected or clicked image and sends the information back to the organization’s visual commerce platform. The platform feeds back similar results based on that information.
The ViSenze offering also extends to image analysis for the tagging of product attributes—such as a white turtleneck cardigan with full sleeves—to provide an improved search experience.
Data Vital to ViSenze
Capturing and analyzing large volumes of data is integral to ViSenze. “We have to understand how consumers interact with our customers’ ecommerce websites and apps,” says Yao. “For example, we need to know who has looked at a particular pair of jeans on a website and whether that visit led to a conversion. We can then tell that customer whether they need to make more stock available.”
ViSenze also relies on data to provide high-quality training for its image recognition models and its domain-specific models for online retail.
Protect Customer Data
Data is vital to ViSenze—but customer privacy is most important. “All the data we collect is transparent to our customers, meaning they can decide what they do not want us to collect. In addition, all personal data processing complies with privacy protection regulations in each region, such as the General Data Protection Regulation in Europe.”
A Quick Move to the Cloud
ViSenze started operations using servers, storage, networking, and associated systems in an on-premises data center operated by NExT.
However, to support rapid growth, the business decided to move its workloads to the cloud. ViSenze opted for a multi-cloud architecture, using in part a Google Cloud data infrastructure.
“Our research found Google Cloud provided a complete, integrated ecosystem rather than a disparate collection of tools and components, and so was ideal for our needs,” says Yao. “We could connect different components with the click of a mouse.” Further, the business found it could easily configure rules and pipelines to route data logs to relevant Google Cloud services.
The review found Google Cloud’s extensive managed services would also remove administration and maintenance tasks from ViSenze’s in-house technology team—freeing team members to focus on more valuable tasks.
In addition, Google Cloud provided the security features—including custom hardware running hardened operating systems and file systems and encryption of data at rest and in transit—needed to protect sensitive information. Finally, the location of Google Cloud regions in several countries would enable the business to meet regulatory and data sovereignty requirements.
A Three-Month Implementation
ViSenze opted to move to Google Cloud in mid-2017 and completed a three-month implementation using internal resources. “The process was very smooth and intuitive, and we had no problems building our entire data platform within Google Cloud,” says Yao.
The business now uses an architecture comprising Google Kubernetes Engine to manage and orchestrate Docker containers running in Google Cloud Platform; BigQuery to provide an analytics data warehouse, with Google Data Studio providing customizable visualization and reports; Stackdriver to monitor and manage virtual machine instances and services inside Google Cloud; Cloud SQL to manage its relational databases for real-time analytics; Compute Engine to provide compute resources; Cloud Storage to store files and objects; Cloud Pub/Sub to provide real-time messaging between applications; and Cloud Functions to build event-driven applications.
After collecting the request logs of users in virtual machine instances and Docker containers, ViSenze distributes them in three directions. “We export raw logs into Cloud Pub/Sub for indexing inside an Elasticsearch search engine, and to a BigQuery data warehouse for further analytics,” explains Yao. “We also use Cloud Functions-created applications to obtain the logs from Cloud Pub/Sub to perform some real-time calculations.”
“We are currently using Airflow workflow management on Compute Engine as our hosted ETL platform, but are likely to move to Cloud Composer in future.”
500 Million Records Per Day
With Google Cloud providing its data infrastructure, ViSenze is well positioned to meet internal and customer demands for more granular insights. The business is now processing 500 million records per day through BigQuery and saves up to one year’s aggregated data—excluding any personal data—in the data warehouse for analysis.
The nature of ViSenze’s business means most reports are generated for data processed on an hourly, daily, or monthly basis. “BigQuery is extremely stable and performance optimized, regardless of the volume of data it processes,” says Yao. “Across BigQuery and other Google Cloud Platform services, we’ve recorded 99.99% availability over the past year.”
The lack of complexity and the ease of use of BigQuery has enabled ViSenze to reduce its data infrastructure and management costs by 30%–50%, and scale up without incurring downtime.
“With BigQuery, we have saved the equivalent of two full-time engineers and now need only half of one person’s time to maintain our whole data platform,” says Yao.
“In addition, BigQuery integrates closely with Data Studio, enabling non-technical people in our product and business teams to create dynamic, detailed analysis dashboards. We now use Data Studio to create nearly 50 separate reports.”
The business has now grown to offer access to more than 1 billion users and a listing of more than 400 million purchasable products.
Next Steps
ViSenze is now researching the potential of the Cloud AutoML suite of machine learning products to improve the training of its models and run a fully managed NoSQL database through Cloud Datastore.
“A NoSQL database service is the only missing piece of our architecture for now, and using Cloud Datastore would enable us to focus almost exclusively on our business,” says Yao. “With Google Cloud Platform, we are ideally positioned to continue providing support to our business team and help them continue expanding into new markets.
“In addition, we can help retailers and consumers to unlock the potential of the web and apps to transform the purchasing experience.”
Unified, Flexible and Accessible: How Companies’ Data Help Them Achieve More on Google Cloud

4859
Of your peers have already read this article.
1:30 Minutes
The most insightful time you'll spend today!
As the volume of data that people and businesses produce continues to grow exponentially, it goes without saying that data-driven approaches are critical for tech companies and startups across all industries. But our conversations with customers, as well as numerous industry commentaries, reiterate that managing data and extracting value from it remains difficult, especially with scale.
Numerous factors underpin the challenges, including access to and storage of data, inconsistent tools, new and evolving data sources and formats, compliance concerns, and security considerations. To help you identify and solve these challenges, we’ve created a new whitepaper, “The future of data will be unified, flexible, and accessible,” which explores many of the most common reasons our customers tell us they’re choosing Google Cloud to get the most out of their data.
For example, you might need to combine data in legacy systems with new technologies. Does this mean moving all your data to the cloud? Should it be in one cloud or distributed across several? How do you extract real value from all of this data without creating more silos?
You might also be limited to analyzing your data in batch instead of processing it in real-time, adding complexity to your architecture and necessitating expensive maintenance to combat latency. Or you might be struggling with unstructured data, with no scalable way to analyze and manage it. Again, the factors are numerous—but many of them accrue to inadequate access to data, often exacerbated by silos, and insufficient ability to process and understand it.
The modern tech stack should be a streaming stack that scales with your data, provides real-time analytics, incorporates and understands different types of data, and lets you use AI/ML to predictively derive insights and operationalize processes. These requirements mean that to effectively leverage your data assets:
- Data should be unified across your entire company, even across suppliers, partners, and platforms., eliminating organizational and technology silos.
- Unstructured data should be unlocked and leveraged in your analytics strategy.
- The technology stack should be unified and flexible enough to support use cases ranging from analysis of offline data to real-time streaming and application of ML without maintaining multiple bespoke tech stacks.
- The technology stack should be accessible on-demand, with support for different platforms, programming languages, tools, and open standards compatible with your employees’ existing skill sets.
With these requirements met, you’ll be equipped to maximize your data, whether that means discerning and adapting to changing customer expectations or understanding and optimizing how your data engineers and data scientists spend their time. In coming weeks, we’ll explore aspects of the whitepaper in additional blog posts—but if you’re ready to dive in now, and to steer your tech company or startup towards success by making your data better work for you, click here to download your copy, free of charge.
More Relevant Stories for Your Company

Dataplex Data Lineage: Leverage the Complete Data Story for Better Business Decisions
Today, we are excited to announce the general availability of Dataplex data lineage — a fully managed Dataplex capability that helps you understand how data is sourced and transformed within the organization. Dataplex data lineage automatically tracks data movement across BigQuery, BigLake, Cloud Data Fusion (Preview), and Cloud Composer (Preview), eliminating operational

Transform ‘Dark Data’ from Documents with Document AI, Cloud Functions and Workflows
At enterprises across industries, documents are at the center of core business processes. Documents store a treasure trove of valuable information whether it's a company's invoices, HR documents, tax forms and much more. However, the unstructured nature of documents make them difficult to work with as a data source. We

Boost Database Performance with AlloyDB Index Advisor: The Ultimate Optimization Tool
Intro One of the time consuming tasks for DBAs is to maximize query performance. To optimize slow-running queries, they often have to do detailed analysis, understand optimizer plans, and go through a lot of trial and error before getting to the best set of indexes that help with improved query

Simplifying Unstructured Data Analytics with BigQuery ML and Vertex AI: A Comprehensive Guide
Unstructured data such as images, speech and textual data can be notoriously difficult to manage, and even harder to analyze. The analysis of unstructured data includes use cases such as extracting text from images using OCR, sentiment analysis on customer reviews and simplifying translation for analytics. All of this data
