





6368
Of your peers have already watched this video.
2:15 Minutes
The most insightful time you'll spend today!
What’s Google Cloud Firestore Database and What are its Benefits for Business and Developers?
Cloud Firestore is a NoSQL document database that simplifies storing, syncing, and querying data for your mobile and web apps at global scale.
Cloud Firestore is a fast, fully managed, serverless, cloud-native NoSQL document database that simplifies storing, syncing, and querying data for your mobile, web, and IoT apps at global scale.
Its client libraries provide live synchronization and offline support, while its security features and integrations with Firebase and Google Cloud Platform (GCP) accelerate building truly serverless apps.
Here’s other stuff it’s good at:
Sync data across devices, on or offline
With Cloud Firestore, your applications can be updated in near real time when data on the back end changes. This is not only great for building collaborative multi-user mobile applications, but also means you can keep your data in sync with individual users who might want to use your app from multiple devices.
With Firebase Realtime Database, we felt we had built the best force-plate testing software on the market. Thanks to Cloud Firestore, in only two weeks, we built a system that’s significantly better and includes features we never thought possible to ship on Day 1.
Chris Wales, CTO, Hawkin Dynamics
Cloud Firestore has full offline support, so you can access and make changes to your data, and those changes will be synced to the cloud when the client comes back online. Built-in offline support leverages local cache to serve and store data, so your app remains responsive regardless of network latency or internet connectivity.
Simple and effortless
Cloud Firestore’s robust client libraries make it easy for you to update and receive new data while worrying less about establishing network connections or unforeseen race conditions. It can scale effortlessly as your app grows. Cloud Firestore allows you to run sophisticated queries against your data. This gives you more flexibility in the way you structure your data and can often mean that you have to do less filtering on the client, which keeps your network calls and data usage more efficient.
Enterprise-grade, scalable NoSQL
Cloud Firestore is a fast and fully managed NoSQL cloud database. It is built to scale and takes advantage of GCP’s powerful infrastructure, with automatic horizontal scaling in and out, in response to your application’s load. Security access controls for data are built in and enable you to handle data validation via a configuration language.
6369
Of your peers have already watched this video.
2:15 Minutes
The most insightful time you'll spend today!
What’s Google Cloud Firestore Database and What are its Benefits for Business and Developers?
Cloud Firestore is a NoSQL document database that simplifies storing, syncing, and querying data for your mobile and web apps at global scale.
Cloud Firestore is a fast, fully managed, serverless, cloud-native NoSQL document database that simplifies storing, syncing, and querying data for your mobile, web, and IoT apps at global scale.
Its client libraries provide live synchronization and offline support, while its security features and integrations with Firebase and Google Cloud Platform (GCP) accelerate building truly serverless apps.
Here’s other stuff it’s good at:
Sync data across devices, on or offline
With Cloud Firestore, your applications can be updated in near real time when data on the back end changes. This is not only great for building collaborative multi-user mobile applications, but also means you can keep your data in sync with individual users who might want to use your app from multiple devices.
With Firebase Realtime Database, we felt we had built the best force-plate testing software on the market. Thanks to Cloud Firestore, in only two weeks, we built a system that’s significantly better and includes features we never thought possible to ship on Day 1.
Chris Wales, CTO, Hawkin Dynamics
Cloud Firestore has full offline support, so you can access and make changes to your data, and those changes will be synced to the cloud when the client comes back online. Built-in offline support leverages local cache to serve and store data, so your app remains responsive regardless of network latency or internet connectivity.
Simple and effortless
Cloud Firestore’s robust client libraries make it easy for you to update and receive new data while worrying less about establishing network connections or unforeseen race conditions. It can scale effortlessly as your app grows. Cloud Firestore allows you to run sophisticated queries against your data. This gives you more flexibility in the way you structure your data and can often mean that you have to do less filtering on the client, which keeps your network calls and data usage more efficient.
Enterprise-grade, scalable NoSQL
Cloud Firestore is a fast and fully managed NoSQL cloud database. It is built to scale and takes advantage of GCP’s powerful infrastructure, with automatic horizontal scaling in and out, in response to your application’s load. Security access controls for data are built in and enable you to handle data validation via a configuration language.
Google Cloud’s Firebase Realtime Database and BigQuery AllowsCastbox to Ramp Up Customer Experience

8163
Of your peers have already read this article.
3:30 Minutes
The most insightful time you'll spend today!
Demand for spoken audio content such as podcasts remains robust despite the proliferation of video services and other entertainment options for consumers. Shibin Li, Co-founder of Castbox, credits growth of the global podcast platform to the following: speed and availability, market-leading features, the proliferation of smart devices to deliver audio content, and activities — such as driving and working around the house — that make consuming video difficult.
Founded in 2016 and headquartered in Beijing, China, Castbox enables users to locate, access, and create spoken audio content. Available on iOS and Android, Castbox supports 50 million podcasts, on-demand radio programs, and audiobooks in 70 languages from 175 countries. The platform hosts about 2 million users per day and is the largest podcast platform on Android.
Castbox includes a range of features that build on its core service to provide a high-quality user experience. These features include curated podcast recommendations and in-audio search.
A combination of services
At its inception, Castbox relied on a combination of a multinational cloud services, as well as Google Cloud Platform (GCP) services, including the Google BigQuery analytics data warehouse and Cloud APIs to provide programmatic interfaces with Google Cloud services, and a range of services from the Google mobile development platform Firebase.
However, as Castbox matured and its user base expanded, the business increased its reliance on Google Cloud Platform and Firebase.
“We needed to access stable cloud services as we could not tolerate long periods of downtime that would compromise the user experience,” says Li. “Furthermore, we had to support up to 50,000 concurrent connections, and potentially more in future, without disruption.”
“Based on our analysis of the data in Google BigQuery, we can determine what type of content users are listening to, how long they like to listen to it, and when they like to listen to it. This allows us to recommend similar podcasts to each user based on the preferences he or she expressed, encouraging activity on and return visits to our platform.”
—Shibin Li, Co-Founder, Castbox
Competitive differentiation
Castbox also found machine learning-powered Google Cloud Platform APIs could help deliver features, such as in-audio search, that differentiate the podcast platform from its competitors. In addition, Firebase SDKs and Firebase A/B Testing would enable Castbox to create and analyze new applications, as well as make adjustments based on user feedback. Firebase Realtime Database would allow the business to support tens of thousands of concurrent user connections.
The diligence of the Google Cloud team in advising Li and her team about forthcoming products and services also swayed Castbox towards Google technologies. The business gained the opportunity with Google to join several programs that offered early access to Google innovations.
Signature in-audio search service
Castbox now uses Google Cloud Platform services in the Tokyo, Japan, and U.S. East regions. Cloud Speech-to-Text API plays a key role in delivering Castbox’s signature in-audio search service. This service enables users to search transcriptions of audio content on the platform for words or phrases. The search results incorporate the title of the podcast and the search term in context (for example, within the sentence or sentence excerpt in which it appears). Each use of the word or phrase is time-stamped so it can easily be found. The API enables Castbox developers to apply neural network algorithms to achieve audio-to-text conversion accuracy rates of greater than 96%, while search queries typically experience latency of just 50 milliseconds.
In addition, the latency of comparison data, converting audio to text, is only about 250 milliseconds, contributing to the processing of about 12 minutes worth of audio to text in just 10 minutes. “We can process about 20 hours of audio files in one day,” Li says. “This enables us to transcribe and index all the new episodes of a podcast in that period.”
50,000 concurrent connections
With Firebase Realtime Database, Castbox now supports up to 50,000 concurrent connections to its platform with an average latency per connection of just 10 milliseconds. “Firebase Realtime Database also allows us to continue operating in offline mode, which is extremely helpful if we experience any network disruptions,” Li explains. “When we come back online again, any data is simply synchronized with the database.”
Google BigQuery and the analytics capabilities of Firebase SDKs also enable Castbox to monitor and analyze user behaviors. “Based on our analysis of the data in Google BigQuery, we can determine what type of content users are listening to, how long they like to listen to it, and when they like to listen to it,” Li explains. “This allows us to recommend similar podcasts to each user based on the preferences he or she expressed, encouraging activity on and return visits to our platform.”
“Given our queries may span up to 40 days of data, we may be analyzing up to 1,200 GB at one time. We have no problem doing this with Google BigQuery.”
—Shibin Li, Co-Founder, Castbox
Castbox also uses its analyses of Google BigQuery data to amend banners and summaries on its platform to encourage users to listen to additional content. Furthermore, the service is prepared to make surprise recommendations of content to users based on the preferences and reactions of users with similar tastes.
“We analyze a pool of data growing at up to 30 GB per day,” Li explains. “Given our queries may span up to 40 days of data, we may be analyzing up to 1,200 GB at one time. We have no problem doing this with Google BigQuery.” These analyses also support Castbox’s decision to start creating original content, such as finance and economic news, for its platform.
Checking weekly changes
Castbox does not rely only on analyzing user data to deliver a high-quality experience. The business aggregates user feedback from emails and Google Play reviews to make weekly changes to its platform. It then uses Firebase A/B Testing to check whether these changes are met with a positive user response.
“We are extremely pleased with Google Cloud Platform and Firebase. We have been able to differentiate ourselves from our competitors and provide an attractive option for users at a time when content and entertainment options are exploding. We have a great opportunity with Google to continue to improve the value of our offering to users and build engagement and loyalty.”
—Shibin Li, Co-Founder, Castbox
Castbox’s positive experiences with Google Cloud Platform are encouraging the business to grow its use of the product. “We are trying to move some more services to Google Cloud Platform because it is very stable and scalable,” Li says. The business is keen to explore the capabilities of Cloud Pub/Sub to provide low latency messaging between applications, Cloud Spanner to deliver a distributed relational database service, and Cloud Dataflow to transform and enrich data in stream and batch modes.
“We are extremely pleased with Google Cloud Platform and Firebase,” Li concludes. “We have been able to differentiate ourselves from our competitors and provide an attractive option for users at a time when content and entertainment options are exploding. We have a great opportunity with Google to continue to improve the value of our offering to users and build engagement and loyalty.”
Migrating From Oracle OLTP System to Cloud Spanner

3981
Of your peers have already read this article.
8:30 Minutes
The most insightful time you'll spend today!
Spanner uses certain concepts differently from other enterprise database management tools, so you might need to adjust your application to take full advantage of its capabilities. You might also need to supplement Spanner with other services from Google Cloud to meet your needs.
Migration constraints
When you migrate your application to Spanner, you must take into account the different features available. You probably need to redesign your application architecture to fit with Spanner’s feature set and to integrate with additional Google Cloud services.
Stored procedures and triggers
Spanner does not support running user code in the database level, so as part of the migration, you must move business logic implemented by database-level stored procedures and triggers into the application.
Sequences
Spanner does not implement a sequence generator, and as explained below, using monotonically increasing numbers as primary keys is an anti-pattern in Spanner. An alternative way to generate a unique primary key is to use a random UUID.
If sequences are required for external reasons, then you must implement them in the application layer.
Access controls
Spanner supports only database-level access controls using IAM access permissions and roles. Predefined roles can give read-write or read-only access to the database.
If you require finer grained permissions, you must implement them at the application layer. In a normal scenario, only the application should be allowed to read and write to the database.
If you need to expose your database to users for reporting, and want to use fine-grained security permissions (such as table- and view-level permissions), you should export your database to BigQuery.
Read the full article for more, including
- Data validation constraints
- Supported data types
- Migration process
- Transferring your data from Oracle to Spanner
- Maintaining consistency between both databases
- Verifying data consistency
- and more.
10167
Of your peers have already watched this video.
1:00 Minutes
The most insightful time you'll spend today!
Predict User Churn on Gaming Apps with Google Analytics Data using BigQuery ML
User retention can be a major challenge for mobile game developers. According to the Mobile Gaming Industry Analysis in 2019, most mobile games only see a 25% retention rate for users after the first day. To retain a larger percentage of users after their first use of an app, developers can take steps to motivate and incentivize certain users to return. But to do so, developers need to identify the propensity of any specific user returning after the first 24 hours.
In this blog post, we will discuss how you can use BigQuery ML to run propensity models on Google Analytics 4 data from your gaming app to determine the likelihood of specific users returning to your app.
You can also use the same end-to-end solution approach in other types of apps using Google Analytics for Firebase as well as apps and websites using Google Analytics 4. To try out the steps in this blogpost or to implement the solution for your own data, you can use this Jupyter Notebook.
Using this blog post and the accompanying Jupyter Notebook, you’ll learn how to:
- Explore the BigQuery export dataset for Google Analytics 4
- Prepare the training data using demographic and behavioural attributes
- Train propensity models using BigQuery ML
- Evaluate BigQuery ML models
- Make predictions using the BigQuery ML models
- Implement model insights in practical implementations
Google Analytics 4 (GA4) properties unify app and website measurement on a single platform and are now default in Google Analytics. Any business that wants to measure their website, app, or both, can use GA4 for a more complete view of how customers engage with their business. With the launch of Google Analytics 4, BigQuery export of Google Analytics data is now available to all users. If you are already using a Google Analytics 4 property, you can follow this guide to set up exporting your GA data to BigQuery.
Once you have set up the BigQuery export, you can explore the data in BigQuery. Google Analytics 4 uses an event-based measurement model. Each row in the data is an event with additional parameters and properties. The Schema for BigQuery Export can help you to understand the structure of the data.
In this blogpost, we use the public sample export data from an actual mobile game app called “Flood It!” (Android, iOS) to build a churn prediction model. But you can use data from your own app or website.
Here’s what the data looks like. Each row in the dataset is a unique event, which can contain nested fields for event parameters.
SELECT *FROM `firebase-public-project.analytics_153293282.events_*`TABLESAMPLE SYSTEM (1 PERCENT)

This dataset contains 5.7M events from over 15k users.
SELECTCOUNT(DISTINCT user_pseudo_id) as count_distinct_users,COUNT(event_timestamp) as count_eventsFROM`firebase-public-project.analytics_153293282.events_*

Our goal is to use BigQuery ML on the sample app dataset to predict propensity to user churn or not churn based on users’ demographics and activities within the first 24 hours of app installation.

In the following sections, we’ll cover how to:
- Pre-process the raw event data from GA4
- Identify users & the label feature
- Process demographic features
- Process behavioral features
- Train classification model using BigQuery ML
- Evaluate the model using BigQueryML
- Make predictions using BigQuery ML
- Utilize predictions for activation
Pre-process the raw event data
You cannot simply use raw event data to train a machine learning model as it would not be in the right shape and format to use as training data. So in this section, we’ll go through how to pre-process the raw data into an appropriate format to use as training data for classification models.
This is what the training data should look like for our use case at the end of this section:

Notice that in this training data, each row represents a unique user with a distinct user ID (user_pseudo_id).
Identify users & the label feature
We first filtered the dataset to remove users who were unlikely to return the app anyway. We defined these ‘bounced’ users as ones who spent less than 10 mins with the app. Then we labeled all remaining users:
- churned: No event data for the user after 24 hours of first engaging with the app.
- returned: The user has at least one event record after 24 hours of first engaging with the app.
For your use case, you can have a different definition of bounce and churning. Also you can even try to predict something else other than churning, e.g.:
- whether a user is likely to spend money on in-game currency
- likelihood of completing n-number of game levels
- likelihood of spending n amount of time in-game etc.
In such cases, label each record accordingly so that whatever you are trying to predict can be identified from the label column.
From our dataset, we found that ~41% users (5,557) bounced. However, from the remaining users (8,031), ~23% (1,883) churned after 24 hours:
SELECTbounced,churned,COUNT(churned) as count_usersFROMbqmlga4.returningusersGROUP BY 1,2ORDER BY bounced

To create these bounced and churned columns, we used the following snippet of SQL code.
...#churned = 1 if last_touch within 24 hr of app installation, else 0IF (user_last_engagement < TIMESTAMP_ADD(user_first_engagement,INTERVAL 24 HOUR),1,0 ) AS churned,#bounced = 1 if last_touch within 10 min, else 0IF (user_last_engagement <= TIMESTAMP_ADD(user_first_engagement,INTERVAL 10 MINUTE),1,0 ) AS bounced,...
You can view the Jupyter Notebook for the full query used for materializing the bounced and churned labels.
Process demographic features
Next, we added features both for demographic data and for behavioral data spanning across multiple columns. Having a combination of both demographic data and behavioral data helps to create a more predictive model.
We used the following fields for each user as demographic features:
geo.countrydevice.operating_systemdevice.language
A user might have multiple unique values in these fields — for example if a user uses the app from two different devices. To simplify, we used the values from the very first user engagement event.
CREATE OR REPLACE VIEW bqmlga4.user_demographics AS (WITH first_values AS (SELECTuser_pseudo_id,geo.country as country,device.operating_system as operating_system,device.language as language,ROW_NUMBER() OVER (PARTITION BY user_pseudo_id ORDER BY event_timestamp DESC) AS row_numFROM `firebase-public-project.analytics_153293282.events_*`WHERE event_name="user_engagement")SELECT * EXCEPT (row_num)FROM first_valuesWHERE row_num = 1 #first engagement);
Process behavioral features
There is additional demographic information present in the GA4 export dataset, e.g. app_info, device, event_params, geo etc. You may also send demographic information to Google Analytics through each hit via user_properties. Furthermore, if you have first-party data on your own system, you can join that with the GA4 export data based on user_ids.
To extract user behavior from the data, we looked into the user’s activities within the first 24 hours of first user engagement. In addition to the events automatically collected by Google Analytics, there are also the recommended events for games that can be explored to analyze user behavior. For our use case, to predict user churn, we counted the number of times the follow events were collected for a user within 24 hours of first user engagement:
user_engagementlevel_start_quickplaylevel_end_quickplaylevel_complete_quickplaylevel_reset_quickplaypost_scorespend_virtual_currencyad_rewardchallenge_a_friendcompleted_5_levelsuse_extra_steps
The following query shows how these features were calculated:
WITHevents_first24hr AS (SELECTe.*FROM`firebase-public-project.analytics_153293282.events_*` eJOINbqmlga4.returningusers rONe.user_pseudo_id = r.user_pseudo_idWHERETIMESTAMP_MICROS(e.event_timestamp) <= r.ts_24hr_after_first_engagement)SELECTuser_pseudo_id,SUM(IF(event_name = 'user_engagement', 1, 0)) AS cnt_user_engagement,# ... repeated for all behavior data ...SUM(IF(event_name = 'use_extra_steps', 1, 0)) AS cnt_use_extra_steps,FROMevents_first24hrGROUP BY1
View the notebook for the query used to aggregate and extract the behavioral data. You can use different sets of events for your use case. To view the complete list of events, use the following query:
SELECTevent_name,COUNT(event_name) as event_countFROM`firebase-public-project.analytics_153293282.events_*`GROUP BY 1ORDER BYevent_count DESC
After this we combined the features to ensure our training dataset reflects the intended structure. We had the following columns in our table:
- User ID:
user_pseudo_id
- Label:
churned
- Demographic features
countrydevice_osdevice_language
- Behavioral features
cnt_user_engagementcnt_level_start_quickplaycnt_level_end_quickplaycnt_level_complete_quickplaycnt_level_reset_quickplaycnt_post_scorecnt_spend_virtual_currencycnt_ad_rewardcnt_challenge_a_friendcnt_completed_5_levelscnt_use_extra_stepsuser_first_engagement
At this point, the dataset was ready to train the classification machine learning model in BigQuery ML. Once trained, the model will output a propensity score between churn (churned=1) or return (churned=0) indicating the probability of a user churning based on the training data.
Train classification model
When using the CREATE MODEL statement, BigQuery ML automatically splits the data between training and test. Thus the model can be evaluated immediately after training (see the documentation for more information).
For the ML model, we can choose among the following classification algorithms where each type has its own pros and cons:

Often logistic regression is used as a starting point because it is the fastest to train. The query below shows how we trained the logistic regression classification models in BigQuery ML.
CREATE OR REPLACE MODEL bqmlga4.churn_logregTRANSFORM(EXTRACT(MONTH from user_first_engagement) as month,EXTRACT(DAYOFYEAR from user_first_engagement) as julianday,EXTRACT(DAYOFWEEK from user_first_engagement) as dayofweek,EXTRACT(HOUR from user_first_engagement) as hour,* EXCEPT(user_first_engagement, user_pseudo_id))OPTIONS(MODEL_TYPE="LOGISTIC_REG",INPUT_LABEL_COLS=["churned"]) ASSELECT*FROMbqmlga4.train
We extracted month, julianday, and dayofweek from datetimes/timestamps as one simple example of additional feature preprocessing before training. Using TRANSFORM() in your CREATE MODEL query allows the model to remember the extracted values. Thus, when making predictions using the model later on, these values won’t have to be extracted again. View the notebook for the example queries to train other types of models (XGBoost, deep neural network, AutoML Tables).
Evaluate model
Once the model finished training, we ran ML.EVALUATE to generate precision, recall, accuracy and f1_score for the model:
SELECT*FROMML.EVALUATE(MODEL bqmlga4.churn_logreg)

The optional THRESHOLD parameter can be used to modify the default classification threshold of 0.5. For more information on these metrics, you can read through the definitions on precision and recall, accuracy, f1-score, log_loss and roc_auc. Comparing the resulting evaluation metrics can help to decide among multiple models.Furthermore, we used a confusion matrix to inspect how well the model predicted the labels, compared to the actual labels. The confusion matrix is created using the default threshold of 0.5, which you may want to adjust to optimize for recall, precision, or a balance (more information here).
SELECTexpected_label,_0 AS predicted_0,_1 AS predicted_1FROMML.CONFUSION_MATRIX(MODEL bqmlga4.churn_logreg)

This table can be interpreted in the following way:

Make predictions using BigQuery ML
Once the ideal model was available, we ran ML.PREDICT to make predictions. For propensity modeling, the most important output is the probability of a behavior occurring. The following query returns the probability that the user will return after 24 hrs. The higher the probability and closer it is to 1, the more likely the user is predicted to return, and the closer it is to 0, the more likely the user is predicted to churn.
SELECTuser_pseudo_id,returned,predicted_returned,predicted_returned_probs[OFFSET(0)].prob as probability_returnedFROMML.PREDICT(MODEL bqmlga4.churn_logreg,(SELECT * FROM bqmlga4.train)) #can be replaced with a proper test dataset
Utilize predictions for activation
Once the model predictions are available for your users, you can activate this insight in different ways. In our analysis, we used user_pseudo_id as the user identifier. However, ideally, your app should send back the user_id from your app to Google Analytics. In addition to using first-party data for model predictions, this will also let you join back the predictions from the model into your own data.
- You can import the model predictions back into Google Analytics as a user attribute. This can be done using the Data Import feature for Google Analytics 4. Based on the prediction values you can Create and edit audiences and also do Audience targeting. For example, an audience can be users with prediction probability between 0.4 and 0.7, to represent users who are predicted to be “on the fence” between churning and returning.
- For Firebase Apps, you can use the Import segments feature. You can tailor user experience by targeting your identified users through Firebase services such as Remote Config, Cloud Messaging, and In-App Messaging. This will involve importing the segment data from BigQuery into Firebase. After that you can send notifications to the users, configure the app for them, or follow the user journeys across devices.
- Run targeted marketing campaigns via CRMs like Salesforce, e.g. send out reminder emails.
You can find all of the code used in this blogpost in the Github repository:
What’s next?
Continuous model evaluation and re-training
As you collect more data from your users, you may want to regularly evaluate your model on fresh data and re-train the model if you notice that the model quality is decaying.
Continuous evaluation—the process of ensuring a production machine learning model is still performing well on new data—is an essential part in any ML workflow. Performing continuous evaluation can help you catch model drift, a phenomenon that occurs when the data used to train your model no longer reflects the current environment.
To learn more about how to do continuous model evaluation and re-train models, you can read the blogpost: Continuous model evaluation with BigQuery ML, Stored Procedures, and Cloud Scheduler
More resources
If you’d like to learn more about any of the topics covered in this post, check out these resources:
- BigQuery export of Google Analytics data
- BigQuery ML quickstart
- Events automatically collected by Google Analytics 4
- Qwiklabs: Create ML models with BigQuery ML
Or learn more about how you can use BigQuery ML to easily build other machine learning solutions:
- How to build demand forecasting models with BigQuery ML
- How to build a recommendation system on e-commerce data using BigQuery ML
Let us know what you thought of this post, and if you have topics you’d like to see covered in the future! You can find us on Twitter at @polonglin and @_mkazi_.Thanks to reviewers: Abhishek Kashyap, Breen Baker, David Sabater Dinter.
Vodafone Leverages Google Cloud to Aid COVID-19 Frontline with Anonymized Insights on Population Mobility

11188
Of your peers have already read this article.
1:30 Minutes
The most insightful time you'll spend today!
Editor’s note: When Europe’s largest mobile communications company, Vodafone, was asked by the European Commission to help understand population movement across the European Union and the UK to help fight COVID-19, it was able to provide anonymized mobile network-based insights to answer the call. Here’s how Vodafone, with the support of Google Cloud, rapidly mobilized the COVID-19 frontline, while respecting its customers’ privacy.
With the emergence of COVID-19 in early 2020, the European Commission—the executive branch of the European Union (EU)—knew that technology would be instrumental in its fight to control the pandemic. With various lockdowns imposed across its member states, the Commission was keen to predict and prevent the spread of COVID-19 and to manage the related social, political and financial impacts.
Mobile network data helps track COVID-19 across the EU
Mobile networks produce location data, which can be turned into useful anonymous insights to understand population movement within a geographic area. The European Commission, working with mobile industry association GSMA (Groupe Speciale Mobile Association), asked Europe’s major mobile phone operators for help in producing insights to support the fight against COVID-19. As the largest mobile network operator within the EU, Vodafone saw this as a critical opportunity to participate.
Vodafone had previous experience of using mobile network data to support pandemic research. For example, in 2019, Vodafone provided mobility pattern analysis to help track the spread of Malaria in Mozambique. And, during the early stages of the COVID-19 pandemic (prior to working with the European Commission), Vodafone assisted the Italian and Spanish governments in understanding their citizens’ mobility patterns. Vodafone had also previously offered anonymized and aggregated population mobility insights to support public transport and tourism authorities and retail organizations in a number of countries. Consequently, Vodafone was perfectly placed to play a greater role in supporting the European Commission’s response to the pandemic.
When asked to assist the European Commission, Vodafone first considered how it could safely share its data with the governing body without providing details on the individual movements of its customers. It realized it could achieve this through an elaborate set of anonymization and aggregation techniques. Insights are aggregated from a minimum of 50 users and Vodafone only shared these anonymous insights and never the actual raw data with the Commission. As specified by the EU, these insights are then presented onto a large geographical region, typically a city or a county with thousands of people living in that area.
These insights illustrate how people move, helping to determine how lockdowns and self-isolation measures were impacting behaviors.
Using Google Cloud to collate and store population mobility data
In April 2020, Vodafone began migrating its operations, including its mobile data, to Google Cloud on servers in Europe and the UK with elaborate security safeguards, including encryption, building on a previous partnership.
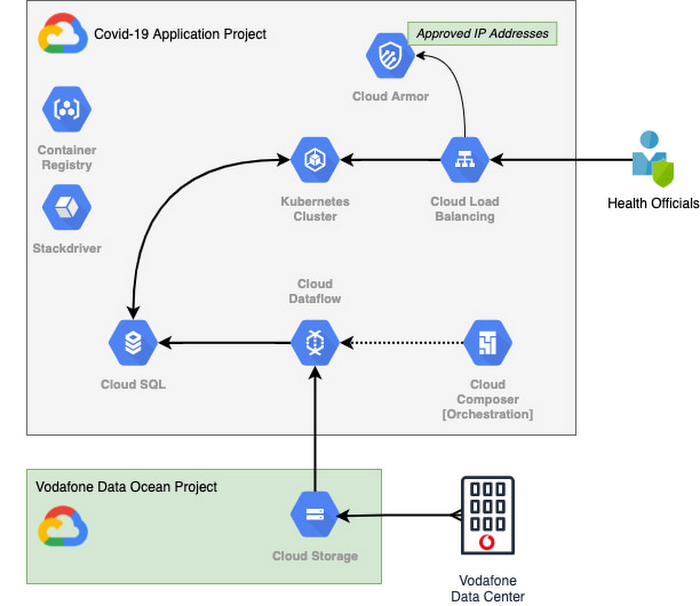
With the data residing in EU and UK data centers and not the United States, Vodafone could then retrieve anonymous insights from Google Cloud Storage instantaneously. Before supplying any information to the European Commission, however, Vodafone used Dataflow to validate the data and run a series of tests to ensure the database had accurate data, before ingesting and archiving the relevant metrics. For instant access, the data was then made available to the European Commission using a Redis database on Google Kubernetes Engine.
To ensure aggregate Vodafone customer data was always safe, secure, and anonymous, all entry points to the front-end were protected behind Google Cloud Armor, where only specific IP addresses were allowed. Using these tools, seamless data pipelines fed in predefined key performance indicators from each specified European market. While data quality measures ensured the definitions for metrics across markets were consistent and could be accurately compared.
The architecture (pictured below) shows how Vodafone integrated and anonymized its data on Google Cloud.
Live interactive dashboard shows population mobility in real-time
With its data integrated on Google Cloud, Vodafone created a live, interactive dashboard to track mobility patterns and share relevant information with the European Commission in real-time.
The European Commission Joint Research Center (JRC) was able to gather valuable information from these insights, which enabled them to see where population mobility was aiding the spread of the disease, when cross-referenced with health data. It could also assess the implications of lockdowns on different populations and forecast cross-country spreading.
Mobile data aids disease modeling for multiple stakeholders
The Vodafone data became instrumental in modeling the likely course of the disease too. For example, the University of Southampton in the UK used it to predict the outcome of different coordinated COVID-19 exit strategies across Europe. This research was published in Science Magazine in September 2020.
The Vodafone data dashboard continues to be used by individual governments, NGOs and organizations to further investigate the impacts of the pandemic and to measure the effectiveness of response strategies alongside the rollout of vaccination programs. The project also helped Vodafone win a DataIQ award for most effective stakeholder engagement.
Using the learnings from this project, Vodafone has been able to adapt its own B2B solution, called Vodafone Analytics, by adaptIng and migrating the code to work in Google Cloud Platform. This solution has been rolled out across Germany, Greece, Portugal and South Africa, and new countries are being onboarded every day. Vodafone Analytics already has more than 100 customers leveraging it for a variety of use cases—Italian fashion retailer OVS, uses it for its smart retail operation, while global real estate company, JLL, uses it to understand the footfall passing through its properties.
Working together, Vodafone and Google Cloud continue to help a range of organizations, governments, and NGOs navigate through the ongoing pandemic, optimize their operations, and help the greater good, without infringing individuals’ fundamental rights to privacy.
To learn more about Google Cloud and Vodafone, watch our full interview here.
More Relevant Stories for Your Company

Boost Database Performance with AlloyDB Index Advisor: The Ultimate Optimization Tool
Intro One of the time consuming tasks for DBAs is to maximize query performance. To optimize slow-running queries, they often have to do detailed analysis, understand optimizer plans, and go through a lot of trial and error before getting to the best set of indexes that help with improved query

Fairygoodboss and Google Cloud Tied to Advancing Diversity and Female Leadership at Workplaces
May is Asian American Pacific Islander Heritage Month — a time for us to come together to celebrate and remember the important people and history of Asian and Pacific Island heritage. This feature highlights founder Georgene Huang and how her startup Fairygodboss uses easy to use Google Cloud tools to

Using Google Cloud’s Backup and DR Service with Logging and Monitoring Tools
Backup and DR data is a valuable business asset, and ensuring that it’s safe and accessible is essential. In particular, you want to be able to monitor your backups to ensure that the data is indeed protected and that you can quickly recover it in the event of a disaster,

Built with BigQuery: Retailers Unlock the Value of Data with SoundCommerce
As economic conditions change, retail brands’ reliance on ever-growing customer demand puts these companies at financial and even existential risk. Top-line revenue and active customer growth do not equal profitable growth. Despite multi-billion dollar valuations for some brands, especially those operating the direct-to-consumer model, the rising costs of meeting shoppers’
