





3923
Of your peers have already watched this video.
26:56 Minutes
The most insightful time you'll spend today!
Teamwork from anywhere: G Suite’s vision for content collaboration
So the world has changed. We all know that the COVID-19 pandemic has fundamentally shifted where we work, when we work, and how we work.
And during this time period, there has been a dramatic increase in the number of people working from home. It went from just 13% before to 47% in April 2020. And these numbers are likely to be greater today with upcoming fluctuations as companies figure out how to return to work. We are all now operating in this new normal together.
Overnight, we lost the ability to build face-to-face connections with our teams, to work hand-in-hand on a project in the same room with the real-time back and forth exchange of ideas, and to just be able to stop by someone’s desk to ask them for feedback on a document.
Now, our need to collaborate and operate effectively as a team hasn’t changed through all this. But being remote has made that so much harder. And in this new environment, virtual collaboration is no longer just a strategic priority. But needs to be a necessity for all organizations. Now across the entire world, we saw organizations had to react quickly to the disruptions that were caused by COVID-19 in order to keep going.
In this video, find out how teams across the world are collaborating to enable faster decision-making, increasing productivity, and enhancing customer experience.
Google Cloud VMware Engine Achieves HIPAA Compliance
6983
Of your peers have already read this article.
1:30 Minutes
The most insightful time you'll spend today!
We are excited to announce that as of April 1, 2021, Google Cloud VMware Engine is covered under the Google Cloud Business Associate Agreement (BAA), meaning it has achieved HIPAA compliance. Healthcare organizations can now migrate and run their HIPAA-compliant VMware workloads in a fully compatible VMware Cloud Verified stack running natively in Google Cloud with Google Cloud VMware Engine, without changes or re-architecture to tools, processes, or applications.
Healthcare organizations increasingly use cloud platforms to personalize patient care, analyze large datasets more effectively, enhance research and development collaboration, and share medical knowledge. Leveraging cloud platforms can also help healthcare organizations increase the privacy and security of information systems, including protected health information (PHI), and, as a result, better comply with applicable laws and regulations while reducing the burden of compliance. For PHI, the Health Insurance Portability and Accountability Act of 1996 (HIPAA) set standards in the United States to protect individually identifiable health information. HIPAA applies to health plans, most healthcare providers, and healthcare clearinghouses that manage PHI electronically, and to persons or entities that perform certain functions on their behalf.
With Google Cloud, organizations can leverage solutions that enable secure, continuous patient care and data-driven clinical and operational decisions with ease, while being empowered with collaboration and productivity tools. Further, Google Cloud Platform supports HIPAA compliance. We offer HIPAA-regulated customers the same products at the same pricing that is available to all customers, unlike many other cloud providers.
For healthcare organizations that leverage VMware on-premises, having a consistent, cloud-integrated platform that provides seamless access to native cloud services unlocks the opportunity to extend, migrate, and modernize healthcare IT infrastructure and applications in a fast, low-risk manner at their own pace. This is especially important for mission-critical healthcare provider workloads, where having a low-risk way to adopt the cloud is important. Google Cloud VMware Engine offers that solution. By achieving coverage under Google Cloud’s BAA, Google Cloud VMware Engine enables healthcare organizations to realize the benefits of cloud computing and stay on track with their HIPAA compliance efforts without additional complexity. This is very relevant in hybrid scenarios, where customers would like to leverage other native cloud services such as analytics and big data processing, without having to enter into multiple BAAs.
Google Cloud VMware Engine offers dedicated, isolated software-defined datacenter environments with fully redundant and dedicated 100 Gbps networking that are suitable for healthcare organizations to run applications storing and processing PHI data. Customers have the ability to encrypt their virtual storage area network (vSAN) using an external key management server. Healthcare customers can run their workloads in a native VMware environment—vSphere, vCenter, vSAN, NSX-T, and HCX—while benefiting from Google Cloud’s highly performant infrastructure to meet the needs of their workloads. Customers can connect their VMware applications to native Google Cloud services such as BigQuery and artificial intelligence (AI) to derive new insights from existing data and quickly make informed decisions.
Protecting against and mitigating the impact of ransomware attacks is top-of-mind for Healthcare organizations. This requires building a cyber resilience program and back-up strategy to prepare for how users can restore core systems or assets affected by a security (in this case, ransomware) incident. This is a critical function for supporting recovery timelines and lessening the impact of a cyber event so organizations can get back to operating their business. Google Cloud VMware Engine in combination with Google Cloud first party solutions such as Actifio Go, or partner solutions such as NetApp CVO can provide an efficient way to recover incremental point-in-time backups along with on-demand provisioning of new compute to recover both data and infrastructure from Ransomware attacks quickly and efficiently.
Healthcare customers can also use Google Cloud VMware Engine as a disaster recovery (DR) target for their on-premises VMware workloads. Healthcare organizations also need a business continuity plan for their mission critical applications. When a disaster occurs, hospitals need their data protected so they can quickly get back to treating patients. It is a HIPAA requirement that healthcare organizations must be able to recover from a natural disaster. Google Cloud VMware Engine offers a like-for-like cost-effective DR target for these customers. The DR environment can be operated without new training using the same tools as their on-premises deployment. Google Cloud VMware Engine is currently available in 12 regions across the globe including three regions in the US, which means our regional and multi-national customers can take advantage of this service for geographic diversification as well.
If you are interested in understanding more and taking advantage of Google Cloud VMware Engine, contact your Google sales team now.
For details, see HIPAA compliance on Google Cloud Platform.
4429
Of your peers have already watched this video.
1:32 Minutes
The most insightful time you'll spend today!
How the UK’s Football Association Turns to Tech to Ensure its 29 Teams Deliver World-Class Performance
The FA is an iconic British institution responsible for overseeing all aspects of football in the UK, from the grassroots club level across the country to the national teams who play at Wembley.
However, even icons like The FA must evolve to stay at the top of their game and they realized their old methods of pen and paper needed to change.
So The FA partnered with Google Cloud to transform itself into a digital leader. The first step was to implement G Suite to get all 29 professional national teams on the same page.
For all 350+ staff at St. George’s Park training facility and coaches throughout the country and on the road, G Suite provides an intuitive and easy way for all these entities to work together.
Coaches could communicate through Hangout; analysts could
compile and share data in Sheets; AI training plans could be distributed
and executed using Slides; and Drive helped support players on the
move, giving immediate access to important information, like dietary
requirements, training data, travel docs and more.
Watch the video to find out more.
Expert Takeaways on API Strategies from The State of API Economy 2021 Report

5753
Of your peers have already read this article.
8:00 Minutes
The most insightful time you'll spend today!
Did you know API traffic for Apigee customers increased 46% year-over-year, to 2.21 trillion calls, between 2019 and 2020? If you have more questions on APIs trends and their role in disrupting enterprises digitally, you can catch up on key take aways from the Google Cloud’s State of API Economy 2021 report and insights from Google’s experts on API-best practices.
Active Assist Expands Globally: Unleashing Cloud Optimization Insights Worldwide

1293
Of your peers have already read this article.
3:30 Minutes
The most insightful time you'll spend today!
Active Assist provides insights and recommendations to help Google Cloud customers proactively optimize their cloud environments for cost, security, performance, and sustainability. If you’re like most customers, you’ve likely encountered these insights and recommendations in the console — either in the Recommendations Hub or embedded on a resource page, like IAM or the VM list pages. (Note that for the rest of this post, we’ll use the word “recommendations” to mean “insights and recommendations.”)
We heard from customers who love recommendations that it should be easier to discover and work with these valuable suggestions across an entire organization, so last year we launched the Recommendations BigQuery export feature to Preview. This allows you to automatically export the recommendations to a BigQuery dataset, which you can then investigate with tools like DataStudio or Looker, and integrate with your company’s existing monitoring solutions and workflows.
Many of you have told us how powerful this feature is, so we’ve been working hard on improvements to make it even more useful. We’re happy to announce that BQ Export 1.0 is now in GA, and that BQ Export 2.0 is in Preview, with new support for Billing Account-level recommendations and cost optimization recommendations that include discount information. This post will cover what’s new with Active Assist BQ Export, as well as a couple other new features of Active Assist.
New features to Active Assist BigQuery Export
Before we dive into the details, if you’re new to Recommendations BQ Export check out our handy getting started guide. It covers the permissions you’ll need and how to set up the export, including instructions for using a service account. It also includes some sample queries and instructions for interacting with the data using Google Sheets. You may also want to check out our prior blog post showing how to optimize your cloud spend with BigQuery and Looker.
Now, on to what’s new!
1. Non-project scoped recommendations
You can now see non-project scoped recommendations, such as billing account, organization, and folder-level recommendations in your export to BigQuery. This ensures that in your export, you are able to see the full portfolio of recommendations that are available to you.
2. Custom contract Pricing
If you have any applicable custom contract pricing for your company, your cost-related recommendations now take those into account (based on your historical costs) in the cost saving calculation when you export them to BigQuery. This will ensure that you have the most accurate cost savings data we have for you and your organization to help you make the best judgment and prioritization when choosing to adopt recommendations. However, you must have the correct permissions first in order to see the custom contract pricing. If the user executing the export to BigQuery does not have the correct permissions, you may continue to see list pricing in your estimated savings. Also, note that the console UI and the Recommender API already have this support.
3. Export now available globally
Customers outside of the US can now set up an export of recommendations to a BigQuery dataset.
Improvements to Active Assist discoverability and usability
1. Global Recommender Viewer role: You can now add the global Recommender Viewer role, which gives you view access to all insights and recommendations available to you, simplifying permission management for new recommenders. Newly launched recommendations will also automatically be added as they become generally available.
2. Dismiss recommendations via Recommender API: You can now directly dismiss recommendations via our API, allowing you to focus on the recommendations you care about and work more efficiently.
3. Shareable links: Another feature that quietly launched recently is the availability of shareable URLs that link to recommendation details in the console. You can access these links in the UI from the upper right of the details panel of any recommendation.
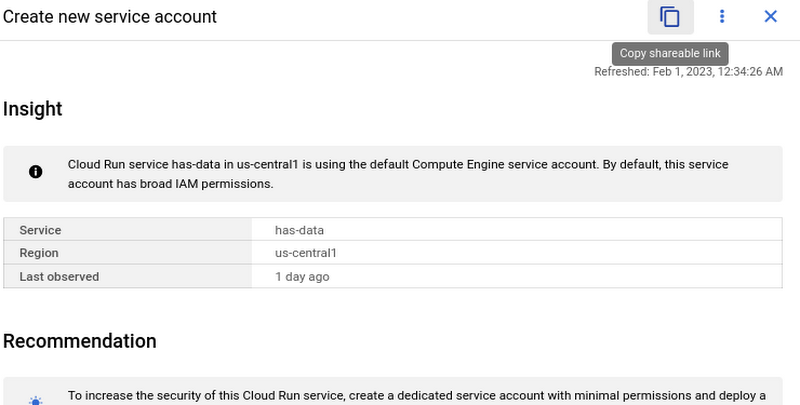
However, these links become even more powerful when combined with Recommendations BigQuery Export. The URLs all have a standard format. This means that within the BigQuery export tables you can easily calculate a new column containing these links using an expression like:
“https://console.cloud.google.com/home/recommendations/view-link/” +
name +
“?project=” +
cloud_entity_id
This example is for project level recommendations (where cloud_entity_type = PROJECT_NUMBER).
For cloud_entity_type = FOLDER, use:
“https://console.cloud.google.com/home/recommendations/view-link/” +
name +
“?folder=” +
cloud_entity_id
For cloud_entity_type = ORGANIZATION, use
“https://console.cloud.google.com/home/recommendations/view-link/” +
name +
“?organizationId=” +
cloud_entity_id
These links can then be embedded in your reports and dashboards, or used by other BigQuery clients.
As a reminder, if you’re interested in setting up reports or dashboards using Recommendations BigQuery Export, take a look at this previous blog post for some great ideas, or you can reference our getting started guide. If you have any feedback, please feel free to reach out to active-assist-feedback@google.com.
CARTO’s Data Visualization Powered by Google Cloud and deck.g

4096
Of your peers have already read this article.
7:00 Minutes
The most insightful time you'll spend today!
Editor’s note: Today’s blog post is from Alberto Asuero, CTO of CARTO, the location intelligence platform. Today he shares more details about the source of the data for advanced data visualizations created with Google Maps Platform and deck.gl and how the CARTO platform enables this workflow.
During Google Cloud Next in October, the Google team announced the newest release of the deck.gl visualization library, thanks to a collaboration with our geospatial company CARTO and the vis.gl Technical Steering Committee (TSC). The deck.gl release includes a deep integration with the new WebGL-powered features in the Maps JavaScript API that allows deck.gl to render 2D and 3D visualizations directly on the Google basemap.
Our team built an example app that visualizes a variety of data sources that show the potential for electrification of truck fleets in Texas. This app showcases the different types of advanced data visualizations that can be created with Google Maps Platform and deck.gl. Today, I want to share more details about the source of the data for these visualizations and how the CARTO platform enables this workflow.
Google Cloud provides a strong serverless data warehousing solution, BigQuery, with support for geospatial queries. When you are dealing with spatial data, creating maps to explore and visualize these datasets is an important and common need. The CARTO Spatial Extension for BigQuery provides an easy way to create connections to the data warehouse, design a map with data coming from BigQuery tables, and then add these visualizations to a web app using deck.gl.
Making a simple map
To create a simple map using the CARTO platform, you can sign up for a trial account. Once you have signed in, you can set up a connection to your BigQuery instance using a service account. Then, you can go to the Data Explorer and browse the available datasets to find the table you want to use as the datasource in your map. For more information, check out the CARTO documentation.
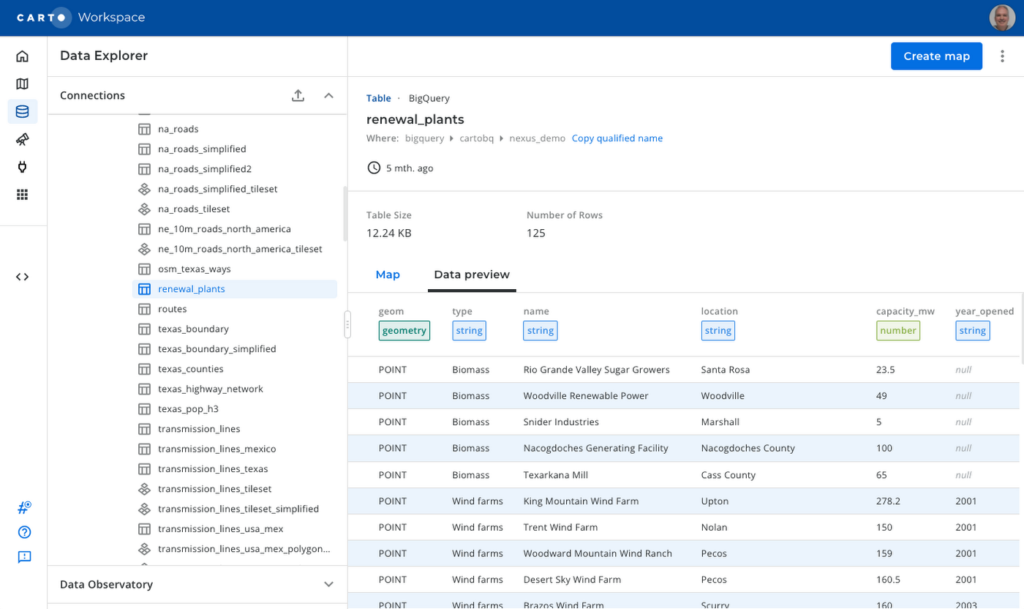
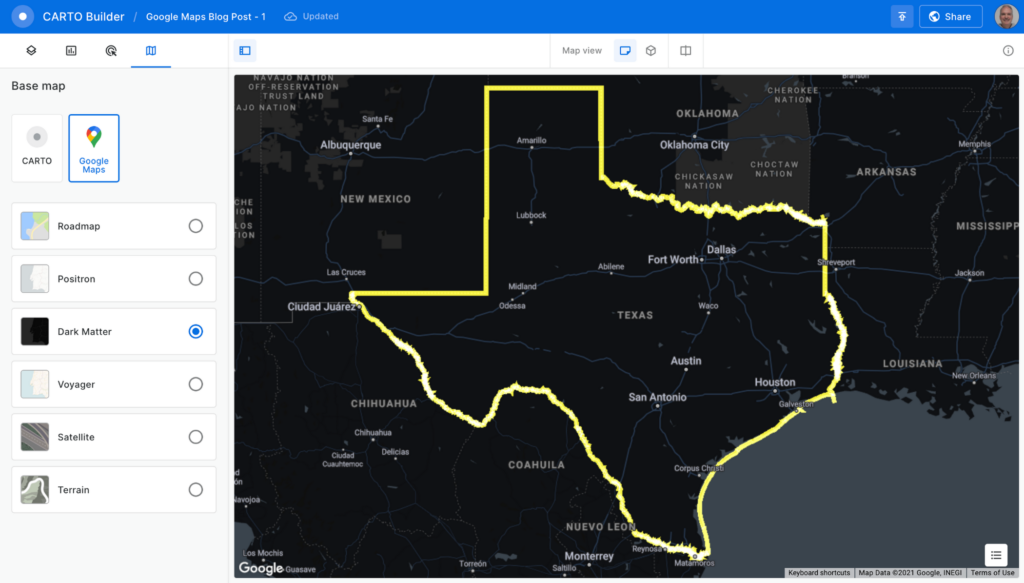
To create a visualization of power transmission lines in Texas, you can start with the Texas state boundary to provide some context. In the Data Explorer, you can preview the table and click the “Create map” button in the top-right corner to start designing your visualization.
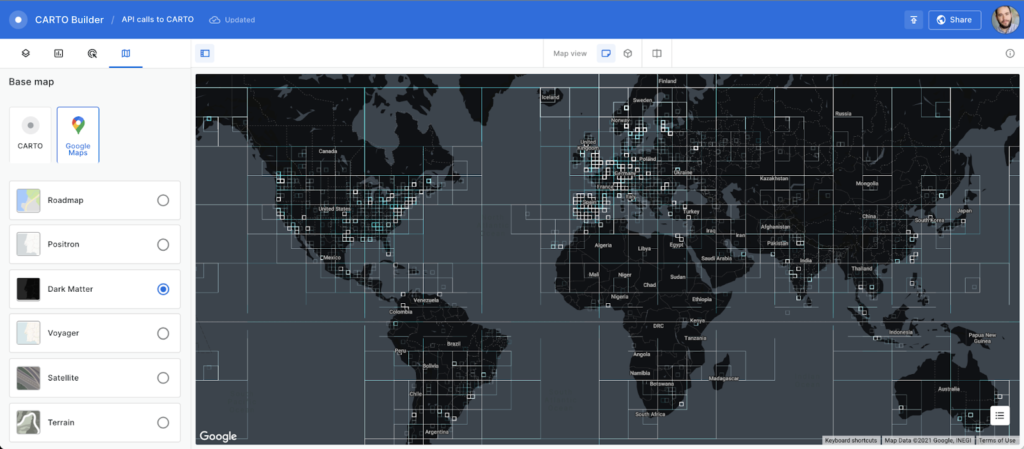
Using the CARTO Builder map making tool, select one of the available Google vector basemap styles and customize the layer style.
You can visualize tables and the results from queries executed in the data warehouse, which is a powerful feature because you can also execute spatial analysis functions using SQL, including those from the CARTO Analytics Toolbox. In this case, you can intersect the lines in the table containing all the U.S. transmission lines within the Texas boundary. Click on the “Add source from…” button and select the “Custom Query (SQL)” option to add the following query:
SELECT *FROM cartobq.nexus_demo.transmission_linesWHERE ST_INTERSECTS(geometry,(SELECT geom FROM cartobq.nexus_demo.texas_boundary_simplified));
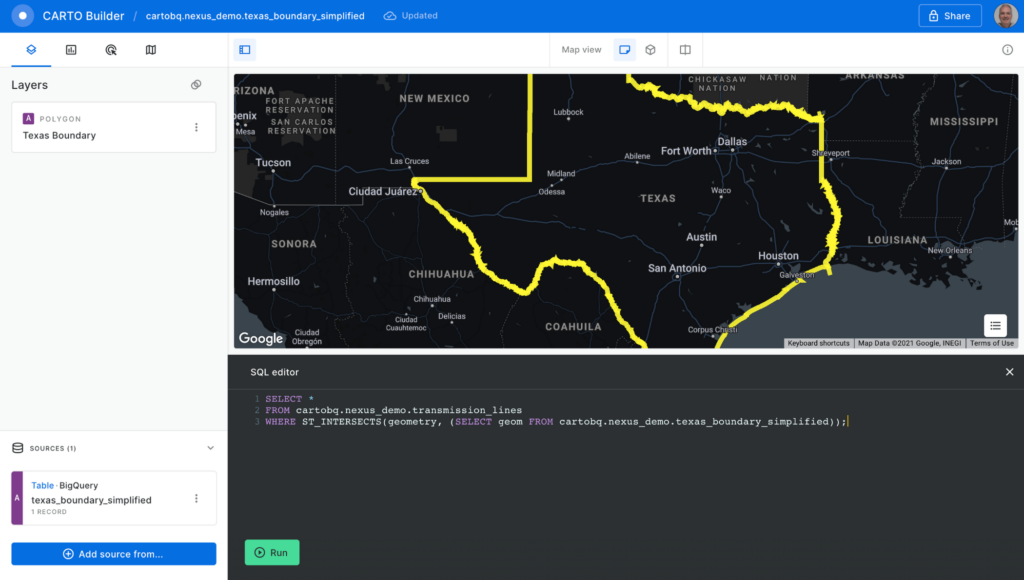
Click the “Run” button, and the query is executed in BigQuery. The results are sent back to the Builder tool. Perform some style customizations in the new layer, and your map is ready.
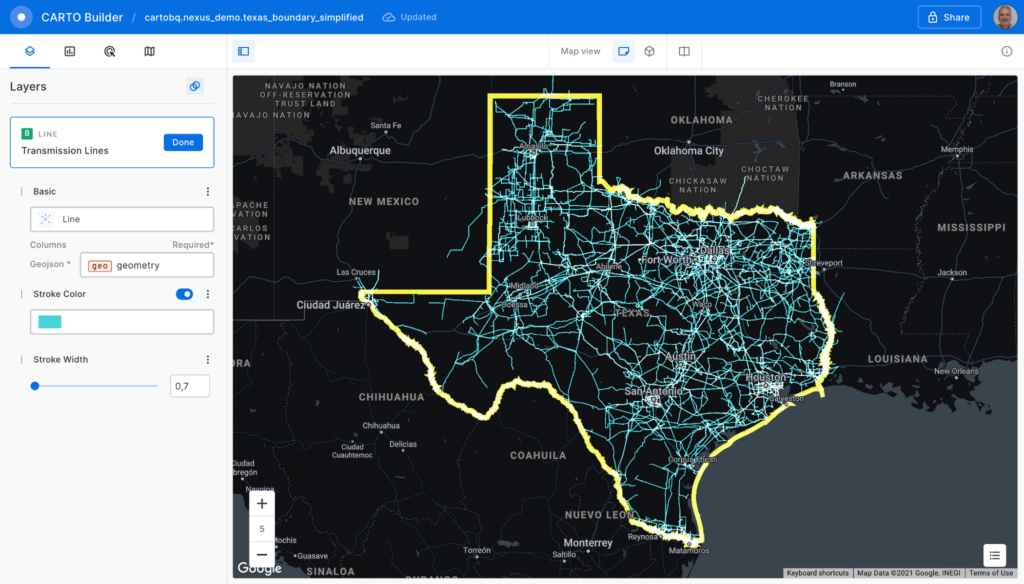
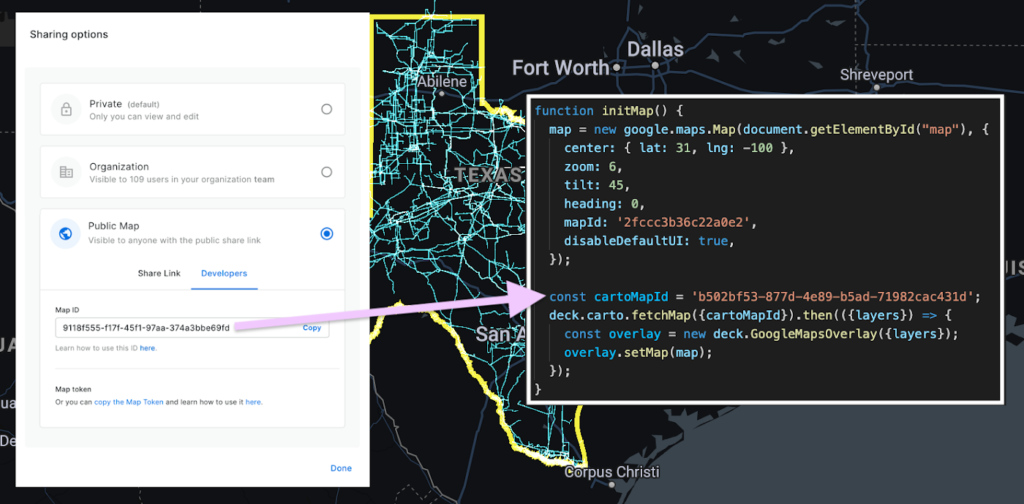
Before adding the map to the Google Maps Platform application, you’ll need to make it public. Click on the “Share” button and select the “Developers” tab to copy the map ID.
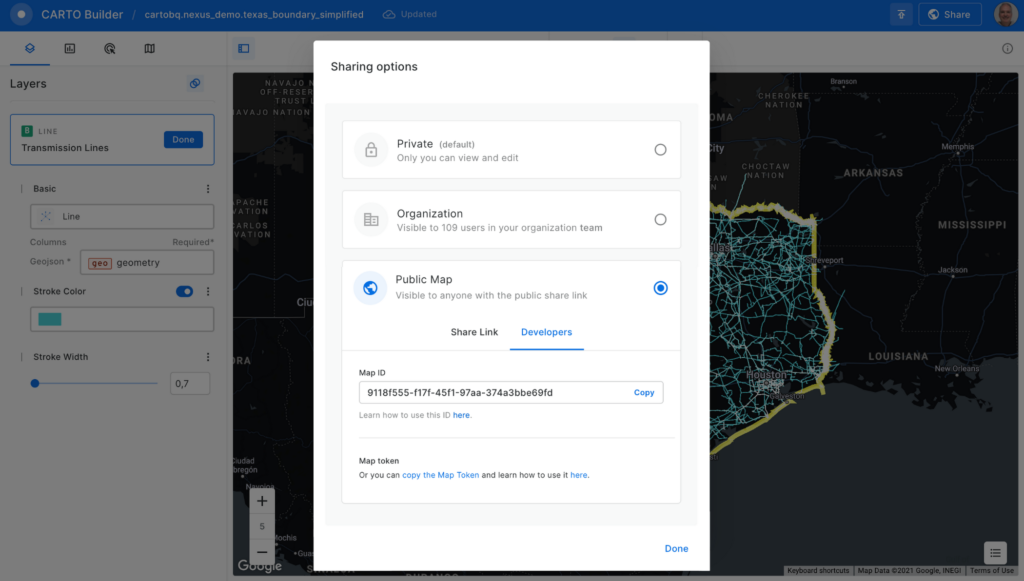
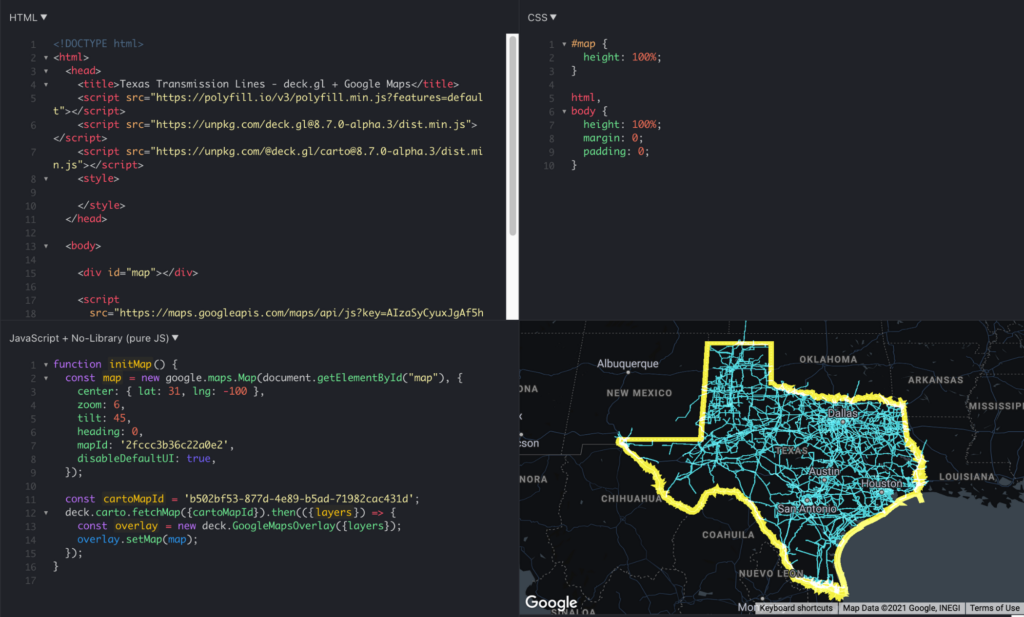
Now, you can add the visualization into your Google Maps Platform application, which is as easy as adding these four lines of code:
const cartoMapId = 'b502bf53-877d-4e89-b5ad-71982cac431d'; deck.carto.fetchMap({cartoMapId}).then(({layers}) => { const overlay = new deck.GoogleMapsOverlay({layers}); overlay.setMap(map); });
You can use the map ID copied from CARTO Builder to call the fetchMap function. This function connects to the platform and retrieves all the information needed for the visualization, including a collection of deck.gl layers with all the styling properties you’ve specified. Create an instance of the deck.gl GoogleMapsOverlay with this collection of layers and add it to the map.
You can see the full example in this fiddle.
Visualizing very large datasets
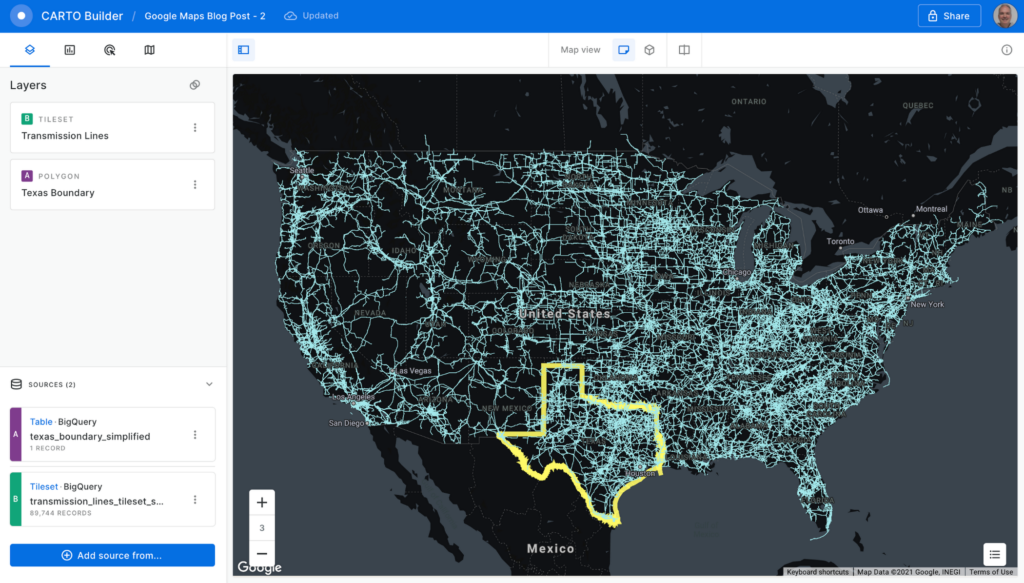
One of the main features of BigQuery is the ability to scale processing to massive datasets. With the CARTO platform, you can also visualize very large datasets using tilesets, an optimized data structure containing pre-generated vector tiles for fast visualization. Tilesets are generated within BigQuery using the Analytics Toolbox functions in a parallelized process that can handle billions of points.
For example, you can create a visualization using tilesets with the whole dataset of transmission lines for the U.S., more than 100MB of geometries.
The issue with these large datasets is that they do not fit in memory all at once, so you need to split them into tiles for them to be rendered progressively. CARTO takes care of this, allowing you to create tilesets directly in BigQuery or dynamically generate them on the fly.
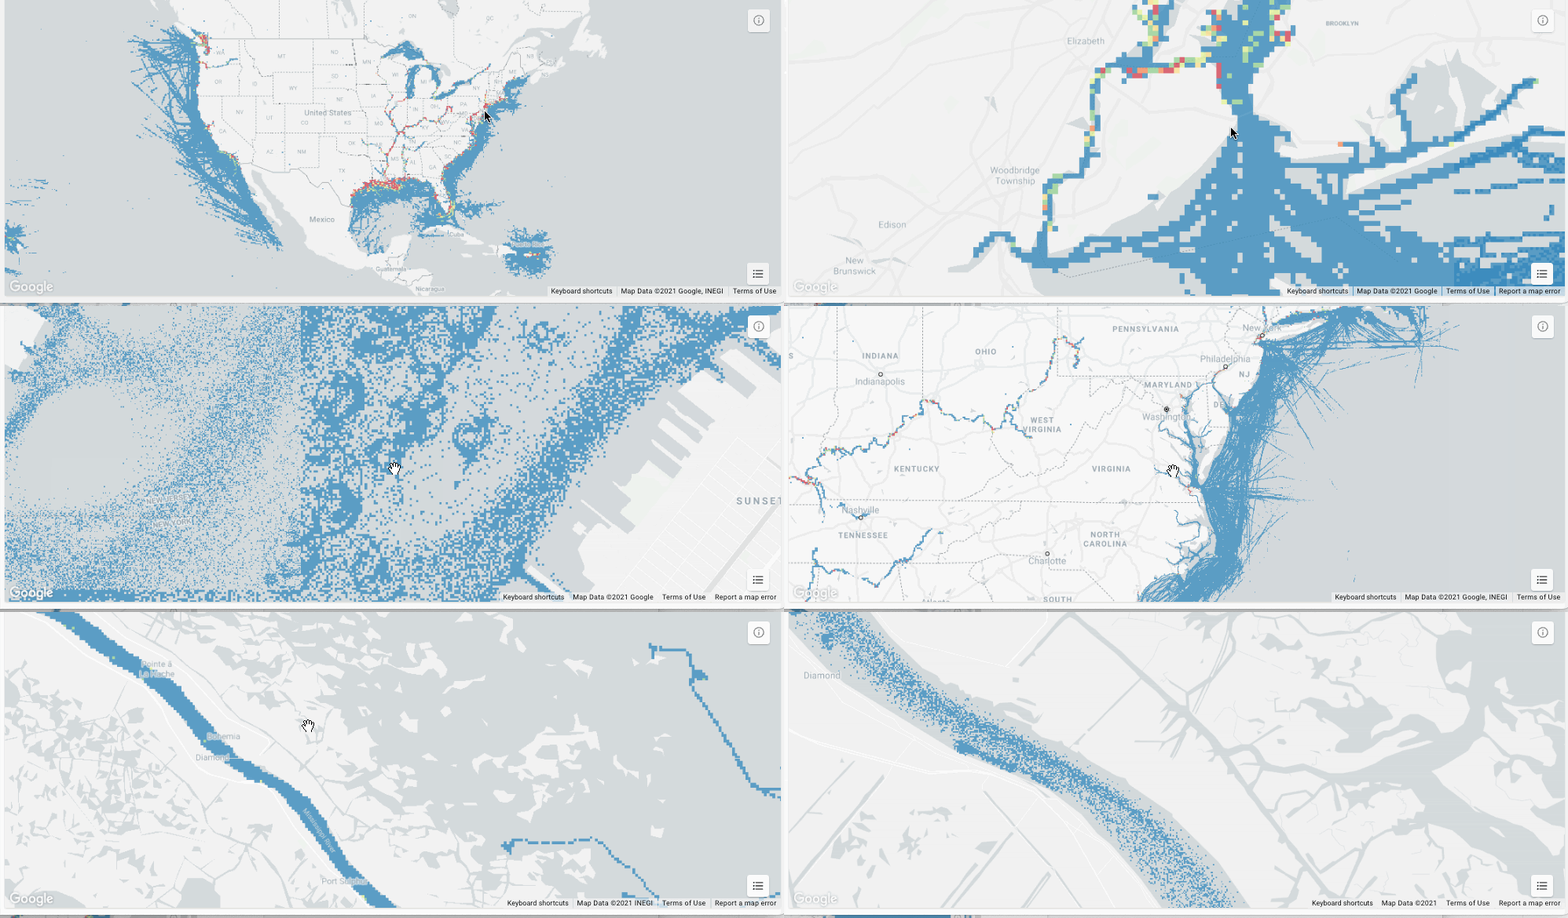
This method for data loading in maps can scale as much as needed; for example, take a look at this 17 billion point visualization of vessel data.
What about live data?
BigQuery supports streaming data that is continuously updated. In these scenarios, you want to be able to update your visualization at regular intervals, as the data changes. It’s easy to update this visualization using deck.gl. You just need to set the autoRefresh parameter to true when fetching the map and specify the function you want to execute when new data is downloaded:
const {layers} = await deck.carto.fetchMap({ cartoMapId, autoRefresh: true, onNewData: (parsedMap) => { … } });
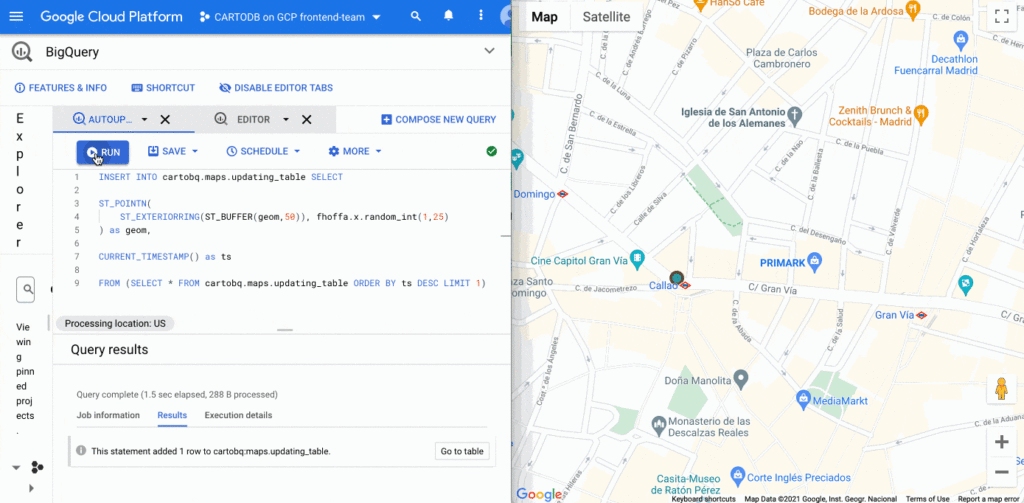
You can add points to a table with an INSERT function on the BigQuery console and see the data updated on the map in real time.
Going further
In addition to the simple ways to create visualizations shown above, deck.gl has the flexibility to create a wide variety of visualizations. The CARTO platform provides you with the functionality to access data from your data warehouse and create these data visualizations with advanced cartographic capabilities, but you can extend it and go beyond that using any of the advanced visualizations available in the deck.gl layer catalog.
There are two additional options that give you more control over the deck.gl code. The first one is to use the CartoLayer directly without fetchMap. You’ll need to indicate the connection to use from the CARTO platform and the data source type and name or query. Then we can specify the styling properties.
const overlay = new deck.GoogleMapsOverlay({layers: [new deck.carto.CartoLayer({connection: 'bqconn',type: deck.carto.MAP_TYPES.TABLE,data: `cartobq.public_account.retail_stores`,getFillColor: [238, 77, 90],pointRadiusMinPixels: 6,}),],});
The second option is to use the fetchLayerData function that allows you to have more control over the format used for data transfer between BigQuery and your application and can be used with advanced visualizations that require an specific data format like ArcLayer, H3HexagonLayer or TripsLayer.
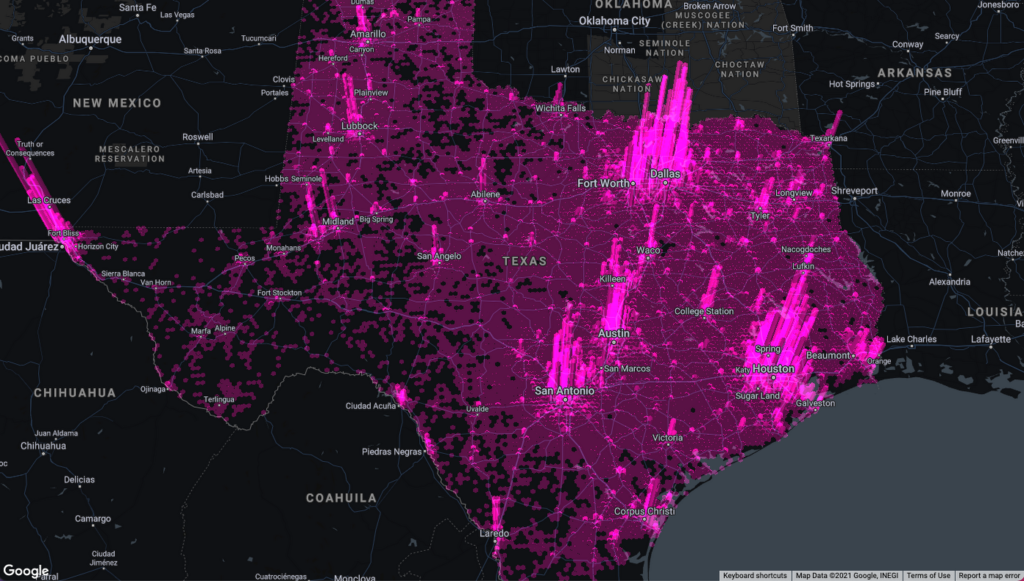
deck.carto.fetchLayerData({type: deck.carto.MAP_TYPES.TABLE,source: `cartobq.geo_for_good_meetup.texas_pop_h3`,connection: 'bqconn',format: deck.carto.FORMATS.JSON,credentials: {accessToken: 'eyJhbGciOiJIUzI1NiJ9.eyJhIjoiYWNfbHFlM3p3Z3UiLCJqdGkiOiI1YjI0OWE2ZCJ9.Y7zB30NJFzq5fPv8W5nkoH5lPXFWQP0uywDtqUg8y8c'}}).then(({data}) => {const layers= [new deck.H3HexagonLayer({id: 'h3-hexagon-layer',data,extruded: true,getHexagon: d => d.h3,getFillColor: [182, 0, 119, 150],getElevation: d => d.pop,elevationScale: 2.5,parameters: {blendFunc: [luma.GL.SRC_ALPHA, luma.GL.DST_ALPHA],blendEquation: luma.GL.FUNC_ADD}})];const overlay = new deck.GoogleMapsOverlay({layers});overlay.setMap(map);});
For complete code using both options, take a look at these examples.
Learn more
You can access demos and documentation on the deck.gl docs website and the CARTO Documentation Center. If you have questions, you can ping the CARTO team on the CARTO Users Slack workspace.
For more information on Google Maps Platform, visit the Google Maps Platform website.
More Relevant Stories for Your Company

How PLAID’S Multi-cloud Approach with Anthos Clusters on AWS Drives Higher Business Growth
Editor’s note: Today’s post comes from Naohiko Takemura, Head of Engineering, and Kosukex Oya, Engineer, both from Japanese customer experience platform PLAID. The company runs its platform in a multicloud environment through Anthos clusters on AWS and shares more on its experiences and best practices. At PLAID, our mission is to maximize the value

Dr. Agarwal’s Eye Hospital Cuts IT Support Tickets By 80% With Google
Founded by the late Dr. J. Agarwal, Dr. Agarwal’s Eye Hospital, headquartered in Chennai, India, operates 62 hospitals in cities across India and 14 hospitals in 8 countries in Africa, including Zambia, Nigeria, and Ghana. According to Dilip Ramadasan, GM-IT, Dr. Agarwal’s Eye Hospital, the business is the second-largest network

Learn to Easily Administer Multi-cluster Kubernetes Environs: Part 4 KRM Series
This is part 4 in a multi-part series about the Kubernetes Resource Model. See parts 1, 2, and 3 to learn more. Kubernetes clusters can scale. Open-source Kubernetes supports up to 5,000 Nodes, and GKE supports up to 15,000 Nodes. But scaling out a single cluster can only get you so far: if your cluster’s control plane


A Quick Guide to Cloud Monitoring
Cloud Monitoring is a tool that allows you to gain visibility into the performance, availability, and health of your applications and infrastructure. In this video, we show you what Cloud Monitoring is and how you can use it to custom define service-level objectives (SLOs), monitor application metrics, and the overall
