





3292
Of your peers have already watched this video.
24:30 Minutes
The most insightful time you'll spend today!
Modernizing 100-Year Old Retail Chain with Anthos
H-E-B, like many enterprises, was moving away from legacy mainframes in favor of microservices and public cloud infrastructure. With hundreds of applications powering their 100+ year-old business, H-E-B needed to be confident that the platform they are building will provide them the agility and security to continue to innovate for their customers.
See how the H-E-B engineering team started breaking down their Curbside and Home Delivery monoliths into microservices, why they chose to make Kubernetes, and why they’re leveraging Anthos as a hybrid cloud platform.
10166
Of your peers have already watched this video.
1:00 Minutes
The most insightful time you'll spend today!
Predict User Churn on Gaming Apps with Google Analytics Data using BigQuery ML
User retention can be a major challenge for mobile game developers. According to the Mobile Gaming Industry Analysis in 2019, most mobile games only see a 25% retention rate for users after the first day. To retain a larger percentage of users after their first use of an app, developers can take steps to motivate and incentivize certain users to return. But to do so, developers need to identify the propensity of any specific user returning after the first 24 hours.
In this blog post, we will discuss how you can use BigQuery ML to run propensity models on Google Analytics 4 data from your gaming app to determine the likelihood of specific users returning to your app.
You can also use the same end-to-end solution approach in other types of apps using Google Analytics for Firebase as well as apps and websites using Google Analytics 4. To try out the steps in this blogpost or to implement the solution for your own data, you can use this Jupyter Notebook.
Using this blog post and the accompanying Jupyter Notebook, you’ll learn how to:
- Explore the BigQuery export dataset for Google Analytics 4
- Prepare the training data using demographic and behavioural attributes
- Train propensity models using BigQuery ML
- Evaluate BigQuery ML models
- Make predictions using the BigQuery ML models
- Implement model insights in practical implementations
Google Analytics 4 (GA4) properties unify app and website measurement on a single platform and are now default in Google Analytics. Any business that wants to measure their website, app, or both, can use GA4 for a more complete view of how customers engage with their business. With the launch of Google Analytics 4, BigQuery export of Google Analytics data is now available to all users. If you are already using a Google Analytics 4 property, you can follow this guide to set up exporting your GA data to BigQuery.
Once you have set up the BigQuery export, you can explore the data in BigQuery. Google Analytics 4 uses an event-based measurement model. Each row in the data is an event with additional parameters and properties. The Schema for BigQuery Export can help you to understand the structure of the data.
In this blogpost, we use the public sample export data from an actual mobile game app called “Flood It!” (Android, iOS) to build a churn prediction model. But you can use data from your own app or website.
Here’s what the data looks like. Each row in the dataset is a unique event, which can contain nested fields for event parameters.
SELECT *FROM `firebase-public-project.analytics_153293282.events_*`TABLESAMPLE SYSTEM (1 PERCENT)

This dataset contains 5.7M events from over 15k users.
SELECTCOUNT(DISTINCT user_pseudo_id) as count_distinct_users,COUNT(event_timestamp) as count_eventsFROM`firebase-public-project.analytics_153293282.events_*

Our goal is to use BigQuery ML on the sample app dataset to predict propensity to user churn or not churn based on users’ demographics and activities within the first 24 hours of app installation.

In the following sections, we’ll cover how to:
- Pre-process the raw event data from GA4
- Identify users & the label feature
- Process demographic features
- Process behavioral features
- Train classification model using BigQuery ML
- Evaluate the model using BigQueryML
- Make predictions using BigQuery ML
- Utilize predictions for activation
Pre-process the raw event data
You cannot simply use raw event data to train a machine learning model as it would not be in the right shape and format to use as training data. So in this section, we’ll go through how to pre-process the raw data into an appropriate format to use as training data for classification models.
This is what the training data should look like for our use case at the end of this section:

Notice that in this training data, each row represents a unique user with a distinct user ID (user_pseudo_id).
Identify users & the label feature
We first filtered the dataset to remove users who were unlikely to return the app anyway. We defined these ‘bounced’ users as ones who spent less than 10 mins with the app. Then we labeled all remaining users:
- churned: No event data for the user after 24 hours of first engaging with the app.
- returned: The user has at least one event record after 24 hours of first engaging with the app.
For your use case, you can have a different definition of bounce and churning. Also you can even try to predict something else other than churning, e.g.:
- whether a user is likely to spend money on in-game currency
- likelihood of completing n-number of game levels
- likelihood of spending n amount of time in-game etc.
In such cases, label each record accordingly so that whatever you are trying to predict can be identified from the label column.
From our dataset, we found that ~41% users (5,557) bounced. However, from the remaining users (8,031), ~23% (1,883) churned after 24 hours:
SELECTbounced,churned,COUNT(churned) as count_usersFROMbqmlga4.returningusersGROUP BY 1,2ORDER BY bounced

To create these bounced and churned columns, we used the following snippet of SQL code.
...#churned = 1 if last_touch within 24 hr of app installation, else 0IF (user_last_engagement < TIMESTAMP_ADD(user_first_engagement,INTERVAL 24 HOUR),1,0 ) AS churned,#bounced = 1 if last_touch within 10 min, else 0IF (user_last_engagement <= TIMESTAMP_ADD(user_first_engagement,INTERVAL 10 MINUTE),1,0 ) AS bounced,...
You can view the Jupyter Notebook for the full query used for materializing the bounced and churned labels.
Process demographic features
Next, we added features both for demographic data and for behavioral data spanning across multiple columns. Having a combination of both demographic data and behavioral data helps to create a more predictive model.
We used the following fields for each user as demographic features:
geo.countrydevice.operating_systemdevice.language
A user might have multiple unique values in these fields — for example if a user uses the app from two different devices. To simplify, we used the values from the very first user engagement event.
CREATE OR REPLACE VIEW bqmlga4.user_demographics AS (WITH first_values AS (SELECTuser_pseudo_id,geo.country as country,device.operating_system as operating_system,device.language as language,ROW_NUMBER() OVER (PARTITION BY user_pseudo_id ORDER BY event_timestamp DESC) AS row_numFROM `firebase-public-project.analytics_153293282.events_*`WHERE event_name="user_engagement")SELECT * EXCEPT (row_num)FROM first_valuesWHERE row_num = 1 #first engagement);
Process behavioral features
There is additional demographic information present in the GA4 export dataset, e.g. app_info, device, event_params, geo etc. You may also send demographic information to Google Analytics through each hit via user_properties. Furthermore, if you have first-party data on your own system, you can join that with the GA4 export data based on user_ids.
To extract user behavior from the data, we looked into the user’s activities within the first 24 hours of first user engagement. In addition to the events automatically collected by Google Analytics, there are also the recommended events for games that can be explored to analyze user behavior. For our use case, to predict user churn, we counted the number of times the follow events were collected for a user within 24 hours of first user engagement:
user_engagementlevel_start_quickplaylevel_end_quickplaylevel_complete_quickplaylevel_reset_quickplaypost_scorespend_virtual_currencyad_rewardchallenge_a_friendcompleted_5_levelsuse_extra_steps
The following query shows how these features were calculated:
WITHevents_first24hr AS (SELECTe.*FROM`firebase-public-project.analytics_153293282.events_*` eJOINbqmlga4.returningusers rONe.user_pseudo_id = r.user_pseudo_idWHERETIMESTAMP_MICROS(e.event_timestamp) <= r.ts_24hr_after_first_engagement)SELECTuser_pseudo_id,SUM(IF(event_name = 'user_engagement', 1, 0)) AS cnt_user_engagement,# ... repeated for all behavior data ...SUM(IF(event_name = 'use_extra_steps', 1, 0)) AS cnt_use_extra_steps,FROMevents_first24hrGROUP BY1
View the notebook for the query used to aggregate and extract the behavioral data. You can use different sets of events for your use case. To view the complete list of events, use the following query:
SELECTevent_name,COUNT(event_name) as event_countFROM`firebase-public-project.analytics_153293282.events_*`GROUP BY 1ORDER BYevent_count DESC
After this we combined the features to ensure our training dataset reflects the intended structure. We had the following columns in our table:
- User ID:
user_pseudo_id
- Label:
churned
- Demographic features
countrydevice_osdevice_language
- Behavioral features
cnt_user_engagementcnt_level_start_quickplaycnt_level_end_quickplaycnt_level_complete_quickplaycnt_level_reset_quickplaycnt_post_scorecnt_spend_virtual_currencycnt_ad_rewardcnt_challenge_a_friendcnt_completed_5_levelscnt_use_extra_stepsuser_first_engagement
At this point, the dataset was ready to train the classification machine learning model in BigQuery ML. Once trained, the model will output a propensity score between churn (churned=1) or return (churned=0) indicating the probability of a user churning based on the training data.
Train classification model
When using the CREATE MODEL statement, BigQuery ML automatically splits the data between training and test. Thus the model can be evaluated immediately after training (see the documentation for more information).
For the ML model, we can choose among the following classification algorithms where each type has its own pros and cons:

Often logistic regression is used as a starting point because it is the fastest to train. The query below shows how we trained the logistic regression classification models in BigQuery ML.
CREATE OR REPLACE MODEL bqmlga4.churn_logregTRANSFORM(EXTRACT(MONTH from user_first_engagement) as month,EXTRACT(DAYOFYEAR from user_first_engagement) as julianday,EXTRACT(DAYOFWEEK from user_first_engagement) as dayofweek,EXTRACT(HOUR from user_first_engagement) as hour,* EXCEPT(user_first_engagement, user_pseudo_id))OPTIONS(MODEL_TYPE="LOGISTIC_REG",INPUT_LABEL_COLS=["churned"]) ASSELECT*FROMbqmlga4.train
We extracted month, julianday, and dayofweek from datetimes/timestamps as one simple example of additional feature preprocessing before training. Using TRANSFORM() in your CREATE MODEL query allows the model to remember the extracted values. Thus, when making predictions using the model later on, these values won’t have to be extracted again. View the notebook for the example queries to train other types of models (XGBoost, deep neural network, AutoML Tables).
Evaluate model
Once the model finished training, we ran ML.EVALUATE to generate precision, recall, accuracy and f1_score for the model:
SELECT*FROMML.EVALUATE(MODEL bqmlga4.churn_logreg)

The optional THRESHOLD parameter can be used to modify the default classification threshold of 0.5. For more information on these metrics, you can read through the definitions on precision and recall, accuracy, f1-score, log_loss and roc_auc. Comparing the resulting evaluation metrics can help to decide among multiple models.Furthermore, we used a confusion matrix to inspect how well the model predicted the labels, compared to the actual labels. The confusion matrix is created using the default threshold of 0.5, which you may want to adjust to optimize for recall, precision, or a balance (more information here).
SELECTexpected_label,_0 AS predicted_0,_1 AS predicted_1FROMML.CONFUSION_MATRIX(MODEL bqmlga4.churn_logreg)

This table can be interpreted in the following way:

Make predictions using BigQuery ML
Once the ideal model was available, we ran ML.PREDICT to make predictions. For propensity modeling, the most important output is the probability of a behavior occurring. The following query returns the probability that the user will return after 24 hrs. The higher the probability and closer it is to 1, the more likely the user is predicted to return, and the closer it is to 0, the more likely the user is predicted to churn.
SELECTuser_pseudo_id,returned,predicted_returned,predicted_returned_probs[OFFSET(0)].prob as probability_returnedFROMML.PREDICT(MODEL bqmlga4.churn_logreg,(SELECT * FROM bqmlga4.train)) #can be replaced with a proper test dataset
Utilize predictions for activation
Once the model predictions are available for your users, you can activate this insight in different ways. In our analysis, we used user_pseudo_id as the user identifier. However, ideally, your app should send back the user_id from your app to Google Analytics. In addition to using first-party data for model predictions, this will also let you join back the predictions from the model into your own data.
- You can import the model predictions back into Google Analytics as a user attribute. This can be done using the Data Import feature for Google Analytics 4. Based on the prediction values you can Create and edit audiences and also do Audience targeting. For example, an audience can be users with prediction probability between 0.4 and 0.7, to represent users who are predicted to be “on the fence” between churning and returning.
- For Firebase Apps, you can use the Import segments feature. You can tailor user experience by targeting your identified users through Firebase services such as Remote Config, Cloud Messaging, and In-App Messaging. This will involve importing the segment data from BigQuery into Firebase. After that you can send notifications to the users, configure the app for them, or follow the user journeys across devices.
- Run targeted marketing campaigns via CRMs like Salesforce, e.g. send out reminder emails.
You can find all of the code used in this blogpost in the Github repository:
What’s next?
Continuous model evaluation and re-training
As you collect more data from your users, you may want to regularly evaluate your model on fresh data and re-train the model if you notice that the model quality is decaying.
Continuous evaluation—the process of ensuring a production machine learning model is still performing well on new data—is an essential part in any ML workflow. Performing continuous evaluation can help you catch model drift, a phenomenon that occurs when the data used to train your model no longer reflects the current environment.
To learn more about how to do continuous model evaluation and re-train models, you can read the blogpost: Continuous model evaluation with BigQuery ML, Stored Procedures, and Cloud Scheduler
More resources
If you’d like to learn more about any of the topics covered in this post, check out these resources:
- BigQuery export of Google Analytics data
- BigQuery ML quickstart
- Events automatically collected by Google Analytics 4
- Qwiklabs: Create ML models with BigQuery ML
Or learn more about how you can use BigQuery ML to easily build other machine learning solutions:
- How to build demand forecasting models with BigQuery ML
- How to build a recommendation system on e-commerce data using BigQuery ML
Let us know what you thought of this post, and if you have topics you’d like to see covered in the future! You can find us on Twitter at @polonglin and @_mkazi_.Thanks to reviewers: Abhishek Kashyap, Breen Baker, David Sabater Dinter.
How Smart Parking Transformed into a Data-Intelligent Business

3740
Of your peers have already read this article.
2:30 Minutes
The most insightful time you'll spend today!
Google Cloud Results
- Reduced smart parking/smart city IoT installation and operational support effort by more than half
- Enabled development of a Smart Cloud IoT platform in just four months
- Democratised data access and use across the organisation
- Built core infrastructure in under 4 months
Smart Parking’s core product is a sensor-based system called SmartPark, used in environments such as shopping centres, airports, commercial parking operations, universities, and municipal streets.
Smart Parking has deployed over 50,000 sensors worldwide to support parking systems. It estimates at least 70% of production-scale and currently operating smart parking environments globally are using its technologies.
“Our products include ground sensors that use an advanced combination of infrared and magnetic technologies to reliably register a vehicle’s arrival and communicate to a gateway,” says Brian Granatir, Technical Team Lead, Smart Parking. This enables operators to gain live insights into parking environment usage and manage capacity. They can also provide automated guidance and signage to tell customers how many vacant spaces are available on each level of a parking structure or street area of a city.
Additional functionality enables parking operators to identify whether vehicles parked in limited-time spots have overstayed. The operators may notify inspectors who can undertake enforcement actions such as issuing infringement notices.
Another Smart Parking mobile product enables parking operators to photograph licence plates to identify vehicles that have overstayed. The business is also developing applications that enable users to view the number of parking spots available in nearby parking structures.
Smart Parking is extending its operations into smart city developments. The business views this as a natural progression as its parking systems establish a powerful common foundation from which to deliver many other services. “Parking is just part of a very complex ecosystem that requires sophisticated interoperability and generalised analytics,” John Heard, Chief Technology Officer, Smart Parking, explains.
“The biggest trend in the space is towards the Internet of Things (IoT)–the integration of a large number of generic and specialised devices,” Heard adds. “This has led us to shift from the idea of our devices being the centre of the universe. Instead, we put data intelligence at the core.”
In October 2016, Smart Parking decided to develop a SmartCloud platform that would enable cities to manage and react to information from a connected network of IoT devices. The business wanted to start by rolling out the platform based on an event-driven architecture that could connect any device that sends or receives a sequence of data events to existing Smart Parking customers.
The platform would enable Smart Parking to address a wide range of highly complex and interrelated interactions. “Internally, we use the example that if everyone leaves a parking structure at 3pm, what will be the impact on traffic?” Heard says. “So, how can we correlate multiple factors to answer a larger question?”
Heard’s team elected to deploy SmartCloud on Google Cloud Platform (GCP), due primarily to its support for sophisticated big data management and machine learning in a serverless architecture. Furthermore, Google technologies were proven to operate at scale and GCP had baked-in best practices that could manage internet-scale datasets in near real time.
“By running on Google, we were able to develop SmartCloud at an incredible pace,” Granatir says. “We built the core infrastructure in under four months.” Furthermore, GCP enables the SmartCloud platform to operate at metropolis scale, combining streams of distributed data to deliver an unprecedented view of the events and interactions taking place in a city.
Smart Parking now uses a wide range of GCP services to deliver SmartCloud. Google Cloud Dataflow provides processing and Google BigQuery provides management and analytics of big data. Google Cloud Pub/Sub provides real-time messaging and Google Cloud Functions enables a serverless environment to enable delivery of streaming data. Google Cloud IoT Core connects, manages, and ingests data from Smart Parking devices while Google Cloud Identity & Access Management enables Smart Parking to control access to information. Google Cloud Pub/Sub and Google Cloud Functions also support the event-driven architecture.
Installation time and operational burdens cut by at least half
Using Google Cloud IoT Core has cut Smart Parking’s parking and smart city system installation times by at least half and eliminated the need to build a registration system, a device authorisation system, and a feedback loop for each project. This delivers a streamlined and simpler methodology for site installations, which flows on to a dramatic decrease in the operational burdens involved in monitoring and maintaining deployments of all scales.
Using GCP has revolutionised Smart Parking’s software development processes. “We’re building and deploying systems at a speed I could never have imagined before Google Cloud Platform,” Granatir says. Furthermore, using GCP has made data accessible to anyone within the Smart Parking business, and this is being extended to customers via SmartCloud information services.
This democratised approach has already realised considerable benefits. “One of our project managers was experimenting with the Google Data Studio service for visualising data and was able to make a query about utilisation efficiency,” Heard adds. “We found that simply changing the maximum stay time by a small amount could hugely impact the percentage of parking utilisation and, therefore, throughput.
“This is an illustration of a significant insight by someone who simply had a hunch and quick access to mountains of live and accurate data.”
Transition to a data-intelligence company
Using GCP has enabled Smart Parking to chart a path from a sales and maintenance organisation to a smart cities data-intelligence company. “How? Simply by providing amazing services that focus on massive data volumes and sharing documentation that helps us leverage best practices,” Heard says. “Because of Google Cloud Platform and its pricing, we don’t walk in the shadow of giants, we ride on their shoulders.”
Smart Parking is now looking to further extend its use of Google services to add value to its smart parking and future smart city clients. “With Google Cloud Machine Learning Engine, we could gain the ability to identify trends across every customer parking site and make recommendations to operators,” Heard says. “For example, we could provide data-driven insight and advice to operators about how to adjust their parking spot time limits and guidance about how to transform throughput and convenience while increasing revenue.”
Heard concludes, “As a result of being able to dramatically decrease our traditional development burdens by using GCP, we now have a number of exciting new capabilities we have been able to bring in to our roadmap and expand the journey we are able to open up for our customers as well.”
How Recommendation AI Helps Retailers Optimize Click-through and Conversion Rates

7064
Of your peers have already read this article.
3:00 Minutes
The most insightful time you'll spend today!
Time to go outside again, I guess. I’ll need a sun hat. Sunscreen. Maybe some new sandals? What else?
With the Recommendations AI service, I might be reminded to grab a reusable water bottle and a swimsuit. Or some after-sun aloe lotion. Good thing, cause I’ll need it.

Recommendations AI is a solution that uses machine learning to bring product recommendations to their shoppers across any catalog or client list. This service is part of our full suite of Retail solutions. When you integrate with the Retail API, you get the benefit of Google’s Product Discovery. Integrating once to reap the benefits over and over. Recommendations is the starting point, and you can easily extend into Retail Search and Vision Product Search in the upcoming future.
The Recommendations solution is fully managed, global-scale and powered by deep learning, so you can focus on a great shopping experience and let someone else worry about the infrastructure.
Compared to baseline recommendation systems used by customers, Recommendations AI showed double digit uplift in conversion and clickthrough rates in A/B experiments controlled by the customers. You can optimize for click-through, conversion or session revenue, and fine tune the models to make sure you omit out-of-stock items or duplicates, for example.

So how does it work, and how do you get started? Read on, and we’ll walk you through the pipeline, starting with the data you already have to placement in your online store.
Formula: Data -> Model -> Placement
You start with your catalog, the list of all the things (postcards, movies, pie recipes) that you want to show your customers. Then you ingest your PII-redacted user events -this is the historic event data like home page views, add to cart events and more along with real time user events. This user event is joined with the product catalog and items that allows us to construct the sequence of shoppers’ activity, thus being able to predict what the shopper has a high propensity to purchase next. The user events can come from both online activity across devices or offline store purchases
The recommendation model will return a list of products, which are the recommendations. The brains of the operation, if you will. This model is trained using all the data that you ingest, using the latest neural network models and techniques that Google has built expertise over the years in flagship products like Youtube and News, that allows us to uncover shopper intent, so it can best predict the right recommendations to show to the right people.
Every model outputs a list of product identifiers, but where do they go? They go into placements, the spots, panels, carousels on your customer’s journey interacting with your brand that you’ve set aside to highlight recommendations. A model can send recommendations to one or more placements, but each placement only receives information from one recommendation model. Your pages will then need to render the products with the right images, text or other metadata, using the product ID that is returned by the model.
What do recommendations look like?
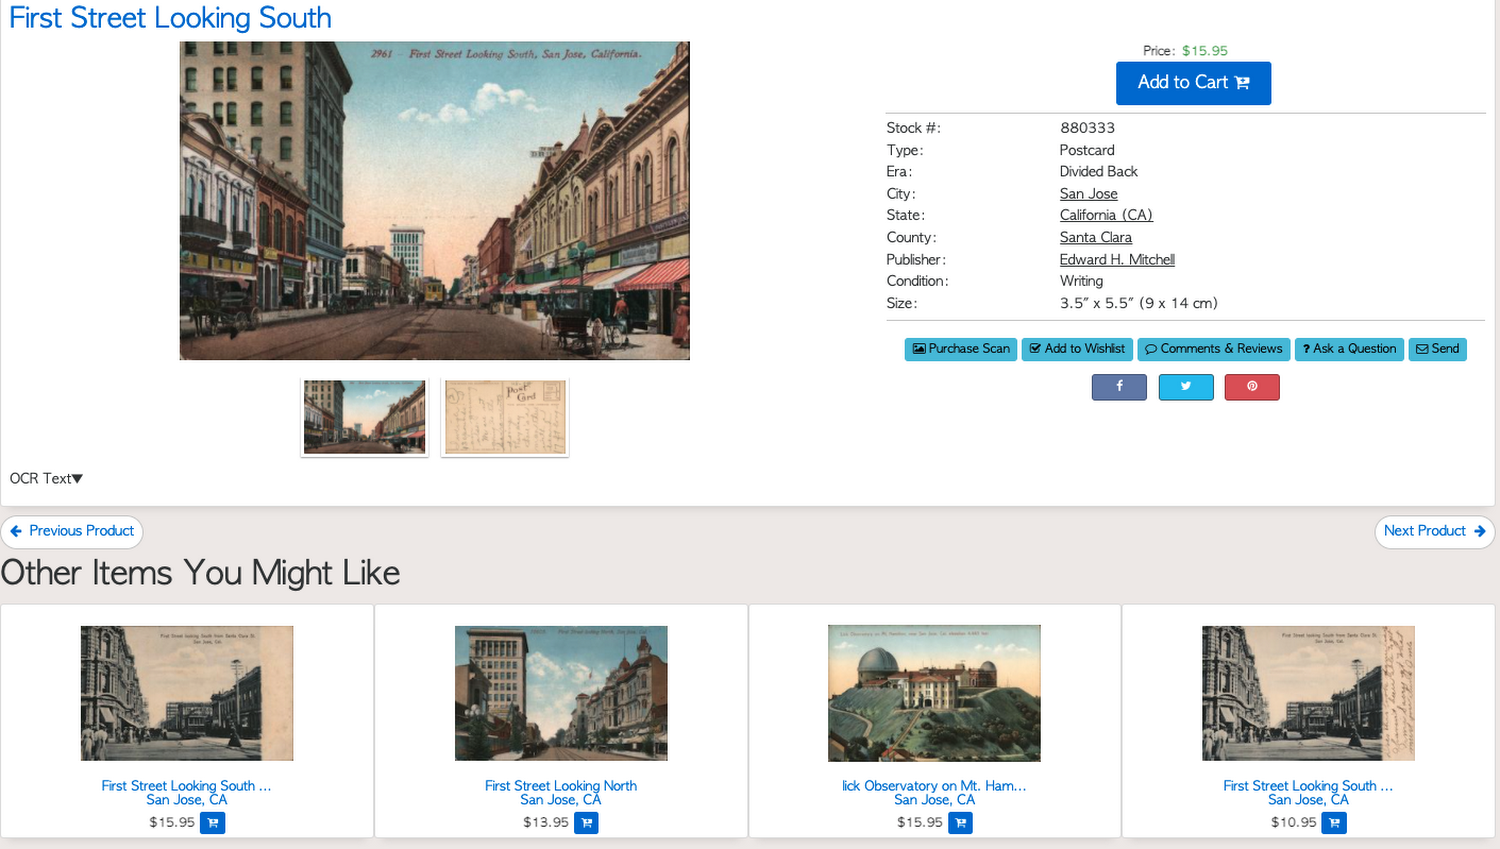
Let’s start by browsing our postcard-selling website, where I’ve been buying some vintage California postcards already. The recommendations algorithm has caught on to my interest, showing me other potential cards to purchase based on my history:
Put your data to work
To get started we need to bring your data into the recommendation model, so it can understand your customers, your inventory, and your sales patterns.
The model takes in the product catalog you use, and metadata about those products to better understand nuances in assortment, pricing and variables like size and style. You might already have this data stored in BigQuery or Merchant Center, and hence we provide easy integrations that you can leverage to get started even faster.
As for the user events, don’t worry if you already have systems in place to capture web and mobile activity. We make it easy to bring in your real time event logs by providing seamless integrations with Google Tag Manager, Javascript pixel, or even historic events from Cloud Storage, BigQuery or using inline API or JSON, so you can immediately train the models on this imported data. All this allows you to kickstart integrating with Recommendations AI in a matter of days.
The models then construct a sequence of activities that the user went through and joins with the products that the user engaged with. Once your data is ready to go, it takes a few days to train the model. Next onto making the data work for you.
Quickly customize your model
Setting up your own recommendations project in the console gives you the ability to choose what sort of model to train (based on what recommendations you want to generate) and your objective. Are you optimizing for click-through rate–more people click on the recommendation links or products–or for conversion rate–more people choose or buy what was suggested or revenue ?
Different models can be optimized for different optimization goals.; the GCP console explains what each one can do and how you can choose to optimize it.
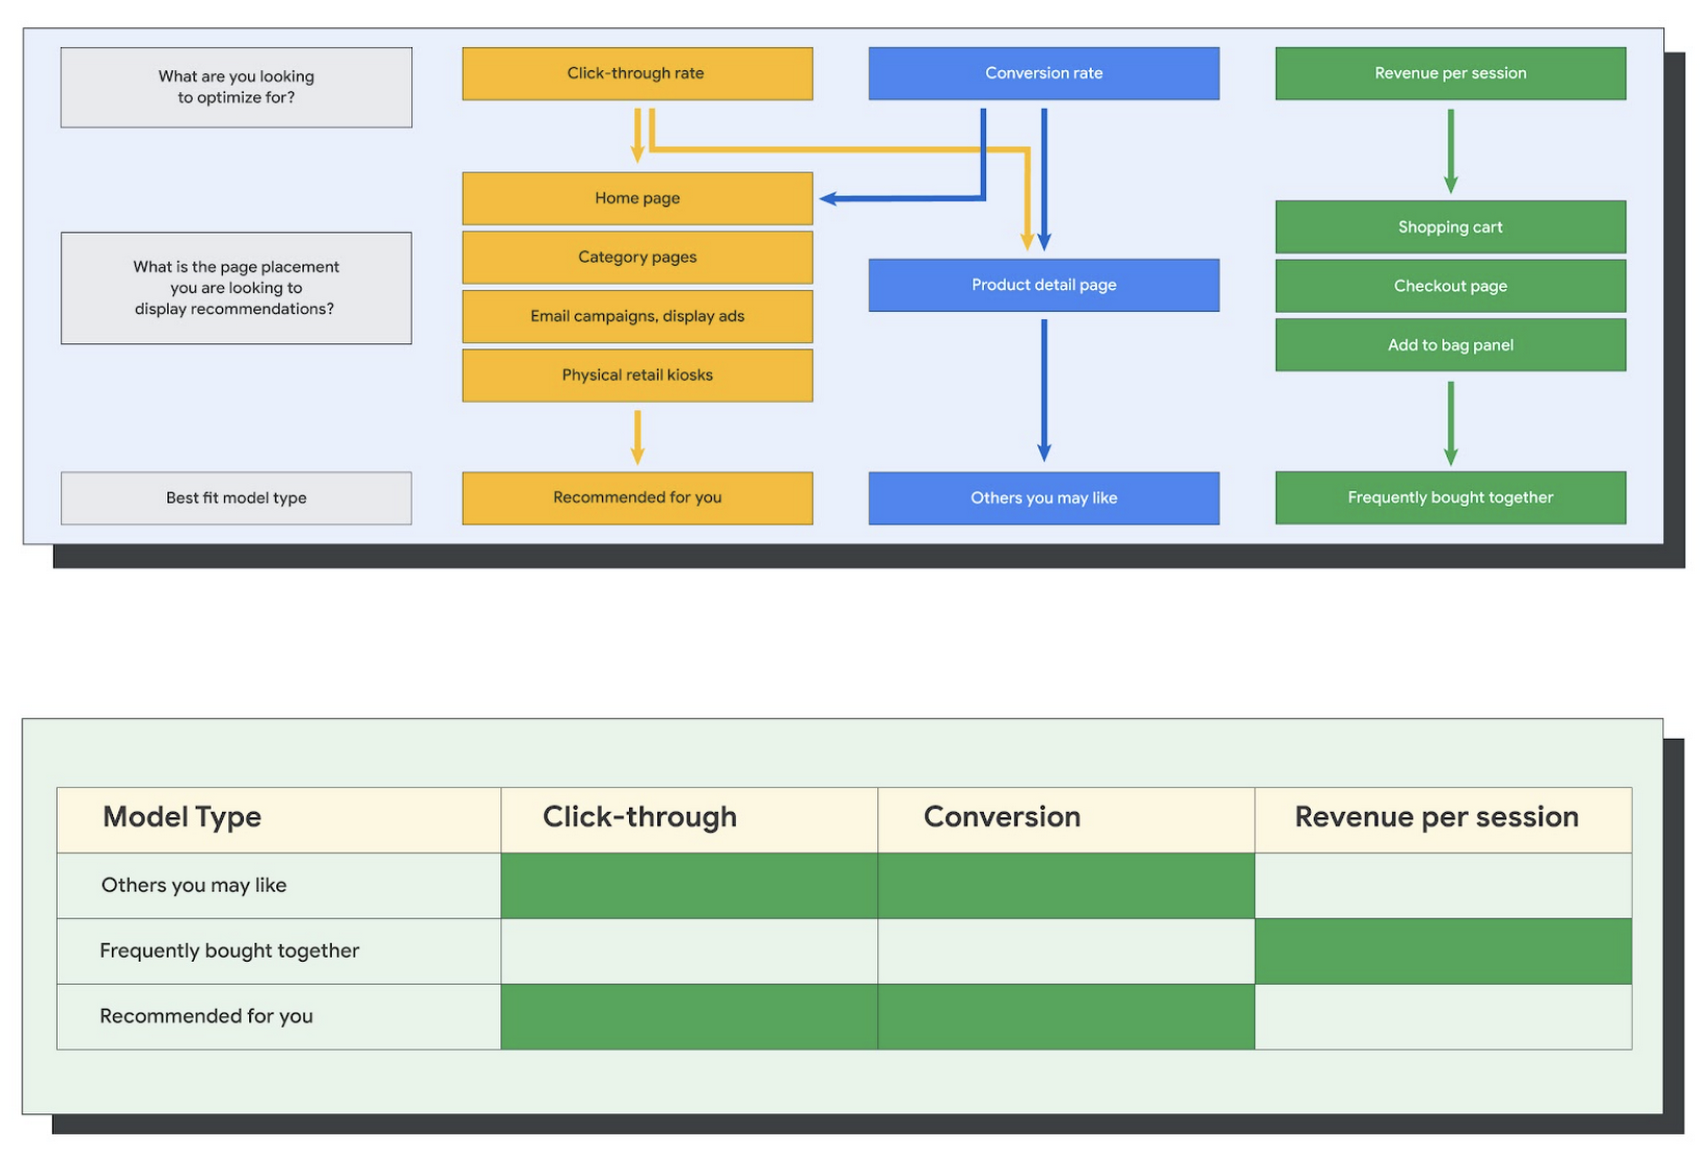
Let’s unpack some of this terminology real quick.
We’ve got three model types:
- Recommended for you – Means we think these are items you’ll want to buy, based on your history; this is usually used on a home page to showcase items.
- Others you may like – Means if you’re browsing the page of a water bottle, we will recommend alternative brands of water bottles that you may like as well as a backpack, based on your engagement history.
- Frequently bought together – Means that when anyone buys sunscreen, we notice that they often also buy aloe lotion, so we will surface those items when someone adds any one of them to their cart.
And then we have three business objectives that the models optimize for:
- Click-through rate – How frequently did somebody click on a recommended item?
- Conversion rate– How frequently did somebody add a recommended item to their cart?
- Revenue per session – How much money did the recommendations generate for you?
Deliver anywhere along the journey
Now that you’re all set up in the Retail AI console, you can test out the recommendations in the console, even before you deploy to production.
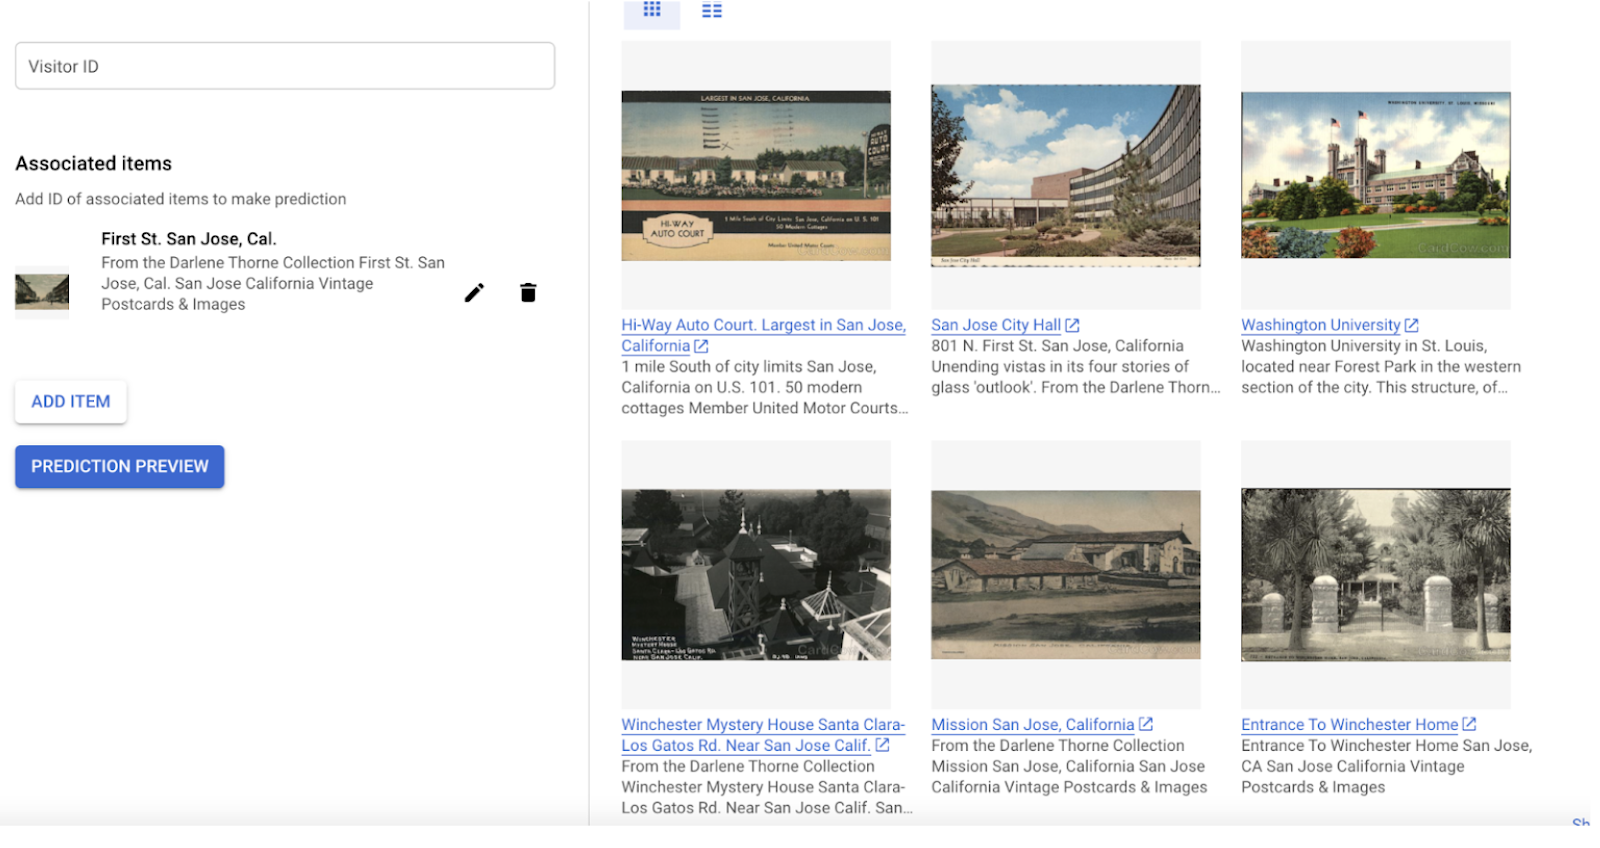
You can integrate Recommendations into your frontend by calling the Predict APIt. The placements of recommendations will report data back into the dashboard and you can analyze and measure success for future iterations.
On top of that you can use the recommendations for other parts of your customer’s journey. Email promotions, storefront kiosks, display ads or follow-up notifications can include recommendations based on past activity and cart contents. The model gives you useful product recommendations for a wide variety of touchpoints and steps in the purchasing process.
More best practices, and guides, are available inside our documentation.
How to get started
Training your own models can be tedious, time-consuming, and expensive. On top of that it requires deeper data science expertise to set up. Let us do it instead!
You can see how IKEA Retail uses Recommendations AI in this recent talk and blog from the Google Cloud Retail Summit..
To get started today you’ll need to make a Cloud project and enable the Retail API, which then allows you to access all the recommendation tools in one menu. Bring in your catalog and purchasing data, define a placement or two, and you can start putting recommendations on your site in a matter of days.
11230
Of your peers have already watched this video.
1:30 Minutes
The most insightful time you'll spend today!
Indian Retailer Figures Optimizes Hyperlocal Delivery to Increase Customer Experience
Anyone who follows the Indian e-commerce scene knows that one of the largest challenges these companies face is hyperlocal delivery.
That was a problem facing Wellness Forever, a retail chain of pharmacies with 150-plus stores across India.
“Exactly a year ago, we started our journey of hyperlocal deliveries. This optimization was a big time challenge for us to understand how to optimize this,” Palani Subbiah, CTO, Wellness Forever.
The problem in front of Wellness Forever was to identify which customer could can be sold from which store, so that a delivery could be made within 90 minutes.
“We handle a large amount of customer data and we wanted to use insights to help and improve the customer satisfaction index,” says Subbiah.
To do that Wellness Forever leveraged Google Big Query to run massive amount of data to come up with the operational insights. They also used Firebase and Google Maps.
“By 2021, we are going to have about 450 stores. Those stores are going to be not only a physical store, which is a digital store.
Release of Go 1.18 is A New Milestone for Development of Secure Apps

3202
Of your peers have already read this article.
1:30 Minutes
The most insightful time you'll spend today!
On March 15th, the Go team announced Go 1.18 GA, the latest release of the Go programming language. The culmination of over a decade of design delivers the features our developers demanded: generics, fuzzing, and module workspaces. With this release, Go becomes the first major language to integrate fuzz testing into its core toolchain without using third-party support, further establishing Go as a preferred language for developing secure applications.
Go was created at Google in 2007, designed to help developers build fast, reliable, and secure software. Unlike traditional languages, Go was built for the modern multi-core computing world. Go has emerged as a modern language for developing cloud applications, services, and infrastructure. Today Go powers several of Google’s largest products, and is used by many customers to scale their businesses. Organizations big and small love Go and the community of Go developers, known as “gophers” has grown into a global network with over 2 million users worldwide.
Using the power of Go in the Cloud
When looking at the public repos, over 75% of CNCF projects including Kubernetes are written in Go and 10% of developers are writing in Go worldwide (as of May 2021). Google delivers high performance infrastructure to run key, cloud native, Open Source projects. Our modern cloud infrastructure is based on Kubernetes at its core and our strong support for Istio and Knative have formed the base of some of our leading services like Google Kubernetes Engine (GKE), our managed application platform with Anthos, Cloud Functions, and Cloud Run. Google uses Go extensively for a wide range of applications from our indexing platform that powers Google Search, to the server side optimizations that power Chrome’s 1B+ users, to the infrastructure on which Google cloud is built.
Release Highlights
With this new release of Go 1.18, Generics are the biggest change to Go since the language was created. Go developers told us that they feel that Go lacks critical features, with generics being the main missing piece. With Go 1.18, new and existing Go developers can take advantage of the productivity, performance, and maintenance benefits that generics can bring. We’ve already begun to see the new kinds of libraries and projects gophers are building with generics in its short beta period, and expect this creativity to grow as time goes on.
This Go release also brings native support for fuzzing. Fuzzing is a type of vulnerability testing that throws arbitrary data at a piece of software to expose unknown errors and is emerging as a common testing scheme in enterprise development. Go is now the first major language to provide fuzzing support with no third-party integrations necessary, allowing developers to start building secure software with minimal additional cost. Go’s innovative approach to fuzzing can provide not only security for the current code but also ongoing protection as code and dependencies evolve. With attacks on software becoming more common and complex, vulnerability detection can be a critical part of the enterprise development lifecycle, and Go’s fuzzing capabilities catch vulnerabilities earlier in the lifecycle.
Build securely using Go
At Google we are helping to make Open Source software secure. Open source software is a connective tissue for much of the online world. At Google, we’ve been working to raise awareness of the state of open source security and are committed to helping secure the software supply chain for organizations. Go has been designed to create secure applications, helping to minimize risk as much as possible. Go applications compile down to a single binary without local dependencies. It’s not uncommon to see an application built using only the standard library, or only a couple well-vetted Go dependencies. Go’s dependency management uses tamper-evident transparency log, with built in tooling that helps ensure your dependencies are what you can expect. Go has native encryption, which is used across much of the internet, including key components of Google. Go even supports distroless containers, where there are zero local dependencies to worry about. Google Cloud products like Cloud Build, for CI/CDand Artifact Registry, for container management, and have direct access to Go’s vulnerability database and can provide you instant warnings about security threats.
“At Google we are committed to helping to secure the online infrastructure and applications upon which the world depends. A critical aspect of this mission is being able to understand and verify the security of open source dependency chains. The 1.18 release of Go is an important step towards helping to ensure that developers are able to build secure applications, understand risk when vulnerabilities are discovered, and reduce the impact of cybersecurity attacks” said Eric Brewer, VP Infrastructure, Google Fellow
This launch is a significant milestone for Go that helps developers from around the world build more performant and secure applications that run on any infrastructure. For more information on this release and how to get started with Go, please visit.
More Relevant Stories for Your Company

New to Cloud Functions? Here’s What You Need to Learn
Cloud Functions is a fully managed event-driven serverless function-as-a-service (FaaS). It is a small piece of code that runs in response to an event. Because it is fully managed, developers can just write the code and deploy it without worrying about managing the servers or scaling up/down with traffic spikes.

Best Practices for Cost Optimization in the Cloud
When customers migrate to Google Cloud Platform (GCP), their first step is often to adopt Compute Engine, which makes it easy to procure and set up virtual machines (VMs) in the cloud that provide large amounts of computing power. Launched in 2012, Compute Engine offers multiple machine types, many innovative features, and is available in
Transforming Media Industry: Three Strategies for Media Leaders to Leverage Generative AI
The digital era turned the traditional formula for media and entertainment success on its head, ushering in new technologies that have changed how content is produced, distributed, experienced, and monetized. Audiences have more choice, flexibility, and power over what they consume, and today’s media companies have to embrace ongoing transformation

Google Named a Leader in the 2019 Gartner Magic Quadrant for Full Life Cycle API Management
The number of APIs within organizations is growing very rapidly not only in IT departments, but also within lines of business (LOBs). Every connected mobile app, every website that tracks users or provides a rich user experience, and every application deployed on a cloud service uses APIs. LOBs see them
