





5366
Of your peers have already watched this video.
44:30 Minutes
The most insightful time you'll spend today!
How Go-Jek, Indonesia’s First Billion-dollar Startup, Improved the Productivity of Data Scientists
Go-Jek, Indonesia’s first billion-dollar startup, has seen an incredible amount of growth in both users and data over the past two years. Many of the ride-hailing company’s services are backed by machine learning models hosted on Google Cloud Platform.
Models range from driver
But senior executives at Go-Jek realized something: One of their most important and expensive resources, data scientists, were spending far too much time cleaning data. That wasn’t part of their remit and resulted in a waste of time and money.
As a COO, this a major concern for any company undertaking a machine learning initiative. Data scientists are hard to come by and their salaries have been on the rise for the last few years. Yet according to some reports data scientists spend upto 80% of their time just preparing data—not creating models.
Watch how operational teams at Go-Jek combined the right Google tools and processes to improve the productivity of their data scientists.
6181
Of your peers have already watched this video.
18:00 Minutes
The most insightful time you'll spend today!
An Overview of Google’s Data Cloud
Data access, management and privacy has been at the center of priorities for enterprises that are aiming to be more agile, reliable and data-driven. Google Cloud’s technology innovations spanning products like BigQuery, Spanner, Looker and VertexAI help organizations navigate the complexities related to siloed data in large volumes sprawled across databases, data lakes, data warehouses, and data marts in multiple clouds and on-premises. Watch the video to learn how companies are building data on Google Cloud for better analysis, security and management to achieve bottomline!
5145
Of your peers have already watched this video.
44:51 Minutes
The most insightful time you'll spend today!
The Strange Phenomenon AI Revealed at Ride-Hailing Company Go-Jek
Go-Jek, Indonesia’s first billion-dollar startup, has seen an incredible amount of growth in both users and data over the past two years. Many of the ride-hailing company’s services are backed by machine learning models hosted on Google Cloud Platform. Models range from driver allocation, to dynamic surge pricing, to food recommendation, and process millions of bookings every day, leading to substantial increases in revenue and customer retention.
By embracing Google Cloud, Go-Jek has overcome many of the technical challenges brought on by its rapid growth. BigQuery has become the cornerstone of their data foundation, scaling seamlessly to meet their immense data storage and processing needs.
Using Pub/Sub as an event stream and Dataflow for unified batch and stream processing has prevented inconsistencies in production data, while simultaneously reducing costs through intelligent resource allocation.
Together, these technologies allow Go-Jek to react immediately to real world events, whether by retraining models with ML Engine, or refreshing data in a low latency data store like BigTable.
Find out how Go-Jek leverages Google Cloud and other lessons they have learned scaling machine learning.
4536
Of your peers have already watched this video.
1:30 Minutes
The most insightful time you'll spend today!
AI-powered Cameras Help You Serve Your Pets Better. Learn How
Watch the video to learn how you can leverage Google Cloud platform and AI functions to build pet-detection cameras that can capture and send image-based alert messages on your phone to notify when your pets arrive or leave.
Making Streaming Analytics Simpler and More Cost-Effective With Cloud Dataflow

3887
Of your peers have already read this article.
8:30 Minutes
The most insightful time you'll spend today!
Streaming analytics helps businesses to understand their customers in real time and adjust their offerings and actions to better serve customer needs. It’s an important part of modern data analytics, and can open up possibilities for faster decisions.
For streaming analytics projects to be successful, the tools have to be easy to use, familiar, and cost-effective. Since its launch in 2015, Cloud Dataflow, Google’s fully managed streaming analytics service, has been known for its powerful API available in Java and Python. Businesses have almost unlimited customization capabilities for their streaming pipelines when they use these two languages, but these capabilities come at the cost of needing programming skills that are sometimes hard to find.
To advance Google Cloud’s streaming analytics further, Google Cloud is announcing new features available in the public preview for Cloud Dataflow SQL, as well as the general availability of Cloud Dataflow Flexible Resource Scheduling (FlexRS) for a very cost-effective way of batch processing of events. These new features make streaming analytics easier and more accessible to data engineers, particularly those with database experience.
Here’s more detail about each of these new features:
Cloud Dataflow SQL to create streaming (and batch) pipelines using SQL
We know that SQL is the standard for defining data transformations, and that you want more GUI-based tools for creating pipelines. With that in mind, several months ago we launched a public preview of Cloud Dataflow SQL, an easy way to use SQL queries to develop and run Cloud Dataflow jobs from the BigQuery web UI. Today, we are launching several new features in Cloud Dataflow SQL, including Cloud Storage file support and a visual schema editor.
Cloud Dataflow SQL allows you to join Cloud Pub/Sub streams with BigQuery tables and Cloud Storage files. It also provides several additional features:
- Using Streaming SQL extensions for defining time windows and calculating window-based statistics;
- Integration with Cloud Data Catalog for storing the schema of Cloud Pub/Sub topics and Cloud Storage file sets—a key enabler for using SQL with streaming messages;
- A simple-to-use graphical editor available in the BigQuery web UI. If you are familiar with BigQuery’s SQL editor, you can create Cloud Dataflow SQL jobs.
To switch the BigQuery web UI to Cloud Dataflow SQL editing mode, open the BigQuery web UI, go to More>Query settings and select “Cloud Dataflow” as the query engine.
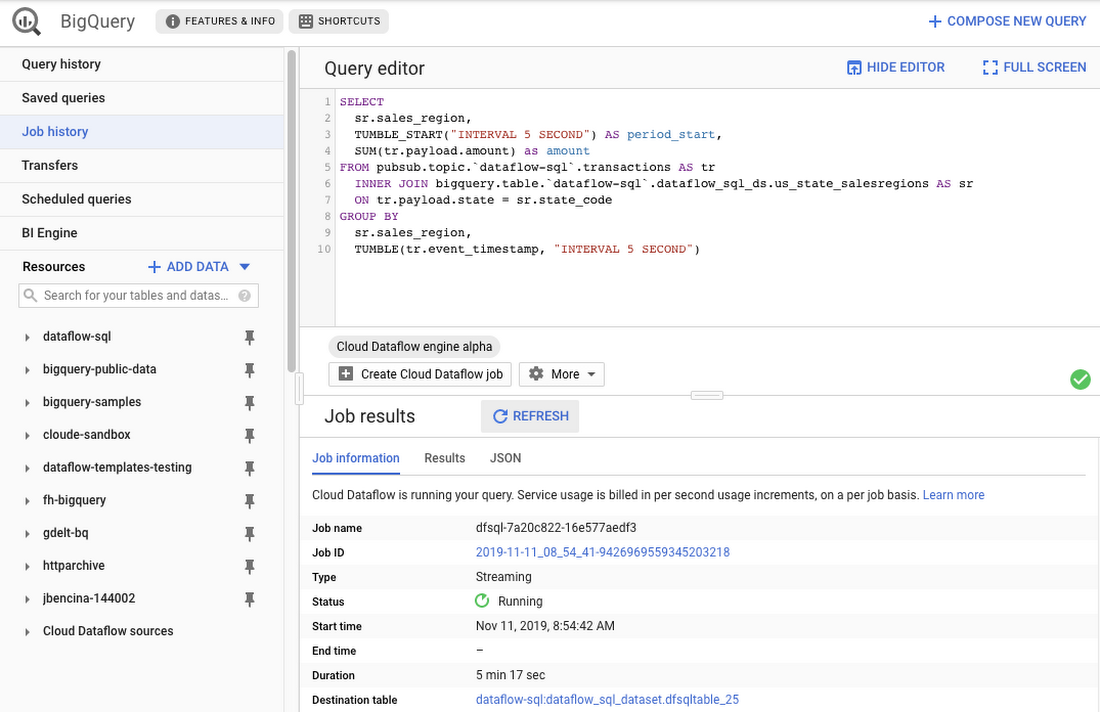
As an example, let’s say you have a Cloud Pub/Sub stream of sales transactions, and you want to build a real-time dashboard for the sales managers of your organization showing them the up-to-date stats of the sales in their regions. You can accomplish this in a few steps: write a SQL statement like the following one, launch a Cloud Dataflow SQL job, direct the output to a BigQuery table, then use one of the many supported dashboarding tools, including Google Sheets, Data Studio, and others, to visualize the results.
SELECTsr.sales_region,TUMBLE_START("INTERVAL 5 SECOND") AS period_start,SUM(tr.payload.amount) as amountFROM pubsub.topic.`dataflow-sql`.transactions AS trINNER JOIN bigquery.table.`dataflow-sql`.dataflow_sql_ds.us_state_salesregions AS srON tr.payload.state = sr.state_codeGROUP BYsr.sales_region,TUMBLE(tr.event_timestamp, "INTERVAL 5 SECOND")
In this example, we are joining the “transactions” Cloud Pub/Sub topic in the “dataflow-sql” project with a metadata table in BigQuery called “us_state_salesregions.” This table contains a mapping between the state codes (present in the “transactions” Cloud Pub/Sub topic) and the sales regions “Region_1”, “Region_2”, .., “Region_N” that are relevant to the sales managers in our example organization. In addition to the join, we’ll do a streaming aggregation of our data, using one of the several windowing functions supported by Cloud Dataflow. In our case, we will use TUMBLE windows, which will divide our stream into fixed five-second time intervals, group all the data in those time windows by the sales_region field, and calculate the sum of sales in the sales region. We also want to preserve the start of each time window, via TUMBLE_START("INTERVAL 5 SECOND"), to plot sales amounts as a time series.
To start a Cloud Dataflow job, click on “Create Cloud Dataflow job” in the BigQuery web UI.
When data starts flowing into the destination table, it will contain three fields: the sales_region, the timestamp of the period start, and the amount of sales.
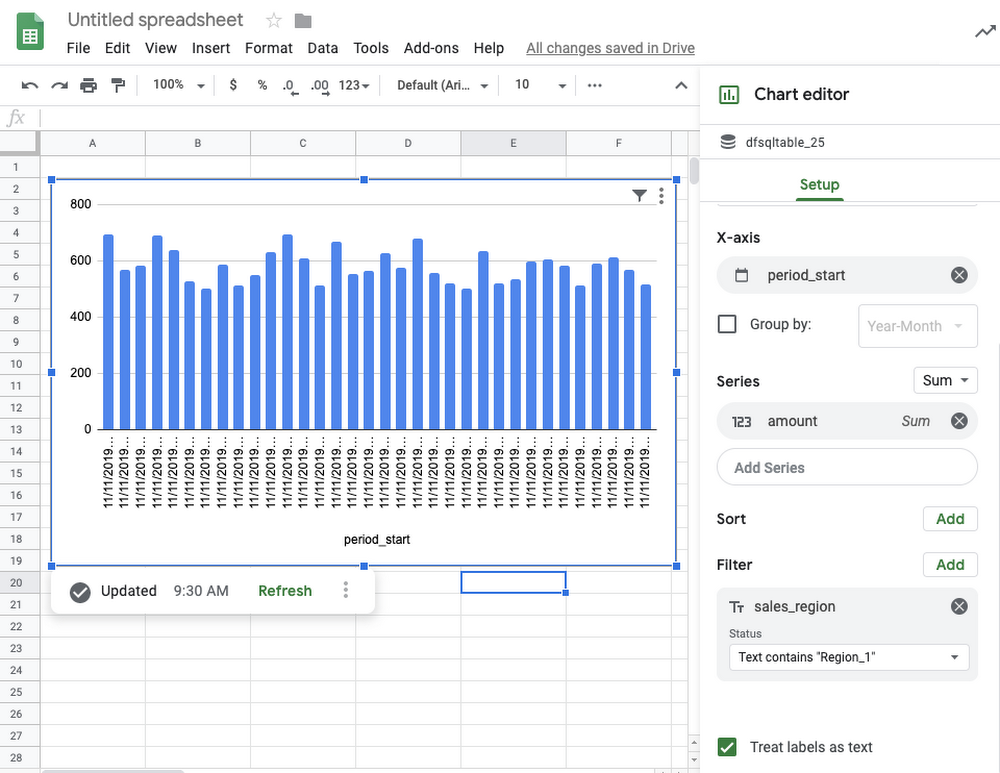
In the next step, we will create a BigQuery Connected Sheet that shows a column chart of sales in “Region_1” over time. Select the destination BigQuery table in the nav tree. In our case, it’s the dfsqltable_25 table.
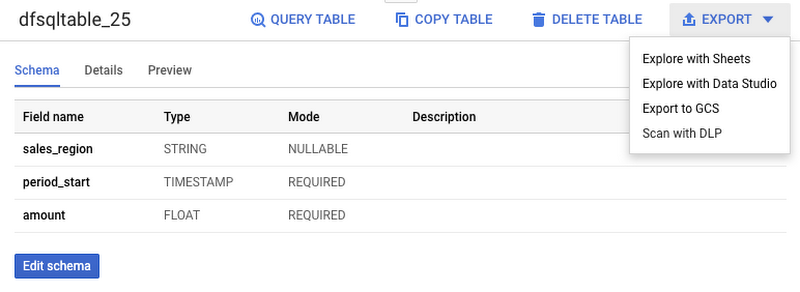
Then, select Export>Explore with Sheets to chart your data. Do it from the tab where your BigQuery table is shown, and not from the tab where your original Cloud Dataflow SQL was. In Sheets, create the column chart using the data connection to BigQuery, and choose period_start for the X-axis, amount as your data series, and add a sales_region filter. This is all you have to do to build a chart in Sheets that visualizes streaming data.
Mixing and joining data in Cloud Pub/Sub and BigQuery helps solve many real-time dashboarding cases, but quite a few customers have also asked for support of their Cloud Storage files to join those files with events in Cloud Pub/Sub or with tables in BigQuery. This is now possible in Dataflow SQL, enabled by our integration with Data Catalog’s Cloud Storage file sets.
In the following example, you’ll see an archive of transactions stored in CSV files in the “transactions_archive” Cloud Storage bucket.
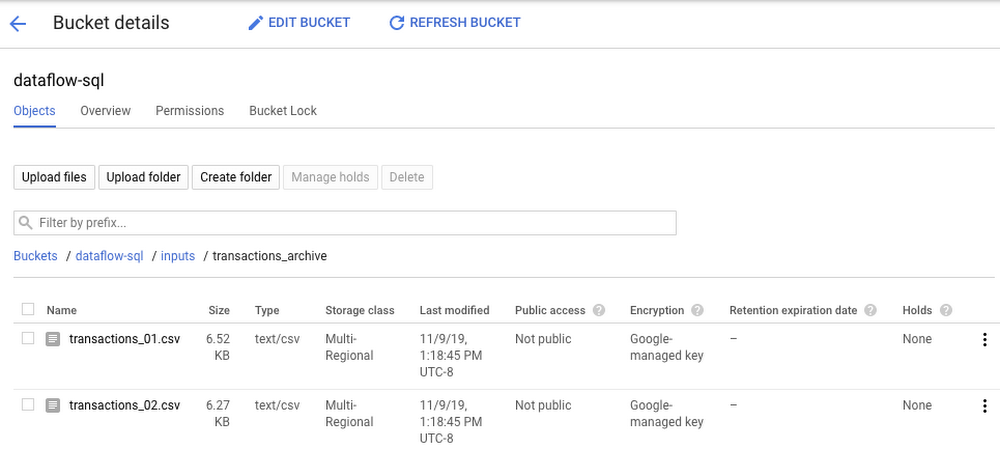
Two gcloud commands can define a Cloud Storage file set and entry group in Data Catalog.
#Create a GCS entrygroupgcloud beta data-catalog entry-groups create transactions_archive_eg --location=us-central1#Create the filesetgcloud beta data-catalog entries create transactions_archive_fs --location=us-central1 --entry-group=transactions_archive_eg --gcs-file-patterns=gs://dataflow-sql/inputs/transactions_archive/*.csv --description="Historical Archive of Transactions"
Notice how we defined the file pattern “gs://dataflow-sql/inputs/transactions_archive/*.csv” as part of the file set entry definition. This pattern is what will allow Cloud Dataflow to find the CSV files once we write the SQL statement that references this file set.
We can even specify the schema of this transactions_archive_fs file set using a GUI editor. For that, go to the BigQuery web UI (make sure it is running in Cloud Dataflow mode), select “Add Data” in the left navigation and choose “Cloud Dataflow sources.” Search for your newly added Cloud Storage file set and add it to your active datasets in the BigQuery UI.
This will allow you to edit the schema of your file set after you select it in the nav tree. The “Edit schema” button is right there on the “Schema” tab. The visual schema editor is new and works for both Cloud Storage file sets as well as for Cloud Pub/Sub topics.
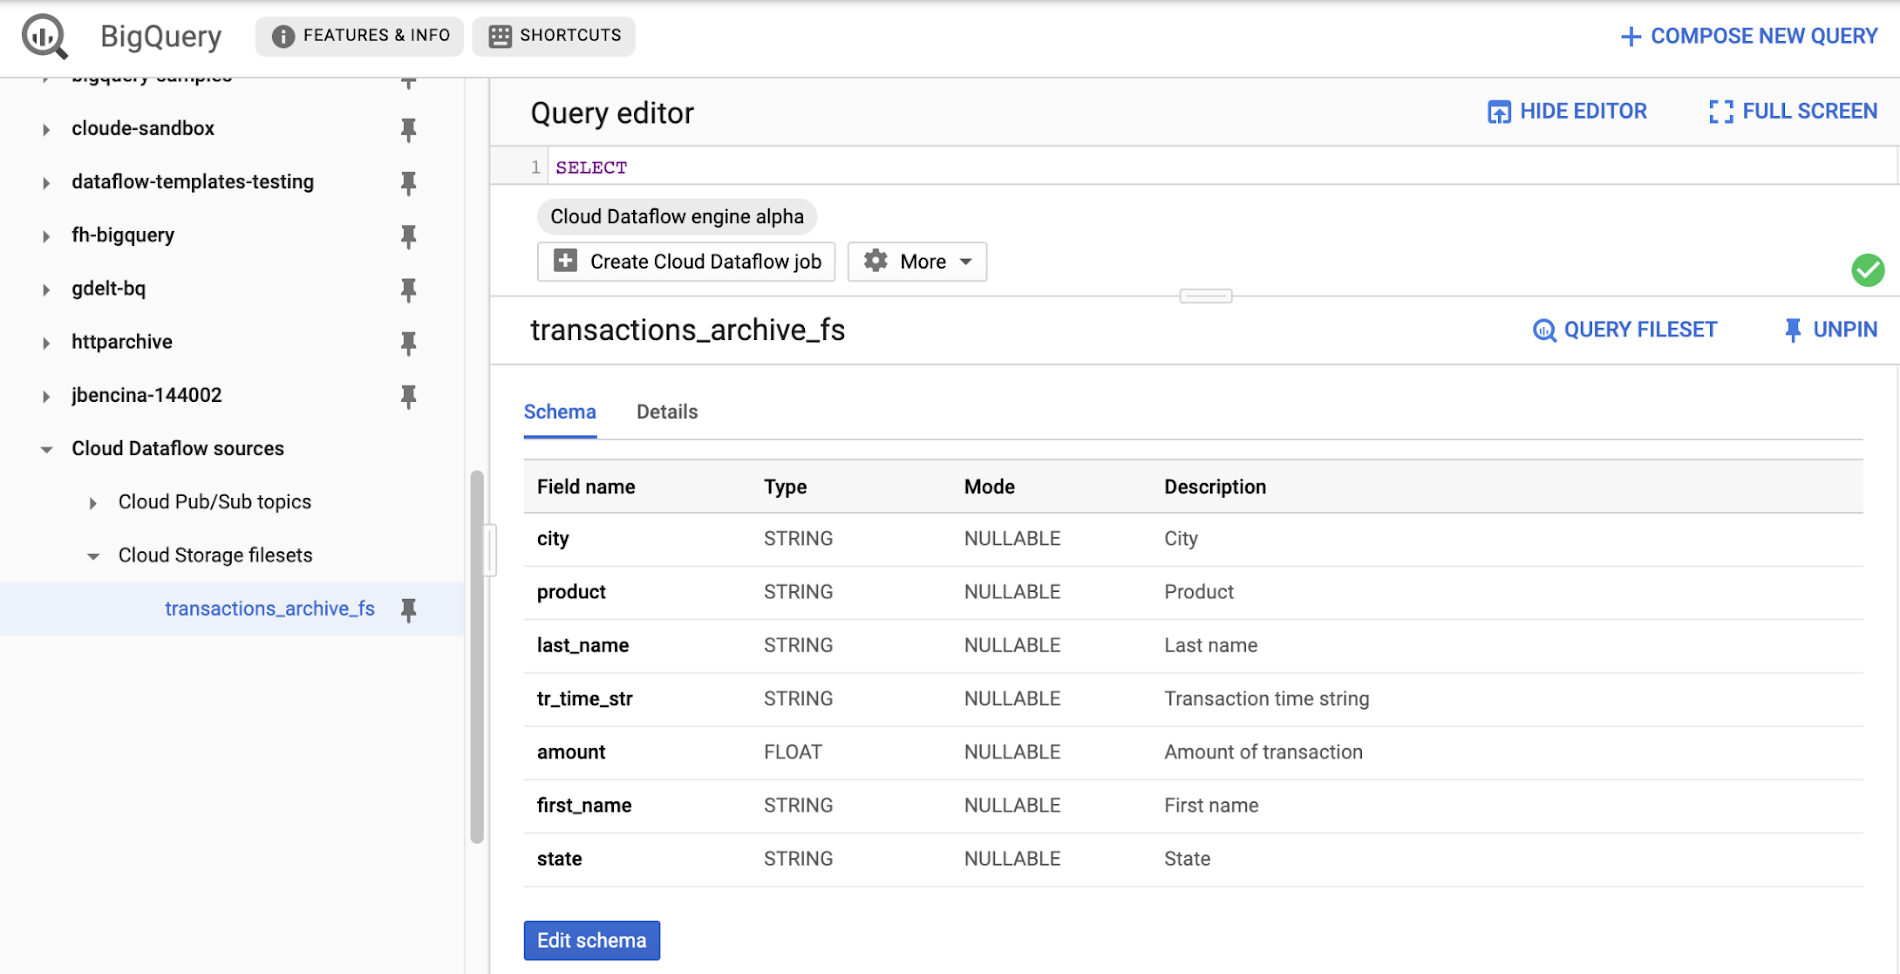
Once you’ve registered the file set in Data Catalog and defined a schema for it, you can query it in Cloud Dataflow SQL. In the next example, we’ll join the transactions archive in Cloud Storage with the metadata mapping table in BigQuery.
SELECTsr.sales_region,TUMBLE_START("INTERVAL 5 SECOND") AS period_start,SUM(tr.amount) as amountFROM datacatalog.entry.`dataflow-sql`.`us-central1`.transactions_archive_eg.transactions_archive_fs AS trINNER JOIN bigquery.table.`dataflow-sql`.dataflow_sql_ds.us_state_salesregions AS srON tr.state = sr.state_codeGROUP BYsr.sales_region,TUMBLE(CAST(tr.tr_time_str AS TIMESTAMP), "INTERVAL 5 SECOND")
Notice how similar this SQL statement is to the one that queries Cloud Pub/Sub. The TUMBLE window function even works on Cloud Storage files, although we will define the windows based on a field “tr_time_str” that is inside the files (the Cloud Pub/Sub SQL statement used the tr.event_timestamp attribute of the Cloud Pub/Sub stream). The only other difference is the reference to the Cloud Storage file set. We accomplish this by specifying datacatalog.entry.`dataflow-sql`.`us-central1`.transactions_archive_eg.transactions_archive_fs AS tr
Because both of the job inputs are bounded (batch) sources, Cloud Dataflow SQL will create a batch job (instead of a streaming job created for the first SQL statement using a Cloud Pub/Sub source) which will join your Cloud Storage files with the BigQuery table, and write the results back to BigQuery.
And now you have both a streaming pipeline feeding your real-time dashboard from a Cloud Pub/Sub topic, as well as a batch pipeline capable of onboarding historical data from CSV files. Check out the SQL Pipelines tutorial to start applying your SQL skills for developing streaming (and batch) Cloud Dataflow pipelines.
FlexRS for cost-effective batch processing of events
While real-time streaming processing is an exciting use case that’s growing rapidly, many streaming practitioners know that every stream processing system needs a sprinkle of batch processing (as you saw in the SQL example). When you bootstrap a streaming pipeline, you usually need to onboard historical data, and this data tends to reside in files stored in Cloud Storage. When streaming events need to be reprocessed due to changes in business logic (i.e., time windows get readjusted, or new fields are added), this reprocessing is also better done in batch mode.
The Apache Beam SDK and the Cloud Dataflow managed service are well-known in the industry for their unified API approach to batch and streaming analytics. The same Cloud Dataflow code can run in either mode with just minimal changes (usually replacing the data source from Cloud Pub/Sub to Cloud Storage). Remember our SQL example, where switching the SQL statement from a streaming source to a batch source was no trouble at all? And while it’s easy to go back and forth between streaming and batch processing in Cloud Dataflow, an important factor influencing the processing choice is cost. Customers who gravitate to batch processing have always looked to find the right balance between the speed of execution and costs. In many cases, that may mean you can be flexible with the amount of time it takes to process a dataset if the overall cost of processing is reduced in a significant fashion.
Our new Cloud Dataflow FlexRS feature reduces batch processing costs by up to 40% using advanced resource scheduling techniques and a mix of different virtual machine (VM) types (including the preemptible VM instances) to decrease processing costs while providing the same job completion guarantees as regular Cloud Dataflow jobs. FlexRS uses the Cloud Dataflow Shuffle service, which allows it to handle the preemption of worker VMs better because the Cloud Dataflow service does not have to redistribute unprocessed data to the remaining workers.
Using FlexRS requires no code changes in your pipeline and can be accomplished by simply specifying the following pipeline parameter:
--flexRSGoal=COST_OPTIMIZED
Running Cloud Dataflow jobs with FlexRS requires autoscaling, a regional endpoint in the intended region, and specific machine types, so you should review the recommendations for other pipeline settings. While Cloud Dataflow SQL does not yet support FlexRS, it will in the future.
Simultaneously with launching FlexRS in general availability, we are also extending its availability to five additional regions, covering all regions now where we have regional endpoints and Cloud Dataflow Shuffle:
- us-central1
- us-east1
- us-west1
- europe-west1
- europe-west4
- asia-east1
- asia-northeast1
To learn more about Cloud Dataflow SQL, check out our tutorial and try creating your SQL pipeline using the BigQuery web UI. Visit our documentation site for additional FlexRS usage and pricing information.
Check out other recently launched streaming and batch processing features:
- We deployed Cloud Dataflow Shuffle and Cloud Dataflow Streaming Engine to three additional regions, bringing total availability to seven regions.
- We launched the ability to protect your pipeline state with customer-managed encryption keys.
Python streaming support from Cloud Dataflow is now generally available.
Home Depot Leverages Google Cloud’s BigQuery and DataFlow to Break Data Silos and Craft Personalized CX

5006
Of your peers have already read this article.
4:00 Minutes
The most insightful time you'll spend today!
The Home Depot, Inc., is the world’s largest home improvement retailer with annual revenue of over $151B. Delighting our customers—whether do-it-yourselfers or professionals—by providing the home improvement products, services, and equipment rentals they need, when they need them, is key to our success.
We operate more than 2,300 stores throughout the United States, Canada, and Mexico. We also have a substantial online presence through HomeDepot.com, which is one of the largest e-commerce platforms in the world in terms of revenue. The site has experienced significant growth both in traffic and revenue since the onset of Covid-19.
Because many of our customers shop at both our brick-and-mortar stores and online, we’ve embarked on a multi-year strategy to offer a shopping experience that seamlessly bridges the physical and digital worlds. To maximize value for the increasing number of online shoppers, we’ve shifted our focus from event marketing to personalized marketing, as we found it to be far more effective in improving the customer experience throughout the sales journey. This led to changing our approach to marketing content, email communications, product recommendations, and the overall website experience.
Challenge: launching a modern marketing strategy using legacy IT
For personalized marketing to be successful, we had to improve our ability to recognize a customer at the point of transaction so we could—among other things—suspend irrelevant and unnecessary advertising. Most of us have experienced the annoyance of receiving ads for something we’ve already purchased, which can degrade our perception of the brand itself. While many online retailers can identify 100% of their customer transactions due to the rich information captured during checkout, most of our transactions flow through physical stores, making this a more difficult problem to solve.
Our old legacy IT system, which ran in an on-premises data center and leveraged Hadoop, also challenged us since maintaining both the hardware and software stack required significant resources. When that system was built, personalized marketing was not a priority, so it took several days to process customer transaction data and several weeks to roll out any system changes. Further, managing and maintaining the large Hadoop cluster base presented its own set of issues in terms of quality control and reliability, as did keeping up with open-source community updates for each data processing layer.
Adopting a hybrid approach
As we worked through the challenges of our legacy system, we started thinking about what we wanted our future system to look like. Like many companies, we began with a “build vs. buy” analysis. We looked at several products on the market and determined that while each of them had their strengths, none was able to offer the complete set of features we needed.
Our project team didn’t think it made sense to build a solution from scratch, nor did we have access to the third-party data we needed. After much consideration, we decided to adopt a solution that combined a complete rewrite of the legacy system with the support of a partner to help with the customer transaction matching process.
Building the foundation on Google Cloud
We chose Google Cloud’s data platform, specifically BigQuery, Dataflow, DataProc, Cloud Storage, and Cloud Composer. Google Cloud platform empowered us to break down data silos and unify each stage of the data lifecycle from ingestion, storage, and processing to analysis and insights. Google Cloud offered best-in-class integration with open-source standards and provided the portability and extensibility we needed to make our hybrid solution work well. The open standards of BigQuery’s BQ Storage API allowed us to leverage fast BQ storage layers to be utilized with other compute platforms, e.g., DataProc.
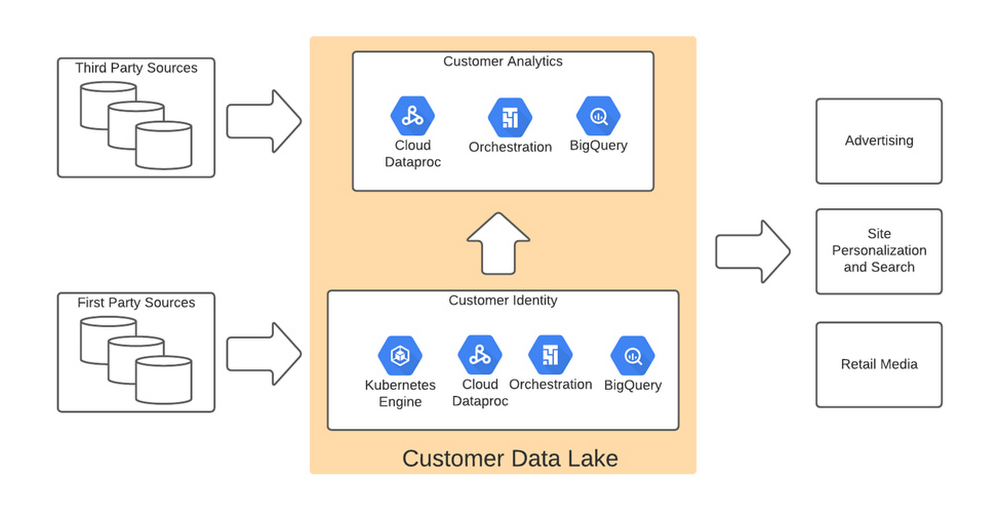
We used BigQuery combined with Dataflow to integrate our first- and third-party data into an enterprise data and analytics data lake architecture. The system then combined previously siloed data and used BigQuery ML to create complete customer profiles spanning the entire shopping experience, both in-store and online.
Understanding the customer journey with the help of Dataflow and BigQuery
The process of developing customer profiles involves aggregating a number of first- and third-party data sources to create a 360-degree view of the customer based on both their history and intent. It starts with creating a single historical customer profile through data aggregation, deduplication, and enrichment. We used several vendors to help with customer resolution and NCOA (Change of Address) updates, which allows the profile to be house-holded and transactions to be properly reconciled to both the individual and the household. This output is then matched to different customer signals to help create an understanding of where the customer is in their journey—and how we can help.
The initial implementation used Google Dataflow, Google’s streaming analytics solution, to load data from Google Cloud Storage into BigQuery and perform all necessary transformations. The Dataflow process was converted into BQML (BigQuery Machine Learning) since this significantly reduced costs and increased visibility into data jobs. We used Google Cloud Composer, a fully managed workflow orchestration service, to help orchestrate all data operations and DataProc and Google Kubernetes Engine to enable special case data integration so we could quickly pivot and test new campaigns. The architecture diagram below shows the overall structure of our solution.
Taking full advantage of cloud-native technology
In our initial migration to Google Cloud, we moved most of our legacy processes in their original form. However, we quickly learned that this approach didn’t take full advantage of the cloud-native and more improved features Google Cloud offered such as auto scaling of resources, flexibility to decouple storage from the compute layer, and a wide variety of options to choose the best tool for the job. We refactored our Hadoop-based data pipelines written in Java-based Map Reduce and our Pig Latin jobs to Dataflow and BigQuery jobs. This dramatically reduced processing time and made our data pipeline code concise and efficient.
Previously, our legacy system processes ran longer than intended, and data was not used efficiently. Optimizing our code to be cloud-native and leveraging all the capabilities of Google Cloud services resulted in reduced run times. We decreased our data processing window from 3 days to 24 hours, improved resource usage by dramatically reducing the amount of compute we used to possess this data, and built a more streamlined system. This in turn reduced cloud costs and provided better insight. For example, DataFlow offers powerful native features to monitor data pipelines, enabling us to be more agile.
Leveraging the flexibility and speed of the cloud to improve outcomes
Today, using a continuous integration/continuous delivery (CI/CD) approach, we can deploy multiple system changes each week to further improve our ability to recognize in-store transactions. Leveraging the combined capabilities of various Google Cloud systems—BigQuery, DataFlow, Cloud Composer, Dataproc, and Cloud Storage–we drastically increased our ability to recognize transactions and can now connect over 75% of all transactions to an existing household. Further, the flexible Google Cloud environment coupled with our cloud-native application makes our team more nimble and better able to respond to emerging problems or new opportunities.
Increased speed has led to better outcomes in our ability to match transactions across all sales channels to a customer and thereby improve their experience. Before moving to Google Cloud, it took 48 to 72 hours to match customers to their transactions, but now we can do it in less than 24 hours.
Making marketing more personal—and more efficient
The ability to quickly match customers to transactions has huge implications for our downstream marketing efforts in terms of both cost and effectiveness. By knowing what a customer has purchased, we can turn off ads for products they’ve already bought or offer ads for things that support what they’ve bought recently. This helps us use our marketing dollars much more efficiently and offer an improved customer experience.
Additionally, we can now apply the analytical models developed using BQML and Vertex AI to sort customers into audiences. This allows us to more quickly identify a customer’s current project, such as remodeling a kitchen or finishing a basement, and then personalize their journey by offering them information on products and services that matter most at a given point through our various marketing channels. This provides customers with a more relevant and customized shopping journey that mirrors their individual needs.
Protecting a customer’s privacy
With this ability to better understand our customers, we also have the responsibility to ensure we have good oversight and maintain their data privacy. Google’s cloud solutions provide us the security needed to help protect our customers’ data, while also being flexible enough to allow us to support state and federal regulations, like the California Customer Privacy Act. This way we can provide a customer the personalized experience they desire without having to fear how their data is being used.
With flexible Google Cloud technology in place, The Home Depot is well positioned to compete in an industry where customers have many choices. By putting our customers’ needs first, we can stay top of mind whenever the next project comes up.
More Relevant Stories for Your Company

A CIO’s Guide to Data Analytics and Machine Learning
Breakthroughs in artificial intelligence (AI) have captured the imaginations of business and technical leaders alike. The AI techniques underlying these breakthroughs are finding diverse application across every industry. Early adopters are seeing results, particularly encouraging is that AI is starting to transform processes in established industries, from retail to financial

Updating Twitter’s Ad Engagement Analytics Platform for the Modern Age
As part of the daily business operations on its advertising platform, Twitter serves billions of ad engagement events, each of which potentially affects hundreds of downstream aggregate metrics. To enable its advertisers to measure user engagement and track ad campaign efficiency, Twitter offers a variety of analytics tools, APIs, and

Getting Started with BigQuery: 10 Quick Steps
BigQuery is Google's fully managed, petabyte scale, low cost analytics data warehouse. BigQuery is NoOps—there is no infrastructure to manage and you don't need a database administrator—so you can focus on analyzing data to find meaningful insights, use familiar SQL, and take advantage of our pay-as-you-go model. That's great, right? So


GCP for Bioinformatics
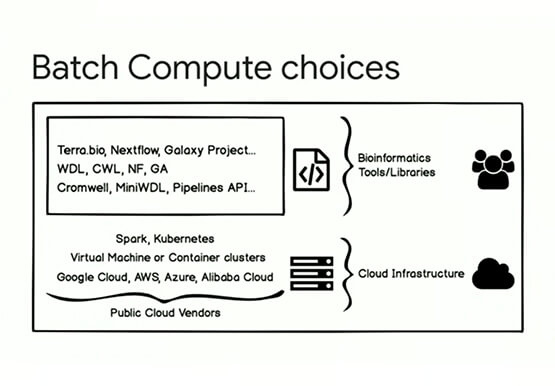
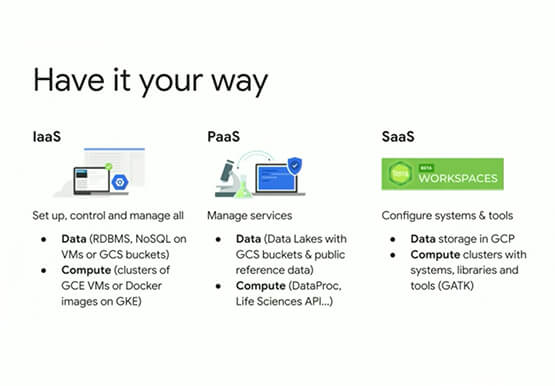
Join Cloud GDE and developer Lynn Langit in this fast-paced session to get resources you can use to learn how to use the Google Cloud Platform for bioinformatics. Lynn has created an open source course (on GitHub) to introduce researchers to using GCP to scale their analysis jobs. In this
